 Open Access Article
Electrochemical estimation of active site density on a metal-free carbon-based catalyst†
Arup Chakrabortya,
Bapi Beraa,
Divya Priyadarshanib,
Pradipkumar Leuaaa,
Debittree Choudhurya and
Manoj Neergat *a
*a
aDepartment of Energy Science and Engineering, Indian Institute of Technology Bombay (IITB), Powai, Mumbai-400076, India. E-mail: nmanoj@iitb.ac.in; Fax: + 91 22 2576 4890; Tel: + 91 22 2576 7893
bCentre for Research in Nanotechnology & Science, Indian Institute of Technology Bombay (IITB), Powai, Mumbai-400076, India
First published on 2nd January 2019
Abstract
Nitrogen-doped carbon is synthesized by the heat-treatment of carbon in an ammoniacal atmosphere at different temperatures. The active site density and electrochemically active surface area (ESA) of carbon and nitrogen-doped carbon catalysts are estimated from the charge due to oxidation of the adsorbed anthraquinone-2-sulfonate (AQS) probe molecule. In the potential window of interest and over a range of concentrations, there is no unwanted side reaction or polymerization of the probe molecule that interferes with the electrochemical estimation of active site density. Most importantly, the adsorbed AQS can easily be removed from the electrode surface by potential cycling. The ORR activity and active site density of the catalysts derived from AQS-adsorption have similar trends. The active site density and turnover frequency towards ORR estimated using the AQS-adsorption method are in line with those reported in the literature by other methods. On the other hand, the results show that the wetted surface area estimated from the double layer capacitance does not always correlate with catalytic activity.
1. Introduction
Specific adsorption of ionic species on an electrode surface is one of the fundamental processes in the field of surface electrochemistry. This adsorption property is used to estimate the electrochemically active surface area (ESA) of metals. For instance, the reversible hydrogen adsorption/desorption voltammogram is conventionally used to estimate the ESA and active site density of platinum and other precious-metal nanoparticles.1–5 Stripping voltammetry of adsorbed Cu and CO molecules on the platinum surface is an alternative technique; the obtained active site density is correlated with the activity towards the oxygen reduction reaction (ORR).5–7 Whereas, carbon and other non-precious metal catalysts (NPMCs) do not specifically adsorb hydrogen and other ions from aqueous electrolytes. Therefore, estimation of ESA using the adsorption voltammogram is rarely reported in the literature.8,9Malko et al. recently used the nitrite ion as the probe molecule to estimate the active site density of an Fe/N–C catalyst using voltammetry; Fe was assumed as the active center.8 In a similar way, the complex formation ability of Fe with cyanide was used in another electrochemical method for an Fe/N–C catalyst.9 Besides, physical methods such as neutron activation and Mössbauer spectroscopy were also used to identify the possible ORR active centers in an Fe/N–C catalyst.10–13 Recently, low temperature pulse CO chemisorption was applied to estimate the active site density of NPMCs, assuming the metal as the only ORR active center.14 It was reported that, even at low temperatures (193 ± 5 K), CO does not adsorb on the nitrogen center of the catalyst. In another report, NO(g) was used as the probe molecule to detect the iron center in Fe/N–C catalyst.13 Thus, development of an electrochemical method to estimate the active site density of metal-free carbon and nitrogen-doped carbon is paramount.
In our previous work, a catechol molecule was used as a probe to estimate the active site density.15 The experiment was conducted based on the method proposed by Kanazawa et al. and was performed with minor modification.16 In this method, the in situ generated oxidized products of catechol bind to the active sites on the catalyst surface. This method yields reasonable estimate of the active site density at low concentration of catechol in the limited potential window for optimized adsorption duration. The base of the voltammogram of catechol-adsorbed electrode overlaps with the background voltammogram only at low concentrations, i.e., the capacitive contribution to the voltammograms of catechol-adsorbed electrode matches with the capacitance of the respective bare electrode.15
At higher concentrations of catechol, unwanted electrochemical reactions occur and the polymerized catechol adsorbs on the electrode surface as proposed by others.17–19 This leads to an overestimation of the catechol adsorption charge and the active site density. Furthermore, the base of the voltammogram of catechol-adsorbed electrode recorded after cycling in catechol solution of higher concentration does not overlap with the background voltammogram in the limited or wider potential window, i.e., the capacitive contribution in the voltammograms of catechol-adsorbed electrode does not match with the bare electrode. In such conditions, it is difficult to estimate the active site density of the catalyst.
On the other hand, while using the anthraquinone-2-sulfonate (AQS) molecule, a single saturated peak of the adsorbed AQS voltammogram is obtained at any concentration. Irrespective of the AQS concentration, the base of the adsorption voltammogram matches with the background voltammogram recorded in AQS-free supporting electrolyte.
Therefore, AQS is used as a probe molecule to estimate the active site density. This method provides reproducible results over a wide range of AQS concentrations and potentials. Moreover, it can be easily removed from the electrode surface, as compared to that of catechol.
The ORR voltammograms are recorded on carbon, nitrogen-doped carbon and the HNO3 treated catalysts in argon-saturated 0.1 M KOH media. It is observed that the ORR activity and the active site density estimated from the AQS-adsorption method have similar trends. Furthermore, the wetted surface area of the catalysts is calculated from the double layer capacitance estimated using electrochemical impedance spectroscopy (EIS). It is shown that the catalytic activity may not always correlate with the wetted surface area.
2. Experimental details
2.1. Materials
Anthraquinone-2-sulfonic acid sodium salt monohydrate (AQS; C14H7NaO5S·H2O), 1,2-dihydroxybenzene (catechol; 1,2-C6H4(OH)) and Nafion® suspension (5 wt% solution in lower aliphatic alcohols/H2O mix) were purchased from Sigma Aldrich. 2-Propanol ((CH3)2CHOH), potassium dihydrogen phosphate (KH2PO4), dipotassium hydrogen phosphate (K2HPO4), potassium chloride (KCl), nitric acid (HNO3) and ammonia (NH3) were purchased from Merck. All the chemicals were used without further purification. De-ionized (DI) water was obtained from Direct-Q Millipore de-ionizer.2.2. Synthesis of N-doped carbon (N/C)
N-doped carbon was synthesized by the heat-treatment of 100 mg carbon black (Vulcan XC-72) with nitrogen precursor at appropriate temperature.15,20,21 Prior to the heat-treatment, the carbon sample, taken in a dry quartz boat and kept in a quartz tubular furnace, was purged with argon for 15 min. After purging out the air inside the furnace, the carbon sample was heat-treated in an ammoniacal argon (argon gas purged through 30% ammonia solution) atmosphere for nitrogen-doping. After the heat-treatment at the desired temperature for three hours, the furnace was allowed to cool to room temperature. The collected sample was ground well in a mortar with a pestle and was preserved for further characterization. The samples heat-treated at 1000, 900, 800 and 700 °C are labeled as N/C 1000, N/C 900, N/C 800, N/C 700, respectively, in this manuscript.2.3. HNO3 treatment of carbon
Carbon black (Vulcan XC-72) (∼100 mg) was dispersed in 50 mL HNO3 (69%) solution and was stirred overnight at 80 °C. The dispersion was centrifuged at 10![[thin space (1/6-em)]](https://www.rsc.org/images/entities/char_2009.gif) 000 rpm rotation to get the black residue. The residue was washed repeatedly with DI water by centrifugation at 10
000 rpm rotation to get the black residue. The residue was washed repeatedly with DI water by centrifugation at 10![[thin space (1/6-em)]](https://www.rsc.org/images/entities/char_2009.gif) 000 rpm to get the neutralized supernatant. The cleaned residue was kept in a hot-air oven (∼80 °C) to dry it. The sample was collected and ground in a mortar pestle to get the uniform powder. The powder was used for further characterization and labeled as HNO3 treated carbon.22,23
000 rpm to get the neutralized supernatant. The cleaned residue was kept in a hot-air oven (∼80 °C) to dry it. The sample was collected and ground in a mortar pestle to get the uniform powder. The powder was used for further characterization and labeled as HNO3 treated carbon.22,23
2.4. Electrochemical characterization
Cyclic voltammograms were recorded with a Bi-potentiostat (“Wavedriver 20” from Pine Instrument USA) in a three-electrode cell configuration. Bio Logic SP300 (from France) was used to record the impedance spectra in a three-electrode configuration. AC amplitude of 5 mV rms was used to record the impedance data in the frequency range of 10 kHz to 50 mHz and the same were analyzed using the complex non-linear least square (CNLS) method with “ZSimpWin” software. A double junction Ag/AgCl (saturated with KCl) was used as a reference electrode and high surface area platinum coil as a counter electrode. A polished GCE (geometric surface area 0.196 cmg2) and catalyst deposited GCE were used as the working electrodes. Prior to the experiments, GCE was polished using alumina MasterPolish suspension from Buehler and was cleaned with DI water by one-minute ultrasonication. Catalyst ink was prepared by sonicating a mixture of 5 mg catalyst with 5 mL DI water, 10 mL iso-propanol and 10 μL Nafion® solution for 30 min.24 The well-dispersed ink was drop-cast on a polished GCE to get a loading of ∼136 μg cmg−2; the electrode was dried at room temperature for 2 h. The voltammograms were recorded in the desired electrolyte at a scan rate of 20 mV s−1. All the potentials are reported with respect to standard Ag/AgCl (saturated KCl) electrode in this manuscript. The ORR activity of the catalyst was recorded in oxygen-saturated 0.1 M KOH solution.The catechol adsorption was performed by the method reported earlier by our group.15
2.5. Physical characterization
X-ray photoelectron spectroscopy (XPS) of the catalyst samples was recorded with Kratos Analytical, UK spectrometer using Al Kα radiation. The spectrum was fitted with XPS peak fit 4.1 software. The BET surface area of the porous catalysts was measured using the Smart instrument BET surface analyzer (Smart Sorb 92/93).3. Results and discussion
3.1. Voltammograms of catechol-adsorbed and AQS-adsorbed N/C 900
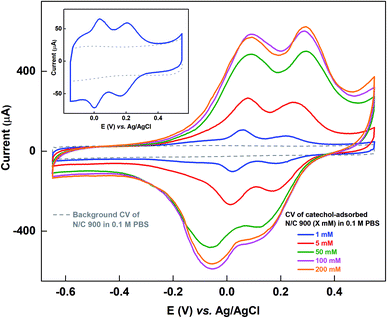
Fig. 1 shows the voltammograms of catechol-adsorbed N/C 900 catalyst recorded in catechol-free argon-saturated 0.1 M PBS (pH 7) along with the respective background voltammogram in the potential window of −0.65 to 0.55 V. The catalyst is cycled in catechol solutions of different concentrations and then the voltammogram of the catechol-adsorbed electrode is recorded in argon-saturated 0.1 M PBS (pH 7). In the previous work, the voltammograms of catechol-adsorbed electrode were recorded in the potential window of −0.15 to 0.55 V, and 1 mM catechol was used to adsorb catechol (shown in the inset of Fig. 1).15 The origin of the two peaks observed in the voltammogram of catechol-adsorbed electrode was discussed in detail in a previous manuscript.15 The experiment was performed on the basis of the method proposed by Kanazawa et al., but with minor modification.16 During the potential cycling of the catalyst in the catechol solution, the in situ generated oxidized products of catechol adsorb on the active sites of the catalyst. Under the experimental conditions, it was observed that the base of adsorption voltammogram matches with the background voltammogram and it was assumed that the active sites on the catalyst surface binds with the catechol molecule.Whereas, as shown in Fig. 1, at the extended potential window of −0.65 to 0.55 V, with 1 mM and higher concentration of catechol solution, the double layer region of the voltammogram for adsorbed-catechol electrode expands and the background correction is erroneous, as the straight-line correction method is used to estimate the adsorbed-catechol charge.
Table S1† shows the charge due to adsorbed-catechol on N/C 900 catalyst at different concentrations. The charge for the catechol adsorption is estimated after the straight-line correction from the voltammogram of catechol-adsorbed catalysts as shown in Fig. S1.† It increases with the catechol concentration and almost saturates at ∼6.8 mC with 100 mM and 200 mM catechol concentrations
It is believed that, in case of the catechol-adsorption method, the oxidized products generated with potential cycling adsorb on the catalyst surface.16 Thus, instead of catechol or any other reduced probes, if an oxidized compound, which adsorbs on carbon can be supplied as the probe molecule, it can easily be attached on the surface at lower concentration of redox species. Also, the AQS-adsorption peak appears at such a potential, where no side reaction like hydrogen evolution can take place. Thus, AQS has been chosen as an adsorbate.
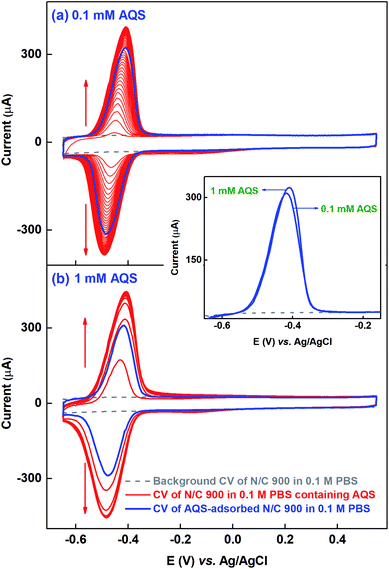
Similar kinds of experiments, as that with catechol molecule, are performed at different concentrations to get the saturated surface-coverage with the probe molecule. Fig. 2(a) shows the voltammogram of N/C 900 catalyst recorded in the potential range of −0.65 to 0.55 V in 0.1 mM AQS dissolved in 0.1 M PBS (pH 7) solution (red). It takes ∼40 potential cycles to get the electrode surface saturated with AQS (overlapping voltammograms). Whereas, while using the 1 mM AQS, the electrode surface gets saturated by 4–5 potential cycles as shown in the voltammogram of Fig. 2(b) (red). As the experiments are performed on completely wetted surface of the catalyst, the increment of the current with potential cycles is due to the accumulation of the AQS molecule on the catalyst surface.
After potential cycling in bulk AQS solution, the electrode is washed by rotating at 1600 rpm for an optimized time of 20 min in 0.1 M PBS (pH 7) to remove the pore volume trapped-AQS, i.e., unbound or weekly bound AQS from the catalyst surface. Subsequently, the electrode is potential cycled in 0.1 M PBS (pH 7) to record the voltammogram of AQS-adsorbed N/C 900, shown in Fig. 2 (blue voltammogram). The integrated charge from the voltammogram of AQS-adsorbed N/C 900 (blue) is lower than that of the voltammogram of N/C 900 (red) recorded in bulk AQS solution. The decrease in charge justifies the requirement of washing the catalyst surface in AQS-free supporting electrolyte prior to recording the voltammogram of AQS-adsorbed electrode in 0.1 M PBS (pH 7).
The redox peak of voltammograms is centered at ∼−0.44 V and the possible redox reaction is a two-electron process, given in Scheme 1.25
For comparison, the oxidation peak from the voltammograms of AQS-adsorbed N/C 900 after potential cycling in 0.1 mM and 1 mM AQS are shown in the inset to Fig. 2. The base of the voltammograms of AQS-adsorbed electrode matches with the background voltammogram at the lower and the higher potentials. Thus, it is possible to correct for the background charge properly and to calculate the charge due to surface-adsorbed AQS correctly. The comparable charge (∼1.40 mC) from both the background corrected voltammograms of AQS-adsorbed N/C 900 suggests that active sites of the catalyst are saturated with AQS and it is assumed that each active site on the catalyst surface adsorbs one AQS molecule; further evidence towards the aforementioned is discussed below.
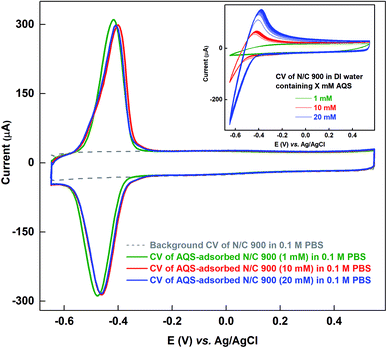
As the solubility of AQS in 0.1 M PBS (pH 7) is poor (∼1 mM) at room temperature, and it is ∼20 mM in DI water, the N/C 900 is allowed to adsorb AQS from its aqueous solution of different concentrations. Fig. 3 shows the voltammograms of the AQS-adsorbed N/C 900 recorded in AQS-free 0.1 M PBS after potential cycling in three different concentrations of aqueous AQS solutions (1, 10, and 20 mM). Inset to Fig. 3 shows the voltammograms of N/C 900 electrode during the potential cycling in water containing AQS solution. It is observed that the oxidation and reduction current increase with the concentration of AQS during the potential cycling. Whereas, the oxidation charge of the adsorbed species does not change as shown in the respective voltammograms of AQS-adsorbed electrode. It suggests that the active sites on the catalyst surface are saturated with AQS. Moreover, the charge due to oxidation of adsorbed-AQS obtained after potential cycling in aqueous solution of AQS is comparable with that of the catalyst cycled in 0.1 M PBS (pH 7) (∼1.4 mC). It further confirms that the AQS adsorbed on the catalyst surface is of same quantity (inset of Fig. 2 and main figure of Fig. 3). Thus, it can be used to estimate the active site density of the catalyst convincingly.
Furthermore, the problem related to the catechol-adsorption method is investigated by replacing the surface-adsorbed AQS with catechol molecule. This discussion is given in the ESI.†
3.2. Recovery of the active sites
The active sites on the surface of the AQS-adsorbed electrode can be recovered by cycling the electrode in argon-saturated 0.1 M KOH in the potential range of −1.0 to 0.0 V. Fig. 4 shows the cyclic voltammograms of the AQS-adsorbed N/C 900 in argon-saturated 0.1 M KOH media. After the initial 4–5 cycles, no adsorption peak is observed. The cleaned catalyst is again cycled in 0.1 M PBS (pH 7) to check the effectiveness of electrochemical cleaning.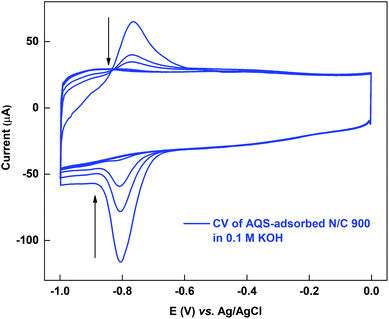 | ||
| Fig. 4 Voltammogram of AQS-adsorbed N/C 900 potential cycled in argon-saturated 0.1 M KOH (pH 13) at 20 mV s−1 scan rate. | ||
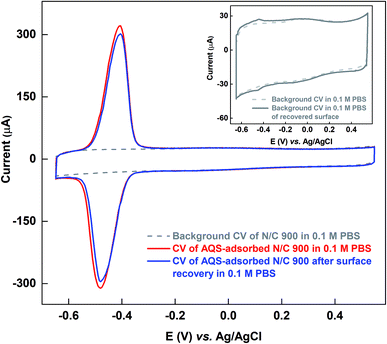
Fig. 5 shows the comparison of the voltammograms of AQS-adsorbed N/C 900 and after recovery of the active sites by KOH cleaning with that of the fresh N/C 900. AQS binds with the surface during the adsorption. It is necessary to ensure that the adsorbed molecule can be removed, after estimating the active sites. For this, the KOH cleaning method is used. On a cleaned electrode, AQS is adsorbed again by potential cycling (as in Fig. 2). The electrode is washed to remove pore-volume trapped AQS for 20 min. The voltammogram is subsequently recorded in AQS-free 0.1 M PBS (pH 7) supporting electrolyte. Comparable adsorption charge (∼1.4 mC) is obtained for both voltammograms in Fig. 5. The overlapping background voltammograms of N/C 900 and that of the recovered surface as shown in the inset of Fig. 5 supports the effectiveness of electrochemical cleaning method.
3.3. Estimation of the active site density, electrochemically active surface area (ESA) and wetted surface area of catalysts: correlation with ORR activity
The voltammograms of AQS-adsorbed electrode is used to estimate the active site density and ESA of the catalysts, and the estimated active sites are correlated with their ORR activity. The wetted surface area is estimated from the double layer capacitance measured using the EIS in AQS-free argon-saturated 0.1 M PBS (pH 7), where the electrochemical surface behaves like a capacitor, and faradaic contribution is negligible. Nitrogen-doped carbon catalysts are used initially for these estimations, and thereafter, the data with HNO3 treated catalysts are presented. At the end, the difference between the ESA and wetted surface area are discussed.3.3.1.1 Voltammograms of AQS-adsorbed nitrogen-doped carbon. The nitrogen-doped carbon catalysts are prepared by the heat-treatment of the carbon in ammonia atmosphere at various temperatures. The surface nitrogen content (at%) of the catalysts measured from the XPS is provided in Table S3.† It confirms that the carbon surface is doped with nitrogen. It is observed that the surface nitrogen content is highest (∼1.06 at%) for N/C 900 among all the nitrogen-doped catalysts. During the heat-treatment, the BET surface area and surface oxygen content (at%) of the nitrogen-doped carbon changes as shown in Table S3† and it is in the order N/C 1000 > N/C 900 > N/C 800 > N/C 700 > C.15 The increment of BET surface area suggests that the surface area increases with the heat-treatment temperature.
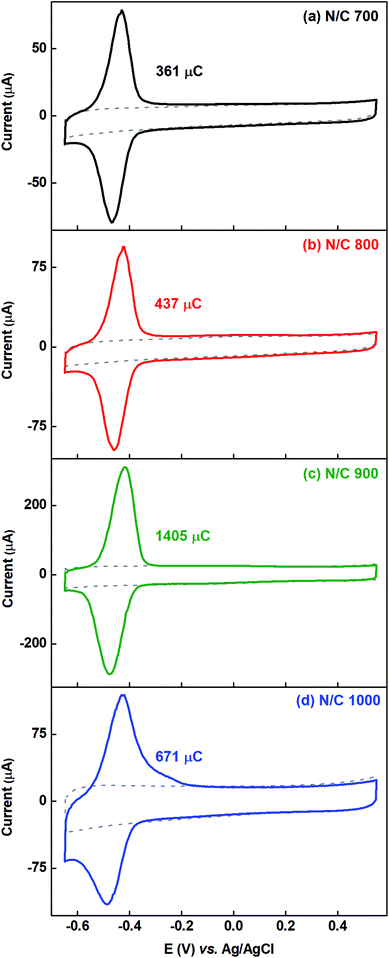
Fig. 6 shows the voltammograms of AQS-adsorbed nitrogen-doped carbon recorded in argon-saturated AQS-free 0.1 M PBS (pH 7) with their respective background voltammograms. To estimate the charge due to adsorption of AQS, the background voltammogram is subtracted from the voltammogram of AQS-adsorbed electrode. The charge due to oxidation of the adsorbed species is given in the respective figures and it is in the order N/C 900 > N/C 1000 > N/C 800 > N/C 700. This order is the same as that obtained in our previous work using catechol as a probe molecule.15 It was concluded that, N/C 900 has maximum active sites (mainly the nitrogen, oxygenated groups, edge sites etc.). Thus, the oxidation charge due to adsorbed-AQS on the N/C 900 is highest among all the nitrogen-doped catalysts.
The estimation method of active site density, ESA and the wetted surface area of the catalysts are discussed in the following section.
3.3.1.2 Estimation of the active site density, electrochemically active surface area (ESA) and wetted surface area. The adsorption charge measured from the voltammogram of AQS-adsorbed catalyst is used to estimate the active site density by the following eqn (1).15
 | (1) |
In eqn (1), SDM is mass specific site density, N is Avogadro number (6.023 × 10²³ sites per mol), n is the number of electrons, F is Faraday constant (96![[thin space (1/6-em)]](https://www.rsc.org/images/entities/char_2009.gif) 485 C mol−1), and m is the mass of the catalyst (26.6 μg) loaded on the GCE. The estimated site density per unit gram of catalyst is tabulated in Table 1. The estimation method is based on the assumption that each active site on the catalyst surface adsorbs one AQS molecule. The number of electron transferred (n) is taken as 2 for the calculation.
485 C mol−1), and m is the mass of the catalyst (26.6 μg) loaded on the GCE. The estimated site density per unit gram of catalyst is tabulated in Table 1. The estimation method is based on the assumption that each active site on the catalyst surface adsorbs one AQS molecule. The number of electron transferred (n) is taken as 2 for the calculation.
| Catalyst | Active site density (1020 sites per g) | ESA (using adsorbed AQS) (104 cmc2 g−1) | Awet (using impedance) (104 cmc2 g−1) |
|---|---|---|---|
| C | 0.32 | 0.83 | 18.19 |
| N/C 700 | 0.43 | 1.11 | 20.62 |
| N/C 800 | 0.52 | 1.34 | 21.83 |
| N/C 900 | 1.64 | 4.31 | 69.15 |
| N/C 1000 | 0.78 | 2.04 | 58.21 |
| HNO3 treated C | 0.33 | 0.86 | 105.76 |
| HNO3 treated N/C 900 | 0.64 | 1.66 | 188.01 |
Eqn (2) is used to calculate the ESA of the catalysts and the normalizing factor is 611 μC cmc−2 (charge of unit surface area on graphite). It is obtained by multiplying the carbon atomic density (3.82 × 10¹⁵ atomc cmc−2) with the electronic charge (1.6 × 10¹⁹ C e−1).15,26
 | (2) |
The estimated ESA of the catalysts is tabulated in Table 1.
The wetted surface area is estimated using the EIS as reported in the literature.15,27,28 In the Nyquist plot, the characteristics of an ideal capacitor is a vertical line. Whereas, in case of electrochemical capacitor, it generally starts with a 45° line and approaches to a vertical line at low frequencies.20,28 For an electrochemical capacitor, at low frequency, the capacitance generally becomes almost constant as usually observed in the capacitance vs. frequency plot.29 At very low frequencies, where the imaginary part of the impedance dominates, the capacitance value extracted from the Nyquist plot follows the same trend as the capacitance measured from voltammetry or the current charge/discharge curves.30,31 Thus, the double layer capacitance (Cdl) is measured using the eqn (3) given below.
 | (3) |
In eqn (3), the Zimg is the imaginary part of the impedance. The impedance data is recorded in the argon-saturated 0.1 M PBS (pH 7) at 0.2 V. The measured double layer capacitance (Cdl) of the catalysts is tabulated in Table S4.† The potential 0.2 V is chosen to record the impedance because no faradaic process is observed at this potential.
The wetted surface area of the sample is calculated using the measured double layer capacitance (Cdl) from EIS using the eqn (4).27,28
 | (4) |
In eqn (4), ε0 and εr are the absolute and relative dielectric permittivities of value 8.854 × 10⁻¹² F m−1 and 7 (the relative permittivity for inner Helmholtz layer), respectively. Awet is the wetted surface area, and d is the double layer thickness (∼0.2 nm).
3.3.1.3 Oxygen reduction reaction on the nitrogen-doped carbon in 0.1 M KOH media. The ORR voltammograms are recorded in oxygen-saturated 0.1 M KOH medium for the nitrogen-doped carbon catalysts. Fig. S5† shows the ORR voltammograms of the nitrogen-doped carbon samples along with their Tafel plots as shown in our previous work.15 The kinetic current for the ORR is tabulated in Table 2. A comparison plot of active site density and ORR activity of different catalysts is provided in Fig. S6.†
| Catalyst | ORR current density Ik (mA cmg−2) at −0.25 V vs. Ag/AgCl | ToF (at −0.25 V vs. Ag/AgCl) (e− per site per s) | ToF (at 0.8 V vs. RHE) (e− per site per s) |
|---|---|---|---|
| C | 0.260 | 0.36 | 0.019 |
| N/C 700 | 0.593 | 0.63 | 0.033 |
| N/C 800 | 1.044 | 0.92 | 0.072 |
| N/C 900 | 6.039 | 1.69 | 0.248 |
| N/C 1000 | 2.246 | 1.32 | 0.148 |
| HNO3 treated C | 0.371 | 0.53 | 0.020 |
| HNO3 treated N/C 900 | 1.302 | 0.37 | 0.021 |
It is observed that for nitrogen-doped carbon catalysts, the estimated ESA (in Table 1), wetted surface area (in Table 1) and the ORR activity of the catalysts (in Table 2) are in the order N/C 900 > N/C 1000 > N/C 800 > N/C 700.
To further confirm the effectiveness of the proposed method, experiments were performed on the HNO3 treated catalyst and is discussed in the following section.
3.3.2.1 Voltammograms of AQS-adsorbed HNO3 treated catalysts: differentiation between electrochemically active surface area (ESA) and wetted surface area. As representative catalysts, carbon and N/C 900 are treated with HNO3. The surface-nitrogen and oxygen content estimated from the XPS and the measured BET surface area are tabulated in Table S3.† After HNO3 treatment, the nitrogen content in the carbon sample does not change. But the oxygen content increases from ∼ 1 to ∼ 11 at%. Whereas, for N/C 900, the oxygen content increases from ∼5.48 to ∼16 at%. The BET surface area of the both catalysts decreases after acid treatment (69% HNO3) and it is in the order of N/C 900 > C > HNO3 treated N/C 900 > HNO3 treated C. Similar observation was reported by another group as well.23 It is found that the impurities from the carbon surface are removed on treatment with low concentration of HNO3 and the BET surface area increases. On treatment with HNO3 of higher concentration, the BET surface area decreases due to blocking of the pores and the surface is occupied with oxygenated groups.23
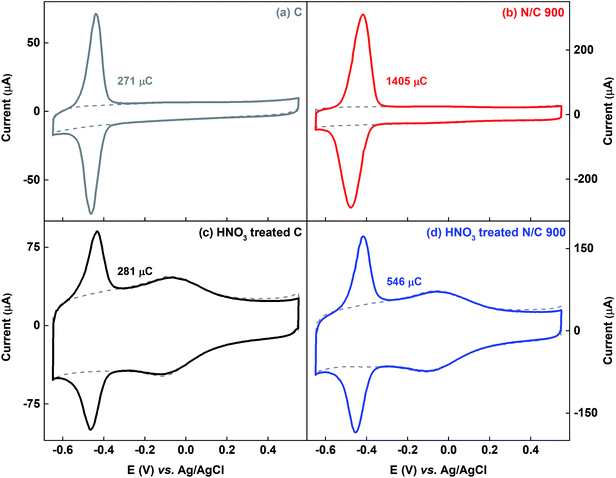
Fig. 7 shows the voltammograms of AQS-adsorbed carbon and N/C 900 along with that of the HNO3 treated samples. The estimated charge due to adsorbed-AQS is given in the respective figures. After HNO3 treatment of the carbon catalyst, almost no change is observed in the charge due to adsorption of AQS, whereas, it decreases after HNO3 treatment for N/C 900. The measured active site density changes from 1.64 × 10²⁰ to 0.64 × 10²⁰ sites per g for N/C 900 catalysts as given in the Table 1. One of the possible reasons may be the decrement in the BET surface area of the N/C 900 from ∼ 460 m2 g−1 to ∼125 m2 g−1, possibly due to blocking of the pores. Whereas, after HNO3 treatment, the wetted surface area of the carbon and the N/C 900 catalyst increases significantly in comparison to their non-treated sample. The estimated wetted surface area is given in Table 1.
Thus, while comparing, it is observed that the wetted surface area of the catalysts increases after HNO3 treatment, though, the ESA does not follow the same trend.
In the next section, a comparison of the activity towards the ORR is shown for carbon and N/C 900 with their respective HNO3 treated catalysts.
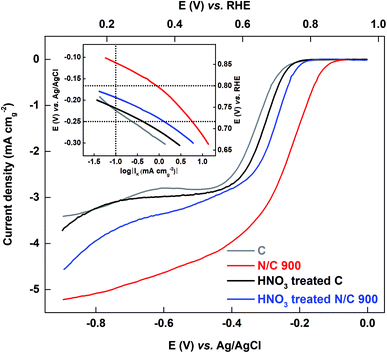
3.3.2.2 Comparison of oxygen reduction reaction on the HNO3 treated and untreated catalyst in 0.1 M KOH media. The ORR voltammograms are recorded in oxygen-saturated 0.1 M KOH medium. Fig. 8 shows the comparison plot of the ORR voltammograms for carbon and N/C 900 along with their HNO3 treated catalysts. The Tafel plots are shown in the inset of the Fig. 8. The activity of catalysts is tabulated as kinetic current in Table 2.
After HNO3 treatment, the activity of the carbon is almost constant and the activity of N/C 900 decreases; the trend is N/C 900 > HNO3 treated N/C 900 > HNO3 treated C ≈ C. This order is the same as the ESA of the catalysts estimated using the AQS-adsorption technique; the wetted surface area does not follow the same order.
Thus, it can be concluded that the ESA of the catalyst is different from that of wetted surface area of the catalyst; using AQS adsorption method active site density can be estimated.
| IM (fixed E) = SDM × ToF (fixed E) × e | (5) |
In eqn (5), IM is the mass activity (A g−1), the kinetic current normalized by the mass of the loaded catalyst on the glassy carbon electrode, SDM is the site density (sites per g), and e is the electronic charge (1.6 × 10⁻¹⁹ C).
The ToF value at −0.25 V vs. Ag/AgCl is calculated using the eqn (5) based on the site density measured using the adsorbed-AQS and is given in the Table 2. Except N/C 900 and N/C 1000, all the other catalysts show low kinetic current density (below 0.1 mA cmg−2) at 0.8 V vs. RHE. Thus, the ToF values needs to be extrapolated for other catalysts. The obtained ToF value at −0.25 V vs. Ag/AgCl is extrapolated to 0.8 V vs. RHE using the eqn (6) given below.10,32
 | (6) |
The estimated ToF values towards ORR of the catalysts at 0.8 V vs. RHE are tabulated in Table 2. It is observed that for the carbon and nitrogen-doped catalysts the ToF value is in the range of 0.019–0.248 e− per site per s, which is slightly lower than the previously reported value using the catechol-adsorption method (0.059–0.568 e− per site per s).15 The estimated ToF values for carbon and nitrogen-doped carbon catalysts are almost one to two orders of magnitude lower than that reported with Fe–N/C catalysts (∼1.5 or 1.6 e− per site per s) using nitrite adsorption and combined Mössbauer and CO adsorption methods.8,12 Guo et al. reported the ToF values for the nitrogen-doped HOPG and nitrogen-doped graphene at 0.5 V vs. RHE and it is 0.07–0.14.26 Instead of ESA, the active BET surface area of the catalysts was taken for normalization. The active BET surface area was calculated by multiplying the BET surface area with possible active nitrogen content in the catalysts estimated using the XPS.
4. Conclusions
Voltammograms of AQS-adsorbed carbon and nitrogen-doped carbon surfaces are recorded in the argon-saturated 0.1 M PBS (pH 7) solution. The charge due to adsorbed-AQS represents the active site density, viz., the ESA and it is in the order of N/C 900 > N/C 1000 > N/C 800 > N/C 700 > C. A similar trend is observed for the activity towards oxygen reduction reaction recorded in alkaline media. Besides, the turnover frequency (ToF) of the catalysts towards oxygen reduction is calculated using the estimated charge. The ToF is in line with the data reported using other methods in the literature for NPMCs. Moreover, carbon and N/C 900 catalysts are functionalized by the HNO3 treatment. It is observed that, after functionalization, though the double layer capacitance or the wetted surface area of the catalyst increases, the ESA for the carbon is almost constant and for the N/C 900 catalyst it decreases; the ORR activity of the catalysts follows the same trend. It suggests that the wetted surface area and the ESA do not follow the same trend.In comparison to catechol adsorption method, AQS provides single, reproducible, and saturated voltammetric peak for adsorption over a broader concentration range and potential window. No unwanted side reaction is observed, which makes the process more reliable. Furthermore, the surface-adsorbed AQS can be removed easily by the proposed electrochemical cleaning method; the clean surface can be used for further electrochemical characterization.
Conflicts of interest
There are no conflicts of interest to declare.Acknowledgements
The authors would like to acknowledge National Centre for Photovoltaic Research and Education (NCPRE, P16MNRE002) Phase-II and India-UK centre for Education and Research in Clean Energy (IUCERCE, 16DST050) for financial support to carry out the work. The Department of Metallurgical Engineering and Materials Science (MEMS) and the Department of Physics, both at IIT Bombay, are acknowledged for allowing us to use the facility to measure the BET surface area and to record the XPS spectra, respectively.References
- H. A. Gasteiger, S. S. Kocha, B. Sompalli and F. T. Wagner, Appl. Catal., B, 2005, 56, 9–35 CrossRef CAS.
- H. A. Gasteiger and N. M. Markovic, Science, 2009, 324, 48–49 CrossRef CAS PubMed.
- F. J. Vidal-Iglesias, R. M. Arán-Ais, J. Solla-Gullón, E. Herrero and J. M. Feliu, ACS Catal., 2012, 2, 901–910 CrossRef CAS.
- J. Solla-Gullón, P. Rodríguez, E. Herrero, A. Aldaz and J. M. Feliu, Phys. Chem. Chem. Phys., 2008, 10, 1359–1373 RSC.
- R. Devivaraprasad, R. Ramesh, N. Naresh, T. Kar, R. K. Singh and M. Neergat, Langmuir, 2014, 30, 8995–9006 CrossRef CAS PubMed.
- R. Rahul, R. K. Singh and M. Neergat, J. Electroanal. Chem., 2014, 712, 223–229 CrossRef CAS.
- A. Cuesta, A. Couto, A. Rincón, M. C. Pérez, A. López-Cudero and C. Gutiérrez, J. Electroanal. Chem., 2006, 586, 184–195 CrossRef CAS.
- D. Malko, A. Kucernak and T. Lopes, Nat. Commun., 2016, 7, 13285–13292 CrossRef CAS PubMed.
- S. Gupta, C. Fierro and E. Yeager, J. Electroanal. Chem., 1991, 306, 239–250 CrossRef CAS.
- F. Jaouen and J. P. Dodelet, Electrochim. Acta, 2007, 52, 5975–5984 CrossRef CAS.
- U. I. Kramm, J. Herranz, N. Larouche, T. M. Arruda, M. Lefèvre, F. Jaouen, P. Bogdanof, S. Fiechter, I. A. Wurmbach, S. Mukerjee and J. P. Dodelet, Phys. Chem. Chem. Phys., 2012, 14, 11673–11688 RSC.
- A. Zitolo, V. Goellner, V. Armel, M. T. Sougrati, T. Mineva, L. Stievano, E. Fonda and F. Jaouen, Nat. Mater., 2015, 14, 937–942 CrossRef CAS PubMed.
- J. L. Kneebone, S. L. Daifuku, J. A. Kehl, G. Wu, H. T. Chung, M. Y. Hu, E. E. Alp, K. L. More, P. Zelenay, E. F. Holby and M. L. Neidig, J. Phys. Chem. C, 2017, 121, 16283–16290 CrossRef CAS.
- N. R. Sahraie, U. I. Kramm, J. Steinberg, Y. Zhang, A. Thomas, T. Reier, J. P. Paraknowitsch and P. Strasser, Nat. Commun., 2015, 6, 8618–8627 CrossRef CAS PubMed.
- A. Chakraborty, R. Devivaraprasad, B. Bera and M. Neergat, Phys. Chem. Chem. Phys., 2017, 19, 25414–25422 RSC.
- A. Kanazawa, T. Daisaku, T. Okajima, S. Uchiyama, S. Kawauchi and T. Ohsaka, Langmuir, 2014, 30, 5297–5305 CrossRef CAS PubMed.
- G. G. Wildgoose, A. T. Masheter, A. Crossley, J. H. Jones and R. G. Compton, Int. J. Electrochem. Sci., 2007, 2, 809–819 CAS.
- M. D. Ryan, A. Yueh and W. Y. Chen, J. Electrochem. Soc., 1980, 127, 1489–1495 CrossRef CAS.
- C. R. Dawson and W. B. Tarpley, Ann. N. Y. Acad. Sci., 1963, 100, 937–950 CrossRef CAS.
- B. Bera, T. Kar, A. Chakraborty and M. Neergat, J. Electroanal. Chem., 2017, 805, 184–192 CrossRef CAS.
- B. Bera, A. Chakraborty, T. Kar, P. Leuaa and M. Neergat, J. Phys. Chem. C, 2017, 121, 20850–20856 CrossRef CAS.
- M. Carmo, M. Linardi and J. G. R. Poco, Appl. Catal., A, 2009, 355, 132–138 CrossRef CAS.
- J. Li, L. Ma, X. Li, C. Lu and H. Liu, Ind. Eng. Chem. Res., 2005, 44, 5478–5482 CrossRef CAS.
- T. Kar, R. Devivaraprasad, B. Bera, R. Ramesh and M. Neergat, Electrochim. Acta, 2016, 191, 81–89 CrossRef CAS.
- M. Quan, D. Sanchez, M. F. Wasylkiw and D. K. Smith, J. Am. Chem. Soc., 2007, 129, 12847–12856 CrossRef CAS.
- D. Guo, R. Shibuya, C. Akiba, S. Saji, T. Kondo and J. Nakamura, Science, 2016, 351, 361–365 CrossRef CAS.
- J. Friedl, C. M. Bauer, A. Rinaldi and U. Stimming, Carbon, 2013, 63, 228–239 CrossRef CAS.
- J. Friedl and U. Stimming, Electrochim. Acta, 2017, 227, 235–245 CrossRef CAS.
- R. Kötz and M. Carlen, Electrochim. Acta, 2000, 45, 2483–2498 CrossRef.
- C. Cougnon, E. Lebègue and G. Pognon, J. Power Sources, 2015, 274, 551–559 CrossRef CAS.
- P. L. Taberna, P. Simon and J. F. Fauvarque, J. Electrochem. Soc., 2003, 150, A292–A300 CrossRef CAS.
- F. Jaouen, J. Herranz, M. Lefèvre, J. P. Dodelet, U. I. Kramm, I. Herrmann, P. Bogdanoff, J. Maruyama, T. Nagaoka, A. Garsuch, J. R. Dahn, T. Olson, S. Pylypenko, P. Atanassov and E. A. Ustinov, ACS Appl. Mater. Interfaces, 2009, 1, 1623–1639 CrossRef CAS.
Footnote |
| † Electronic supplementary information (ESI) available. See DOI: 10.1039/c8ra08906j |
| This journal is © The Royal Society of Chemistry 2019 |

