 Open Access Article
Luminescence properties in relation to controllable morphologies of Ba3[Ge2B7O16(OH)2](OH)(H2O):Eu3+ and its thermal conversion product Ba3Ge2B6O16:Eu3+†
Pan Liang
Department of Chemistry & Chemical Engineering, Shaanxi Xueqian Normal University, Xi'an 710100, P. R. China. E-mail: B14159@snnu.edu.cn
First published on 8th January 2019
Abstract
Three types of morphologies of Eu3+-doped Ba3[Ge2B7O16(OH)2](OH)(H2O) phosphors were obtained via hydrothermal reactions by different kinds of raw materials. In addition, Ba3Ge2B6O16:Eu3+ phosphors were obtained by calcining the precursor Ba3[Ge2B7O16(OH)2](OH)(H2O):Eu3+. The structure and morphology of the obtained samples were characterized by XRD, EDS, FT-IR, TG-DTA, SEM and HRTEM. Herein, the effects of the synthesis parameters, including the reaction temperature, boron sources and the rare earth doping dosage, on the photoluminescence (PL) properties of Ba3[Ge2B7O16(OH)2](OH)(H2O) were investigated in detail. The lifetime and absolute quantum yield (QY) of different morphologies of Ba3[Ge2B7O16(OH)2](OH)(H2O):Eu3+ were also measured. The PL properties of the Ba3Ge2B6O16:Eu3+ phosphor prepared by the precursor calcination method compared with those prepared by the high-temperature solid-state method are discussed.
Introduction
In the past, many borates were chosen as host lattices for phosphors because of their large band gap, high thermal stability, high luminescence efficiency and low cost.1–5 Borogermanates, as one kind of borates, have different chemical compositions and structures derived from the flexible coordination geometries for both B and Ge atoms. The use of borogermanates with alkali, alkaline-earth and transition metals has gained considerable interest due to their excellent Second Harmonic Generation (SHG) coefficients, high optical-damage thresholds, photocatalytic applications and excellent thermal stability.6–12 Moreover, borogermanates can be a promising luminescence host material. The luminescence properties of some rare earth borogermanates doped with different kinds of rare earth metals, such as LaBGeO5, EuGeBO5 and Ln2GeB2O2,have been studied.13–17The properties and applications of luminescent materials are strongly dependent on their chemical composition, crystal structure, size and morphology.18 For instance, Zhu et al. have investigated the effects of trace alkali metal ion (Li+, Na+, K+) doping on the morphology and photoluminescence properties, and they deemed that the morphology influences the luminescence properties by geometric effects. Scattering occurs more frequently because of the distinctive particle shapes and surface roughness, which results in less absorption and decreased luminous efficiency. After doping with the alkali metal, the particle surface becomes smooth and the particle size gets reduced, meanwhile decreasing the number of surface-related defects. It leads to weaker nonradiative transitions and longer decay time afterwards.19 Li et al. have developed a series of one-dimensional Zn2GeO4:Mn2+ phosphors with H2O/EG as a solvent; they thought that the smaller particle size generally presents larger surface area and more defects in the host matrix, which may result in a weaker luminescence. Therefore, the Zn2GeO4:Mn2+ nanobundles exhibit broader diameters and larger particle size, which induces lower surface area and leads to fewer defects and stronger luminescence.20 Wang et al. have synthesized various Tb3+-doped calcium borate micro/nanostructures, such as Ca4B10O19·7H2O micro/nanoflakes, Ca2B2O5·H2O micro/nanorods, hierarchical micro–nanostructures, monodispersed nanobelts and Ca3B2O6 polyhedron-type particles, via a facile hydrothermal method. The influence of the morphology and crystalline phase on the photoluminescence of Tb3+ ions in the borate micro-nanostructures was investigated. These results indicate that both the crystal lattice and the morphology have important influence on the emission of Tb3+.21 Zhu et al. have synthesized red phosphors of the Mn4+-doped dodec-fluoride Li3Na3Ga2F12:Mn4+ (LNGF:Mn) with various morphologies. The micro-morphologies of LNGF:Mn change from flake to cube and to polyhedron shapes with an increase in the HF concentration from 10 to 40 wt%. The luminescence intensity of LNGF:Mn increases linearly with the increase in the HF concentration, which might be jointly caused by the formation of higher concentrations of luminescence centers and the polyhedrons has better crystallinity.22 Hence, controlling the size and morphology of the phosphors precisely enables us to manipulate their properties as desired. In addition, the properties are usually dependent on the preparation methods and the reaction parameters. To date, many researchers have prepared rare earth ion-doped inorganic phosphors of different morphologies only by changing the raw reaction materials. For instance, Ding et al. have prepared Eu3+-doped InBO3 phosphors with four kinds of morphologies (microsphere, flat microsphere with a hole, octahedron and oblique hexahedron) via a facile flux method only by adjusting the kinds of reaction boron source materials;23 Yue et al. have prepared Ln3+ (Ln = Tb, Eu)-doped zinc phosphate with different morphologies (regular nanosheet, fractured nanosheet, irregular nanosheet, and self-assembly microflower) only by altering the phosphate sources;24 Zou et al. have synthesized YBO3:Eu3+ phosphors with different morphologies (flower-like and nano-scaled particles) by simply adjusting the B3+ sources.25
Ba3[Ge2B7O16(OH)2](OH)(H2O) and Ba3Ge2B6O16 are potential SHG materials.26 However, there are no reports on the use of these two barium borogermanates as matrix luminescence materials. In this paper, we first prepared Eu3+-doped Ba3[Ge2B7O16(OH)2](OH)(H2O):Eu3+ with rhombohedron-like morphology, thorn-ball-like morphology and hexagonal-flakes-like morphology by the hydrothermal method and we also prepared Ba3Ge2B6O16:Eu3+ phosphor by the precursor calcination method. The effects of the experimental parameters, including the rare earth doping dosage, boron sources, and reaction time, on the photoluminescence (PL) properties of Ba3[Ge2B7O16(OH)2](OH)(H2O) were investigated in detail. In addition, the PL properties of Ba3Ge2B6O16:Eu3+ prepared by two methods are compared and discussed.
Experimental
Synthesis of samples
In a typical procedure, the raw materials BaCO3 (0.7425 mmol, 0.1465 g), Eu2O3 (0.0038 mmol, 0.0013 g), GeO2 (0.5 mmol, 0.052 g), H3BO3 (1.75 mmol, 0.108 g) and H2O (2.0 mL) were sealed in an autoclave with a Teflon lining. The autoclave was then placed in an oven and maintained at 200 °C for 4 days. After cooling to room temperature, the products were obtained by filtering, washing with deionized water and ethanol for several times, and drying at 60 °C for 12 h.
For the synthesis of Ba3[Ge2B7O16(OH)2](OH)(H2O):Eu3+ phosphors of other morphologies, the procedures were the same as stated above except that the boron source of H3BO3 was replaced with an equal amount of NH4B5O8·4H2O (0.35 mmol, 0.0953 g) and Na2B4O7·10H2O (0.4375 mmol, 0.1669 g), respectively.
For comparison, the sample Ba3Ge2B6O16:Eu3+ was also synthesized by a conventional high-temperature solid-state reaction method at 900 °C for 5 h according to the literature.26
Characterization
The structures of the prepared samples were characterized by X-ray powder diffraction (XRD, Rigaku D/MAX-C, Cu Kα radiation at 40 kV and 30 mA), FT-IR spectroscopy (recorded over the 400 to 4000 cm−1 region using a Nicolet NEXUS 670 spectrometer with KBr pellets at room temperature), TG-DTA (TA-SDT Q600, in a N2 atmosphere at a heating rate of 10 K min−1), and energy-dispersive X-ray spectrometer (EDS, Hitachi, JEOL-6700F). The morphology and size of the product were investigated by scanning electron microscopy (SEM, Philips-FEI, Quanta 200). The inter-planar spacing of the crystal stripes of the sample was characterized by field transmittance electron microscopy (TEM) (Tecnai G2 F20, FEI). The photoluminescence (PL) spectra were recorded at room temperature using a molecular fluorescence spectrometer (FL-4600, Hitachi) equipped with a 150 W xenon lamp as an excitation source. The lifetime was recorded using an FLS920P Edinburgh Analytical Instrument apparatus equipped with a 450 W xenon lamp and a μF900H high-energy micro-second flash lamp as the excitation sources. The absolute photoluminescence quantum yield (QY) was measured by a Hamamatsu (C9920-02G) analytical instrument apparatus using an integrating sphere.Results and discussion
Structure identification of the samples
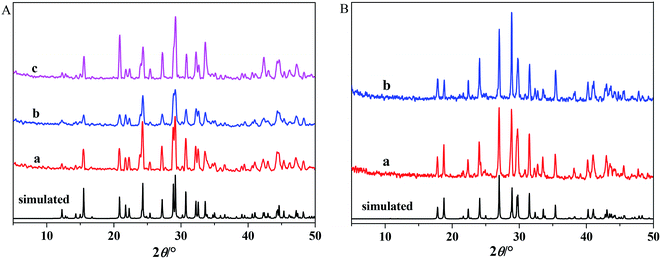
Fig. 1A shows the powder XRD pattern of the as-synthesized Ba3[Ge2B7O16(OH)2](OH)(H2O):Eu3+ with three kinds of boron sources (a) H3BO3, (b) NH4B5O8·4H2O and (c) Na2B4O7·10H2O, and Ba3[Ge2B7O16(OH)2](OH)(H2O) single-crystal structure simulated pattern. Fig. 1B shows the powder XRD pattern of Ba3Ge2B6O16:Eu3+ samples with two different methods: (a) calcination precursor method and (b) high temperature solid-state method, and Ba3Ge2B6O16 single-crystal structure simulated pattern. It can be observed that all the diffraction peaks in Fig. 1A and B are in good agreement with the monoclinic phase Ba3[Ge2B7O16(OH)2](OH)(H2O) and the triclinic phase Ba3Ge2B6O16, respectively. No impurity peaks were observed. A small amount of doped Eu3+ ions did not cause any significant change in the crystal structure of the host Ba3[Ge2B7O16(OH)2](OH)(H2O) and Ba3Ge2B6O16.Fig. S1a and b† show the EDS pattern of Ba3[Ge2B7O16(OH)2](OH)(H2O):Eu3+ and Ba3Ge2B6O16:Eu3+, respectively. The EDS patterns clearly indicate that the two obtained samples contain B, O, Ba, Ge and Eu elements, and there are no other impurity element peaks.
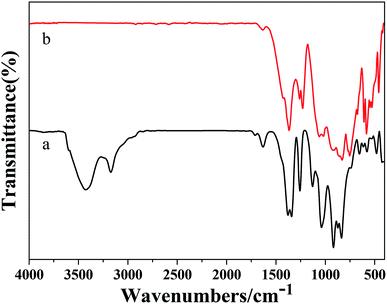
Fig. 2a and b show the FT-IR spectra of Ba3[Ge2B7O16(OH)2](OH)(H2O):Eu3+ and Ba3Ge2B6O16:Eu3+, respectively. In Fig. 2a, the bands at 3427 cm−1, 3167 cm−1 and 1629 cm−1 are attributed to the stretching and bending vibrations of O–H. The absorption peak at 1383 cm−1 can be assigned to the asymmetrical stretching of B(3)–O. The peak at 1260 cm−1 is attributed to the in-plane bending vibration of B–O–H. The peaks at 1130 cm−1 and 918 cm−1 are attributed to the symmetric stretching of B(4)–O. The peaks at 870 cm−1 and 836 cm−1 are attributed to the asymmetric stretching of Ge(4)–O. The peak at 487 cm−1 is attributed to the flexural vibration of Ge(4)–O. The peaks at 657 cm−1 and 576 cm−1 are attributed to the flexural vibration of B(3)–O and B(4)–O. In Fig. 2b, the absorption peaks at 1370 cm−1 and 1260 cm−1 can be assigned to the asymmetrical stretching of B(3)–O. The peaks at 1062 cm−1 and 924 cm−1 are attributed to the symmetric stretching of B(4)–O. The peaks at 871 cm−1, 832 cm−1 and 773 cm−1 are assigned to the asymmetric stretching of Ge(4)–O. The peak at 459 cm−1 is assigned to the flexural vibration of Ge(4)–O. The peaks at 610 cm−1 and 583 cm−1 are assigned to the flexural vibration of B(3)–O and B(4)–O. The corresponding absorption bands of Ba3[Ge2B7O16(OH)2](OH)(H2O):Eu3+ and Ba3Ge2B6O16:Eu3+ are similar to those reported in the literature, respectively.26 Therefore, we conclude that we obtained the Ba3[Ge2B7O16(OH)2](OH)(H2O):Eu3+ and Ba3Ge2B6O16:Eu3+ phosphors.
Fig. S2† shows the simultaneous TG-DTA curves of Ba3[Ge2B7O16(OH)2](OH)(H2O):Eu3+. TG studies indicate that there is no weight loss before 673 K, and it exhibits the initial step of weight loss in the range of 673–1073 K, which corresponds to the release of 2.5 water molecules per formula unit. The observed weight loss of 4.8% matches well with the theoretical calculation result (4.7%). This assignment is also in agreement with the endothermic peak at 883 K in the DTA diagram. This results indicated that Ba3[Ge2B7O16(OH)2](OH)(H2O):Eu3+ is thermally stable upto 673 K.
Fig. 3 shows the SEM images of the as-synthesized Ba3[Ge2B7O16(OH)2](OH)(H2O):Eu3+ samples with different boron sources as raw reaction materials. It is apparent that Ba3[Ge2B7O16(OH)2](OH)(H2O):Eu3+ synthesized with H3BO3 as the boron source displays rhombohedron-like morphology with an edge of about 2 μm (shown in Fig. 3a1 and a2). Ba3[Ge2B7O16(OH)2](OH)(H2O):Eu3+ synthesized with NH4B5O8·4H2O as the boron source displays uniformly sized thorn-ball-like morphology, which is constructed by lots of nano-particles, with diameters of about 10 μm (shown in Fig. 3b1 and b2). Ba3[Ge2B7O16(OH)2](OH)(H2O):Eu3+ synthesized with Na2B4O7·10H2O as the boron source displays hexagonal-flake morphology with an edge of about 1 μm and a thickness of about 100 nm (shown in Fig. 3c1 and c2). Different morphologies can be obtained by using different boron sources. When the different boron sources were introduced into the reaction system, the pH values and the existing cations were different; the acidity of H3BO3 is lower than those of NH4B5O8·4H2O and Na2B4O7·10H2O. The pH value can affect the kinds and qualities of the absorbed ions on the surface of the crystal.23 Thus, the surface energy of the crystal is different. According to the Gibbs–Curie–Wulff theorem, the growth rates on different surface facets are dominated by the surface energy.27 As a result, the different growth rates direct the different growth directions and further direct the different final morphology of the obtained samples.
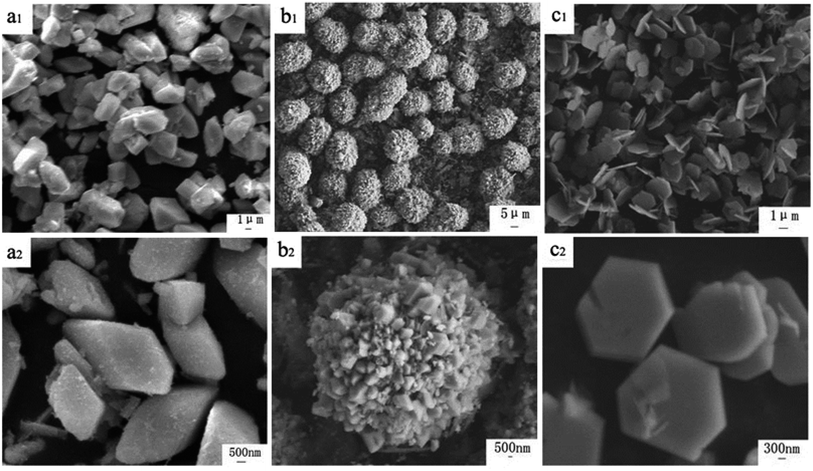 | ||
| Fig. 3 SEM images of Ba3[Ge2B7O16(OH)2](OH)(H2O):Eu3+ with different raw materials: (a1 and a2) H3BO3, (b1 and b2) NH4B5O8·4H2O and (c1 and c2) Na2B4O7·10H2O. | ||
HREM images of the three different morphologies of Ba3[Ge2B7O16(OH)2](OH)(H2O):Eu3+ samples are displayed in Fig. 4. The inter-planar spacing of the rhombohedron-like morphology sample is 4.258 Å, which is consistent with the d value (4.258 Å) of (020) faces in the Ba3[Ge2B7O16(OH)2](OH)(H2O) crystal. The inter-planar spacing of the thorn-ball-like morphology sample is 3.268 Å, which is very close to the d value (3.274 Å) of (221) faces in Ba3[Ge2B7O16(OH)2](OH)(H2O) crystal. The inter-planar spacing of the hexagonal-flake morphology sample is 2.840 Å, which is close to the d value (2.855 Å) of (222) faces in the Ba3[Ge2B7O16(OH)2](OH)(H2O) crystal.
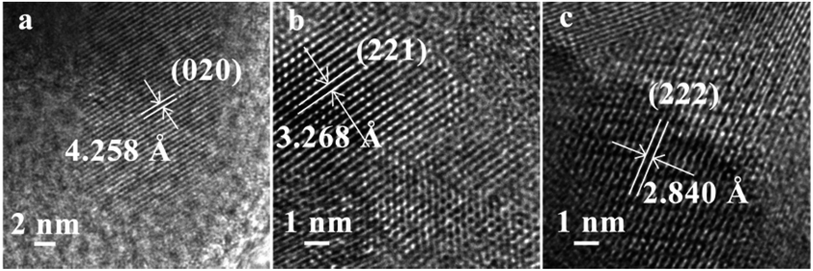 | ||
| Fig. 4 High-resolution TEM images of Ba3[Ge2B7O16(OH)2](OH)(H2O):Eu3+ with different morphologies: (a) rhombohedron-like morphology, (b) thorn-ball-like morphology and (c) hexagonal-flake morphology. | ||
Fig. S3† shows the SEM images of Ba3Ge2B6O16:Eu3+ prepared by different reaction methods: (a) precursor method; and (b) solid-state method. It can be seen that the Ba3Ge2B6O16:Eu3+ sample prepared by the precursor method exhibits porous surface block structure. In addition, the Ba3Ge2B6O16:Eu3+ sample prepared by the solid-state method exhibits irregular block structure.
Photoluminescence properties
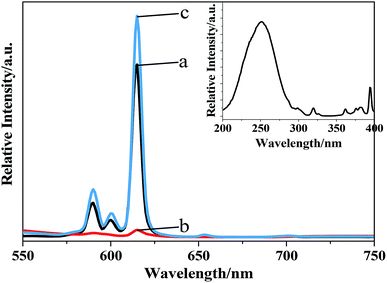 | ||
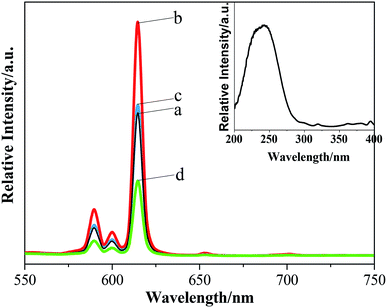
| Fig. 7 The emission spectra (λex = 242 nm) of Ba3[Ge2B7O16(OH)2](OH)(H2O):Eu3+ with different morphologies: (a) rhombohedron-like; (b) thorn-ball-like; and (c) hexagonal-flake. | ||
The photoluminescence decay curves of the samples with different morphologies Ba3[Ge2B7O16(OH)2](OH)(H2O):Eu3+ (λex = 242 nm, λem = 616 nm) were investigated, as shown in Fig. 8. The decay curve in Fig. 8 for Ba3[Ge2B7O16(OH)2](OH)(H2O):Eu3+ can be fitted by double-exponential function as follows:
I = A1![[thin space (1/6-em)]](https://www.rsc.org/images/entities/char_2009.gif) exp(−t/τ1) + A2 exp(−t/τ1) + A2![[thin space (1/6-em)]](https://www.rsc.org/images/entities/char_2009.gif) exp(−t/τ2) exp(−t/τ2)
| (1) |
 | (2) |
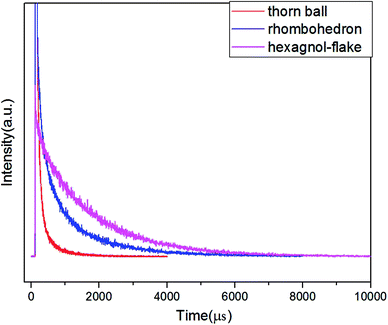 | ||
| Fig. 8 The decay time curves of the investigated Ba3[Ge2B7O16(OH)2](OH)(H2O):Eu3+ with different morphologies. | ||
The values of the lifetime are determined to be 1.04 ms, 0.15 ms, and 1.67 ms for rhombohedron-like morphology, thorn-ball-like morphology and hexagonal-flake morphology Ba3[Ge2B7O16(OH)2](OH)(H2O):Eu3+ phosphor, respectively. The lifetime is in milliseconds due to the forbidden nature of f–f transitions in Eu3+ ions. In addition, the hexagonal-flake morphology Ba3[Ge2B7O16(OH)2](OH)(H2O):Eu3+ phosphor possesses the longest lifetime.
The quantum yield (QY) is defined as the ratio of the number of emitted photons to the number of absorbed photons. When comparing the QY values (λex = 394 nm) of the three morphologies of Ba3[Ge2B7O16(OH)2](OH)(H2O):Eu3+ phosphor with those of some other Eu-doped compounds reported by different authors (given in Table 1), we can see that the obtained absolute QY of the hexagonal-flake morphology Ba3[Ge2B7O16(OH)2](OH)(H2O):Eu3+ phosphor possesses the highest value (54.1%) than the rhombohedron-like morphology and thorn-ball-like morphology Ba3[Ge2B7O16(OH)2](OH)(H2O):Eu3+ phosphors. Moreover, the QY of the hexagonal-flake morphology Ba3[Ge2B7O16(OH)2](OH)(H2O):Eu3+ phosphor is equivalent to those of the Sr3Y2(BO3)4:Eu3+ powder and SrO–La2O3–Al2O3–B2O3–SiO2:Eu3+ glass. Moreover, the QY of the hexagonal-flake morphology of Ba3[Ge2B7O16(OH)2](OH)(H2O):Eu3+ is much higher than that of the well-known commercial Y2O3:Eu3+ phosphor. Therefore, it can be concluded that the hexahedral-flake morphology Ba3[Ge2B7O16(OH)2](OH)(H2O):Eu3+ phosphor may be used as a new red phosphor for WLED.
| Basic composition | QY (%) | References |
|---|---|---|
| Ba3[Ge2B7O16(OH)2](OH)(H2O):Eu3+ (rhombohedron-like morphology) | 50.6 | This work |
| Ba3[Ge2B7O16(OH)2](OH)(H2O):Eu3+ (thorn-ball-like morphology) | 13.3 | This work |
| Ba3[Ge2B7O16(OH)2](OH)(H2O):Eu3+ (hexagonal-flake morphology) | 54.1 | This work |
| CaB6O10:Eu3+ powder | 27 | 34 |
| Sr3Y2(BO3)4:Eu3+ powder | 55 | 35 |
| Li2B4O7:Eu3+, Ag+ glass | 26.1 | 36 |
| Li2B4O7:Eu3+ glass | 10.7 | 37 |
| SrO–La2O3–Al2O3–B2O3–SiO2:Eu3+ glass | 54–55 | 38 |
| K2Na3P3O10:Eu3+ powder | 14 | 39 |
| Zn6O(OH)(BO3)3:Eu3+ powder | 20.2 | 40 |
| Commercial Y2O3:Eu 3+ phosphor | 29.5 | 37 |
Conclusions
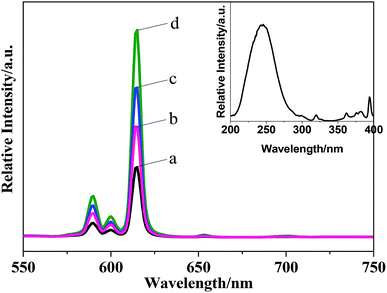
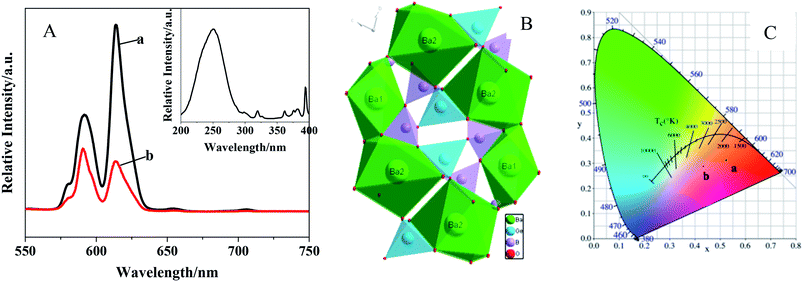
Three different morphologies of Ba3[Ge2B7O16(OH)2](OH)(H2O):Eu3+ have been obtained by a hydrothermal reaction by varying the type of boron sources, for the first time. The effects of the doping amount of Eu3+, synthetic raw materials and hydrothermal time on the luminescent properties were studied. The result indicated that the different reaction raw materials have a greater influence on the crystallinity and morphology of Ba3[Ge2B7O16(OH)2](OH)(H2O):Eu3+, and further influence the luminescence property. The lifetime of the Ba3[Ge2B7O16(OH)2](OH)(H2O):Eu3+ phosphor with hexagonal-flake morphology is 1.67 ms. The absolute QY of the obtained Ba3[Ge2B7O16(OH)2](OH)(H2O):Eu3+ with hexagonal-flakes-like morphology is 54.1, which is much higher than that of the commercial Y2O3:Eu phosphor. When the Ba3[Ge2B7O16(OH)2](OH)(H2O):Eu3+ precursor was calcined at high temperatures, we can get Ba3Ge2B6O16:Eu3+ phosphor. By comparing the luminescence properties of Ba3Ge2B6O16:Eu3+ obtained by the precursor calcination method and that obtained by the high-temperature solid-state reaction, it was found that the strongest emission peak for Ba3Ge2B6O16:Eu3+ obtained by the precursor calcination method appeared at 614 nm, which exhibits red emission (0.524, 0.312), meanwhile the strongest emission peak for Ba3Ge2B6O16:Eu3+ obtained by the high-temperature solid-state reaction was located at 591 nm, which exhibits orange emission (0.434, 0.288).Conflicts of interest
There are no conflicts to declare.Acknowledgements
This work was supported by the Talent Introduction Research Project of Shaanxi Xueqian Normal University (2017DS02), the Science Foundation of Shaanxi Xueqian Normal University (2018ZDKJ08), and the Shaanxi Provincial Department of Education Scientific Research Project (18JK0191).Notes and references
- L. Wu, Y. Bai, L. Wu, H. Yi, Y. Kong, Y. Zhang and J. Xu, RSC Adv., 2017, 7, 1146 RSC.
- H. Yu, D. G. Deng, Y. J. Hua, C. X. Li and S. Q. Xu, RSC Adv., 2016, 6, 82824 RSC.
- M. Hermus, P. C. Phan and J. Brgoch, Chem. Mater., 2016, 28, 1121 CrossRef CAS.
- H. Lin, G. Zhang, P. A. Tanner and H. Liang, J. Phys. Chem. C, 2013, 117, 12769 CrossRef CAS.
- P. Liang, M. Wang and Z. H. Liu, J. Rare Earths, 2017, 35, 441 CrossRef CAS.
- Y. C. Hao, C. L. Hu, X. Xu, F. Kong and J. G. Mao, Inorg. Chem., 2013, 52, 13644 CrossRef CAS PubMed.
- J. H. Zhang, F. Kong, X. Xu and J. G. Mao, J. Solid State Chem., 2012, 195, 63 CrossRef CAS.
- B. Petermüller, L. L. Petschnig, K. Wurst, G. Heymann and H. Huppertz, Inorg. Chem., 2014, 53, 9722 CrossRef PubMed.
- S. J. Yu, X. Y. Gu, T. T. Deng, J. H. Huang, J. W. Cheng and G. Y. Yang, Inorg. Chem., 2017, 56, 12695 CrossRef CAS PubMed.
- R. Pan, J. W. Cheng, B. F. Yang and G. Y. Yang, Inorg. Chem., 2017, 56, 2371 CrossRef CAS PubMed.
- M. Wen, Z. Lian, H. Wu, X. Su, Q. Yan, J. Lu, Z. Yang and S. Pan, RSC Adv., 2015, 5, 53448 RSC.
- H. Xie, M. Yue, B. Ma, D. Yang, L. Li, R. Cong, W. Gao and T. Yang, Catal. Commun., 2016, 84, 112 CrossRef CAS.
- A. Rulmont and P. Tarte, J. Solid State Chem., 1988, 75, 244 CrossRef CAS.
- S. Zhang, G. Wu, C. Duan and J. Wang, J. Rare Earths, 2011, 29, 737 CrossRef CAS.
- Y. Chi, Y. Zhuang and S. P. Guo, Z. Naturforsch., B: J. Chem. Sci., 2017, 72, 95 CAS.
- B. Knorr, K. Veenhuizen, A. Stone, H. Jain and V. Dierolf, Opt. Mater. Express, 2017, 7, 4095 CrossRef CAS.
- J. H. Zhang, P. X. Li and J. G. Mao, Dalton Trans., 2010, 39, 5301 RSC.
- P. Liang, Z. L. G. L. Tuoheti and Z. H. Liu, RSC Adv., 2017, 7, 3695 RSC.
- Y. Zhu, Y. Liu, M. G. Brik, L. Huang, T. Xuan and J. Wang, Opt. Mater., 2017, 74, 52 CrossRef CAS.
- Y. Li, A. Zhao, C. Chen, C. Zhang, J. Zhang and G. Jia, Dyes Pigm., 2018, 150, 267 CrossRef CAS.
- P. Wang, M. Fang, M. Liu, M. Kong, W. Xu and L. Zhang, CrystEngComm, 2017, 19, 5973 RSC.
- M. Zhu, Y. Pan, Y. Huang, H. Lian and J. Lin, J. Mater. Chem. C, 2018, 6, 491 RSC.
- W. Ding, P. Liang and Z. H. Liu, Mater. Res. Bull., 2017, 94, 31 CrossRef CAS.
- D. Yue, W. Lu, C. Li, X. Zhang, C. Liu and Z. Wang, Nanoscale, 2014, 6, 2137 RSC.
- D. Zou, Y. Q. Ma, S. B. Qian, G. H. Zheng, Z. X. Dai, G. Li and M. Z. Wu, J. Alloys Compd., 2013, 574, 142 CrossRef CAS.
- J. H. Zhang, F. Kong and J. G. Mao, Inorg. Chem., 2011, 50, 3037 CrossRef CAS PubMed.
- X. Shi, L. Yuan, X. Sun, C. Chang and J. Sun, J. Phys. Chem. C, 12008, 12, 3558 Search PubMed.
- P. Liang, J. W. Liu and Z. H. Liu, RSC Adv., 2016, 6, 89113 RSC.
- M. Chang, Y. Song, J. Chen, L. Cui, Z. Shi, Y. Sheng and H. Zou, ACS Sustainable Chem. Eng., 2018, 6, 223 CrossRef CAS.
- P. R. Mohan, S. Gopi, V. Vidyadharan, A. George, C. Joseph, N. V. Unnikrishnan and P. R. Biju, J. Lumin., 2017, 187, 113 CrossRef.
- P. Liang and Z. H. Liu, CrystEngComm, 2016, 18, 1311 RSC.
- S. W. Cao, Y. Jiao, W. F. Han, C. H. Ge, B. Song, J. Wang and X. D. Zhang, Spectrochim. Acta, Part A, 2018, 190, 231 CrossRef CAS PubMed.
- A. Huang, Z. Yang, C. Yu, Z. Chai, J. Qiu and Z. Song, J. Phys. Chem. C, 2017, 121, 5267 CrossRef CAS.
- K. Lemański, M. Stefański, D. Stefańska and P. J. Dereń, J. Lumin., 2015, 159, 219 CrossRef.
- A. A. Shyichuk and S. Lis, J. Rare Earths, 2011, 29, 1161 CrossRef CAS.
- I. I. Kindrat, B. V. Padlyak, B. Kukliński, A. Drzewiecki and V. T. Adamiv, J. Lumin., 2018, 204, 122 CrossRef CAS.
- I. I. Kindrat and B. V. Padlyak, Opt. Mater., 2018, 77, 93 CrossRef CAS.
- G. Gao and L. Wondraczek, J. Mater. Chem. C, 2014, 2, 691 RSC.
- M. Moutataouia, D. Zambon, D. Boyer, M. Lamire, L. El Ammari and R. Mahiou, J. Alloys Compd., 2018, 748, 206 CrossRef CAS.
- P. Liang, L. J. Qiao and Z. H. Liu, Adv. Powder Technol., 2017, 28, 2613 CrossRef CAS.
Footnote |
| † Electronic supplementary information (ESI) available. See DOI: 10.1039/c8ra08636b |
| This journal is © The Royal Society of Chemistry 2019 |

