A stable zinc–organic framework with luminescence detection of acetylacetone in aqueous solution†
Xiao-Min
Kang
a,
Xi-Yu
Fan
a,
Peng-Yuan
Hao
a,
Wen-Min
Wang
b and
Bin
Zhao
 *a
*a
aCollege of Chemistry and Key Laboratory of Advanced Energy Material Chemistry, Nankai University, Tianjin 300071, China. E-mail: zhaobin@nankai.edu.cn
bDepartment of Chemistry, Tianjin University, Tianjin 300072, China
First published on 29th November 2018
Abstract
A novel Zn–MOF {[Zn2(XN)2(IPA)2]·2H2O}n (1) (XN = 4′-(4-pyridine)4,2′:2′,4′′-terpyridine, IPA = isophthalic acid) was obtained and structurally characterized, and it exhibited high thermostability and chemical stability in various acid/base solutions (pH = 1–14) and common organic solvents. 1 can serve as the first recyclable luminescent sensor for selectively and sensitively recognizing acetylacetone with a detection limit of 0.25 ppm in aqueous solution. Importantly, 1 can be reused at least five times without a significant decrease in the luminescence intensity. Similarly, the Zn–MOF can also detect acetylacetone gas or that in organic solvents.
Introduction
As one of the important chemical substances, acetylacetone (Hacac) plays outstanding roles in many industrial applications, including as a precursor and an intermediate for organic synthesis,1 as a solvent for non-aqueous redox-flow-batteries,2 as a seeded free electron laser in photochemical processes,3 as a modifier or a chelating agent in the sol–gel process4 and as an absorber for removing formaldehyde selectively.5 Nevertheless, as a toxic chemical, acetylacetone causes severe damage to human health when ingested or inhaled, accompanied by signs of troubled breathing, dizziness, confusion or vomiting. Moreover, acetylacetone is combustible and explosive in air because of its volatility. The U.S. Environmental Protection Agency (EPA) refers to the effluent limitations and standards for acetylacetone.6 Hence, there is an urgent need to develop an effective analytical technique for the determination of acetylacetone to protect human health and the environment from its threat. Up to now, several methods such as high performance liquid chromatography,7 nuclear magnetic resonance spectroscopy,8 mass spectrometry, and infrared and ultraviolet (UV) spectroscopy9,10 have been available for probing acetylacetone. Recently, metal–organic frameworks (MOFs) as luminescent sensors to recognize acetylacetone have also been explored.11Actually, MOF-based luminescent sensors12 have been a sought-after goal due to their many advantages such as simple transduction, short response time, high sensitivity and selectivity, good portability and low cost. Luminescent sensors respond rapidly through optical absorbance (color) and intensity, along with the increase, decrease or quenching of luminescence emission. To date, extensive efforts have been made to detect cations (like Zn2+, Mg2+, Ca2+, Fe3+, Cd2+ and Cu2+),13 anions (such as I−, CrO42−, Cr2O72− and PO43−)14 and organic molecules (including CCl4, formaldehyde, CH3CN, acetone, alkylamines and phenols),15 as well as temperature, pH,16 and so on. To our knowledge, although three MOF-based luminescent sensors have been investigated to detect acetylacetone,11 this type of sensor with regenerability has never been reported hitherto.
In this contribution, a 3D multifunctional zinc–organic framework {[Zn2(XN)2(IPA)2]·2H2O}n (1) (XN = 4′-(4-pyridine)4,2′:2′,4′′-terpyridine, IPA = isophthalic acid) based on Zn2 clusters as nodes has been assembled by the solvothermal method and structurally characterized. The robust framework presents high chemical stability and thermal stability. Luminescence investigation demonstrates that 1 can serve as a sensor to selectively and sensitively detect acetylacetone with a detection limit of 0.25 ppm in aqueous solution. Importantly, 1 has no significant change in luminescence intensity after five recycling processes, featuring good cycling performance. Moreover, this Zn–MOF can sensitively recognize the Hacac gas and that in organic solvents.
Experimental section
Materials and methods
All the chemical reagents used in this work were purchased from commercial sources and used without further purification. The Fourier transform infrared (FT-IR) spectra were recorded on a Bruker Tensor 27 spectrophotometer as KBr pellets in the range of 400–4000 cm−1 (Fig. S1†). Powder X-ray diffraction experiments were carried out with a Rigaku D/Max-2500 diffractometer using Cu Kα radiation (λ = 1.54056 Å) in the 2θ region from 3° to 60°. Thermogravimetric analyses (TGA) were performed by using a Netzsch TG 209 TG-DTA analyzer from room temperature to 700 °C under a nitrogen atmosphere. Elemental analyses (EA) for C, H, and N were performed by using a PerkinElmer elemental analyzer. The UV-Vis spectra were recorded by using a JASCOV-570 UV-Vis spectrophotometer at room temperature. The photoluminescence spectra in the visible region were recorded at room temperature on a Cary Eclipse fluorescence spectrophotometer.Synthesis of {[Zn2(XN)2(IPA)2]·2H2O}n (1)
By a solvothermal method, a mixture of Zn(NO3)2·6H2O (0.0149 g, 0.05 mmol), IPA (0.0083 g, 0.05 mmol), XN (0.0062 g, 0.02 mmol), 8 mL H2O, and 2 mL DMF were sealed in a 25 mL Teflon-lined stainless-steel reaction vessel and heated in an air oven at 130 °C for three days. Then the vessel was slowly cooled to room temperature at a rate of 1.4 °C h−1. Colorless block crystals of compound 1 were collected (80% yield based on Zn(NO3)2·6H2O). Elemental analysis (%) calcd for C56H40N8O10Zn2: C, 60.23; N, 10.04; H, 3.59. Found: C, 60.07; N, 10.11; H, 3.81.Crystal structure determination
A suitable crystal of 1 was picked for single-crystal X-ray diffraction analysis in a cooled N2 gas stream at about 121 K. The crystallographic data were collected on an Oxford diffractometer SuperNova TM equipped with graphite-monochromatic Mo Kα radiation (λ = 0.71073 Å) using the ω–φ scan technique and corrected for Lorentz-polarization effects. The structure of compound 1 was solved by direct methods and refined by full-matrix least-squares on F2 with the SHELXS-97 and SHELXL-97 programs.17,18 All the H atoms were placed geometrically and refined using a riding model while the non-hydrogen atoms were refined with anisotropic parameters. The diffraction contribution of some disordered solvent molecules in compound 1 was removed by using PLATON/SQUEEZE,19 and these free water molecules could be determined by TGA and elemental analyses. Detailed crystal data and structure refinement for compound 1 are summarized in Table 1. Selected bond distances and angles are given in Table S1 (ESI†). The CCDC number is 1842585,† and the file contains the supplementary crystallographic data for this paper.| Compound | 1 |
| Empirical formula | C112H80N16O20Zn4 |
| M r | 2231.35 |
| T (K) | 120.8(2) |
| Crystal system | Monoclinic |
| Space group | C2/c |
| a/Å | 15.4791(7) |
| b/Å | 12.9401(7) |
| c/Å | 24.5733(14) |
| α/° | 90 |
| β/° | 97.226(5) |
| γ/° | 90 |
| V/Å3 | 4883.0(4) |
| Z | 2 |
| ρ calc/mg mm−3 | 1.481 |
| μ/mm−1 | 1.050 |
| F(000) | 2288.0 |
| 2θ range for data collection/° | 5.904 to 50.02 |
| Reflections collected | 9965 |
| Goodness-of-fit on F2 | 1.084 |
| Final R indexes [I > = 2σ(I)] | R 1 = 0.0636 |
| wR2 = 0.1251 | |
| Final R indexes [all data] | R 1 = 0.1057 |
| wR2 = 0.1439 | |
| Δρmax/min/e Å−3 | 1.084/−0.417 |
Results and discussion
Description of the crystal structure
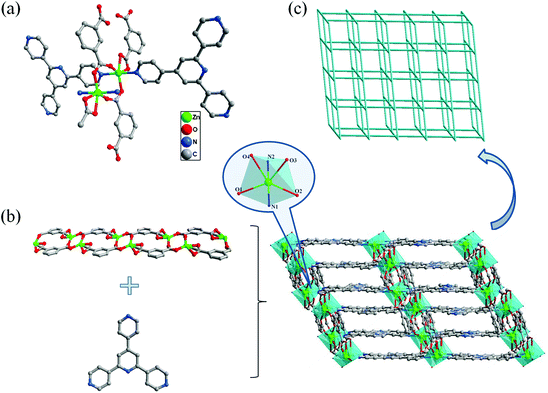
Single crystal X-ray diffraction analysis demonstrates that 1 crystallizes in the monoclinic system with the space group C2/c (see Table 1). As presented in Fig. 1a, the asymmetric unit of 1 contains two crystallographically independent Zn2+ ions, two independent XN ligands and two independent IPA ligands. Each six-coordinated Zn2+ is completed by two N atoms from two XN ligands and four oxygen atoms from three IPA ligands, displaying a distorted octahedral coordination geometry. The Zn–O distances and Zn–N distances are in the range of 2.042(3)–2.344(4) Å and 2.125(4)–2.157(4) Å, respectively (see Table S1†), which agree well with those reported previously.20In compound 1, two adjacent Zn2+ ions are linked by two carboxylate ions to form a [Zn2(COO)2]2+ subunit. Meanwhile, the [Zn2(COO)2]2+ units are connected by IPA ligands, generating a 1D chain structure. Moreover, the XN ligands distribute almost parallelly between two 1D chains and the 1D chains are pillared by the XN ligands, which leads to the generation of a 3D pillar–chain framework, as shown in Fig. 1b. It is worth noting that 1 exhibits an array through the π–π stacking interactions (the distances of Cg–Cg between ring centroids are in the range of 3.626(3) to 3.826(9) Å, and the dihedral angles are between 0 and 2.811°). The large conjugated π electron system can not only emit strong luminescence but also play a key role in the stabilization of the framework.21
To gain further insight into the structure of 1, the network is simplified from the topological point of view. Topology analysis demonstrates that each [Zn2(COO)2]2+ unit can be regarded as a 4-connected node that bridges two XN and two IPA ligands, while each XN or IPA ligand is linked by two [Zn2(COO)2]2+ units to form a 2-connected node. As a consequence, the 3D pillar–chain network of 1 can be rationalized as a 4-connected uninodal net with cds topology, and the Schläfli symbol is {65;8} (Fig. 1c).
PXRD and TGA analysis
Powder X-ray diffraction (PXRD) measurements were carried out for sample 1 and the experimental patterns are in accord with the simulated ones derived from the single-crystal X-ray diffraction data, indicating the phase purity of 1 (Fig. S2†). Additionally, the PXRD patterns of sample 1 immersed in common organic solvents (CCl4, CH2Cl2, acetonitrile, cyclohexane, methanol, isopropanol, EtOH, DMF, butanol, ethylacetate, DMA, and acetylacetone (Hacac)) for 12 h are in good agreement with the simulated ones, confirming that the structure of 1 still remains intact (Fig. S3†). To further study the acid/base stability of 1, the samples treated with a variety of solutions with pH values ranging from 1 to 14 for 6 h were measured. The experimental XRD patterns are well consistent with the simulated peak positions, indicating the integrity of the 3D framework in 1 (Fig. S4†). The results mentioned above show that 1 possesses excellent solvent stability and acid/base stability.To explore the thermal stability of 1, the thermogravimetric analysis (TGA) data in the range of 30–700 °C under nitrogen were collected, as shown in Fig. S5.† The weight loss of 3.18% can be observed from 30 to 183 °C (calculated: 3.23%), corresponding to the removal of two free water molecules. Subsequently, the framework of 1 begins to decompose at about 410 °C, indicative of the high thermal stability of 1.
Luminescence properties
Metal–organic frameworks including d10 configurations of Zn2+ and conjugated rigid ligands are considered as promising candidates in the optical field.22 The solid-state photoluminescence spectra of compound 1 and organic ligands (XN and IPA) were recorded at room temperature. Upon excitation at 277 nm for 1, 254 nm for XN and 258 nm for IPA, the maximum luminescence emission peaks are observed at 388 nm, 373 nm and 368 nm, respectively (Fig. S6 and S7†). Comparing with the ligands XN and IPA, the maximum emission peak of 1 shows a red-shift, which may be ascribed to the perturbation of metal ions to ligand-centered emission.11a,23 Due to the d10 electron configuration of Zn2+, it can be neither oxidized nor reduced. Herein, the characteristic emission of 1 belongs to neither the metal–ligand electronic transition (MLCT) nor the ligand–metal electronic transition (LMCT), and is mainly assigned to the luminescence of the ligand. Next, the potential luminescence properties of 1 can be further investigated to recognize various organic solvents.The finely ground sample of 1 (60 mg) was dispersed in 60 mL H2O, forming a suspension solution (H2O-1) by an ultrasound method. Then, the luminescence studies were conducted and 200 μL of various organic solvents including CCl4, CH2Cl2, CH3CN, CYH, MeOH, i-PrOH, C2H5OH, phMe, n-BuOH, EAC, DMA, and Hacac were slowly added into 1.8 mL H2O-1, respectively. Under the perturbation of different solutions, the influence on the luminescence emission of 1 at 383 nm can be observed in Fig. 2. Interestingly, the luminescence intensity of 1 relies on the identities of diverse solvents: acetylacetone shows a noticeable quenching effect on the emission of 1, while other organic solvents have no evident effect on the luminescence of 1, indicating that 1 can serve as a promising probe for detecting acetylacetone in aqueous solution.
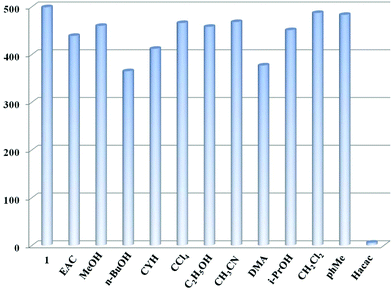 | ||
| Fig. 2 The luminescence emission of compound 1 in aqueous solution under the perturbation of different common organic solvents at 383 nm. | ||
In addition, to evaluate the effects of mixed solvents on the luminescence of 1, 200 μL of acetylacetone and 200 μL of other organic solvents were slowly dropped into 1.6 mL H2O-1, respectively. As presented in Fig. 3, the introduction of other solvents makes no difference to the quenching effect of acetylacetone, indicative of the good selectivity of 1 as an acetylacetone sensor among the mixed organic solvents mentioned above. With respect to other structurally and/or electronically similar organic molecules, such as benzaldehyde, acetophenone, acrylamide, crotonaldehyde, and 3-penten-2-one, we explored their effects on the luminescence of compound 1 and their selectivity for the detection of Hacac. As shown in Fig. S8 and S9,† the luminescence emission of 1 decreases obviously and is even quenched completely in comparison with the original one, and it is difficult to distinguish them selectively, interfering with the detection of Hacac. Actually, the selectivity of each luminescent probe is only available in a certain limited detection range, which is meaningful in practical applications.
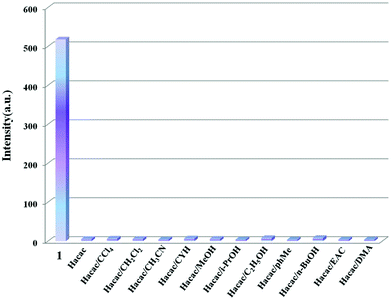 | ||
| Fig. 3 Comparison of the luminescence intensity of compound 1 in the presence of mixed organic solvents. | ||
Furthermore, in consideration of the drastic luminescence quenching effect of acetylacetone on 1, acetylacetone with different concentrations was added into H2O-1 to evaluate the detection limit of 1 for sensing acetylacetone as a luminescent probe. As shown in Fig. 4, the luminescence intensity of 1 decreased gradually with the addition of acetylacetone and the change in the luminescence intensity can be clearly observed when the concentration of acetylacetone reaches 0.25 ppm, suggesting that the detection limit is 0.25 ppm for 1 as a sensor to recognize acetylacetone. Then, the luminescence intensity of 1 displays a sharp decrease (52.14%) at the concentration of acetylacetone of only 5.9 ppm and the intensity declines 88% when the concentration reaches 16.6 ppm. Hence, 1 can be treated as a sensitive probe for the determination of acetylacetone in aqueous solution.
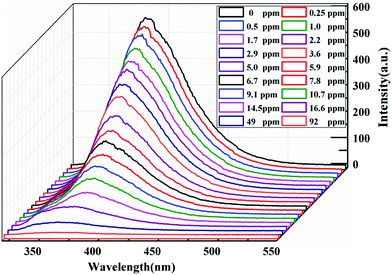 | ||
| Fig. 4 Changes in the luminescence spectrum of 1 with different concentrations of acetylacetone in aqueous solution at 383 nm. The excitation wavelength is 280 nm. | ||
Moreover, we measured the PL sensing of acetylacetone by simply employing the XN organic ligand or IPA ligand as a sensing probe to further demonstrate the efficiency and specificity of Zn–XN MOFs as a sensitive sensor (Fig. S10†). However, lower sensitivity for the XN ligand system and the IPA ligand system has been observed in comparison with that of compound 1, although they can probe acetylacetone with the detection limits of 25 ppm and 260 ppm, respectively. Additionally, compound 1 has many advantages over XN and IPA ligands as a luminescent probe for sensing acetylacetone, such as excellent solvent stability, good thermal stability and reusability.
To investigate the relationship between the quenching effect and acetylacetone concentration ([Hacac]), a plot of the luminescence intensity versus [Hacac] was established and it can be linearly fitted to I0/I = 0.7389 + Ksv[Hacac] (I0 and I represent the luminescence intensities of 1 before and after the addition of different concentrations of acetylacetone, respectively, and Ksv is the Stern Volmer constant), which is in close proximity to the Stern–Volmer equation: I0/I = 1 + Ksv[Hacac] (Fig. S11†). The average Ksv value is calculated to be 2.3 × 10³ L mol−1 by fitting analysis, indicative of the significant quenching efficiency of acetylacetone on the luminescence emission of 1.
Then, the luminescence properties of compound 1 for the detection of Hacac in DMF were investigated (1-DMF). The results reveal that the luminescence intensity of 1 displays a sharp decrease at the concentration of acetylacetone of only 0.5 ppm and the luminescence emission is quenched completely when the concentration reaches 2110 ppm (Fig. 5). A plot of the luminescence intensity versus [Hacac] can be linearly fitted to I0/I = 0.907 + Ksv[Hacac] (Fig. S12†). Hence, compound 1 can also recognize Hacac sensitively in an organic solvent (DMF) with a limit detection of 0.5 ppm. Due to the solvent effect, compound 1 exhibited a main emission with a maximum value at 388 nm in the organic solvent (DMF), which is slightly different from that in aqueous solution (383 nm). The investigation on the Zn–XN MOF as a gas phase sensor for the detection of Hacac was performed (Fig. S13†). The luminescence emission of compound 1 treated with the Hacac gas decreases by almost half in comparison with the original one, which indicates that 1 can also effectively detect the Hacac gas.
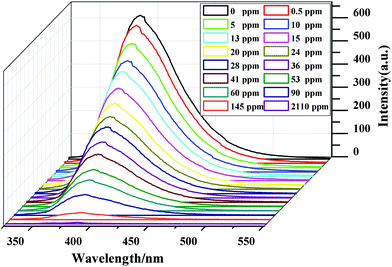 | ||
| Fig. 5 Changes in the luminescence spectrum of 1 in DMF with different concentrations of acetylacetone at 388 nm. The excitation wavelength is 277 nm. | ||
As far as we know, the recycling capacity of the luminescent probe plays an important role in wide practical applications. Therefore, it is necessary to explore a simple and fast method for reutilization. Then, the cycling performance of 1 was studied: we attempted to simply immerse sample 1 in 92 ppm acetylacetone for several minutes and wash it with C2H5OH several times. As presented in Fig. 6 and Fig. S14,† the luminescence intensity and PXRD patterns of recycled 1 agree well with the original results, demonstrating that the framework of 1 still remains stable. Hence, 1 can be reused at least five times as an acetylacetone sensor by a simple and fast means.
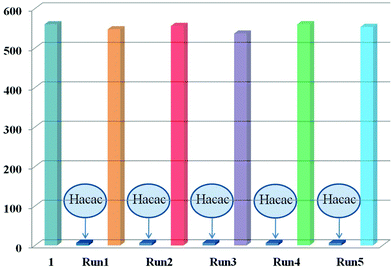 | ||
| Fig. 6 The luminescence intensity of compound 1 after five runs of recycling. The intensity is monitored at 383 nm under the excitation wavelength of 280 nm. | ||
Next, the discussions about the possible quenching mechanism are as follows: (1) the consistence of the PXRD patterns between 1 after luminescence investigation and the simulated one demonstrates that the 3D framework still remains intact and the luminescence quenching effect should not be ascribed to the collapse of the framework; (2) given the structural feature of 1, it is impossible to incorporate the guest molecules into the pores because of the lack of porosity. Hence, the sensing mechanism might differ from most cases of guest-induced quenching. In the luminescence investigation, the analyte solution (Hacac) could be well dispersed in the supernatant of H2O-1, which enables the adsorption of Hacac molecules on the surface of particles, facilitating possible host–guest interactions; (3) in previous studies, the photoluminescence of Zn-MOFs was mostly generated from the intraligand charge transfer (n–π* or π–π*);24 and (4) the apparent UV absorption of acetylacetone at a concentration of 0.01 ppm can be observed in the range from 217 to 320 nm. The overlap between the absorption spectrum of Hacac and the excitation spectrum of compound 1 indicates that Hacac and ligand molecules competitively adsorb the photon energy (Fig. S15†). As a result, the intense absorption by acetylacetone should be responsible for luminescence quenching, which reduces the luminescence efficiency and results in the quenching effect.
Conclusion
In summary, a novel Zn-MOF {[Zn2(XN)2(IPA)2]·2H2O}n has been assembled and structurally characterized, demonstrating high thermostability and chemical stability in different organic solvents and acid/base solutions with the pH ranging from 1 to 14. Interestingly, compound 1 as the first renewable acetylacetone sensor features high selectivity and sensitivity with a detection limit of 0.25 ppm in aqueous solution. Moreover, 1 can also recognize the Hacac gas, which provides a convenient platform for the real-time monitoring of Hacac. The results mentioned above could pave a way for 1 to be used as a luminescent probe in practical applications.Conflicts of interest
There are no conflicts to declare.Acknowledgements
This work was supported by the NSFC (21625103, 21571107, and 21421001), and the 111 Project (B12015).Notes and references
- (a) M. A. Hussien, N. Nawar, F. M. Radwan and N. M. Hosny, J. Mol. Struct., 2015, 1080, 162–168 CrossRef CAS; (b) K. Mohammadi and M. Rastegari, Spectrochim. Acta, Part A, 2012, 97, 711–716 CrossRef CAS PubMed; (c) J. Warneke, W. F. V. Dorp, P. Rudolf, M. Stano, P. Papp, S. Matejčík, T. Borrmann and P. Swiderek, Phys. Chem. Chem. Phys., 2015, 17, 1204–1216 RSC; (d) U. Böhme and S. Fels, Inorg. Chim. Acta, 2013, 406, 251–255 CrossRef; (e) T. Yoshihara, M. Hosaka, M. Terata, K. Ichikawa, S. Murayama, A. Tanaka, M. Mori, H. Itabashi, T. Takeuchi and S. Tobit, Anal. Chem., 2015, 87, 2710–2717 CrossRef CAS PubMed; (f) G. A. Flores, M. G. Hipolito, M. A. Fruti, S. C. Tellez, R. M. Martinez, M. P. C. Arias, E. Z. Alejandre and C. Falcony, Mater. Chem. Phys., 2015, 34, 149–150 Search PubMed.
- T. Herr, J. Noack, P. Fischer and J. Tübke, Electrochim. Acta, 2013, 113, 127–133 CrossRef CAS.
- R. J. Squibb, M. Sapunar, A. Ponzi, R. Richter, A. Kivimäki, O. Plekan, P. Finetti, N. Sisourat, V. Zhaunerchyk, T. Marchenko, L. Journel, R. Guillemin, R. Cucini, M. Coreno, C. Grazioli, M. Di Fraia, C. Callegari, K. C. Prince, P. Decleva, M. Simon, J. H. D. Eland, N. Došlić, R. Feifel and M. N. Piancastelli, Nat. Commun., 2018, 9, 63 CrossRef CAS PubMed.
- (a) C. F. Tseng and C. W. Lee, Jpn. J. Appl. Phys., 2014, 53, 11RG02 CrossRef; (b) Y. S. Ho, C. H. Wu, Y. S. Chen and C. K. Liu, Int. J. Appl. Ceram. Technol., 2015, 12, E53–E58 CrossRef CAS; (c) M. Yu, M. Liang, J. H. Liu, S. M. Li, B. Xue and H. Zhao, Appl. Surf. Sci., 2016, 363, 229–239 CrossRef CAS; (d) A. Potdevin, V. Briois, N. Caperaa, C. V. Santilli, G. Chadeyron and R. A. Mahiou, RSC Adv., 2016, 6, 41962–41971 RSC; (e) G. P. Pires, I. F. Costa, H. F. Brito, W. M. Faustinoa and E. E. S. Teotonio, Dalton Trans., 2016, 45, 10960–10968 RSC; (f) K. Usha, B. Mondal, D. Sengupta and P. Kumbhakar, Measurement, 2015, 61, 21–26 CrossRef.
- M. M. Doroodmand and M. G. Kharekani, Chem. Eng. J., 2016, 283, 453–461 CrossRef CAS.
- US Department of Health and Human Services, Toxicological Profile for Chromium, Public Health Service Agency for Toxic Substances and Diseases Registry, Washington, DC, 2005 Search PubMed.
- H. Y. Zeng, Z. K. Duan, H. Z. Chen, Z. D. Zeng and A. W. Luo, Chin. J. Anal. Chem., 2011, 3, 382–386 Search PubMed.
- L. L. Zhou, C. Li and X. C. Weng, Magn. Reson. Chem., 2016, 54, 222–226 CrossRef CAS PubMed.
- Z. Reyes and R. M. Silverstein, J. Am. Chem. Soc., 1958, 80, 6367–6372 CrossRef CAS.
- L. W. Reeves, E. A. Allan and K. O. Strømme, Can. J. Chem., 1960, 38, 1249–1254 CrossRef CAS.
- (a) X. M. Kang, R. R. Cheng, H. Xu, W. M. Wang and B. Zhao, Chem. – Eur. J., 2017, 23, 13289–13293 CrossRef CAS; (b) H. Yang, F. Wang, Y. X. Tan, Y. Kang, T. H. Li and J. Zhang, Chem. - Asian J., 2012, 7, 1069–1073 CrossRef CAS; (c) J. Y. Zou, L. Li, S. Y. You, K. H. Chen, X. N. Dong, Y. H. Chen and J. Z. Cui, Cryst. Growth Des., 2018, 18, 3997–4003 CrossRef CAS.
- (a) Y. Zhou and B. Yan, Chem. Commun., 2016, 52, 2265–2268 RSC; (b) S. S. Zhao, J. Yang, Y. Y. Liu and J. F. Ma, Inorg. Chem., 2016, 55, 2261–2273 CrossRef CAS PubMed; (c) X. G. Liu, H. Wang, B. Chen, Y. Zou, Z. G. Gu, Z. Zhao and L. Shen, Chem. Commun., 2015, 51, 1677–1680 RSC; (d) M. J. Dong, M. Zhao, S. Ou, C. Zou and C. D. Wu, Angew. Chem., Int. Ed., 2014, 53, 1575–1579 CrossRef CAS; (e) Y. Guo, X. Feng, T. Han, S. Wang, Z. Lin, Y. Dong and B. Wang, J. Am. Chem. Soc., 2014, 136, 15485–15488 CrossRef CAS PubMed; (f) H. Li, W. Shi, K. Zhao, Z. Niu, H. Li and P. Cheng, Chem. – Eur. J., 2013, 19, 3358–3365 CrossRef CAS PubMed; (g) J. H. Wang, M. Li and D. Li, Chem. Sci., 2013, 4, 1793–1801 RSC.
- (a) B. Zhao, X. Y. Chen, P. Cheng, D. Z. Liao, S. P. Yan and Z. H. Jiang, J. Am. Chem. Soc., 2004, 126, 15394–15395 CrossRef CAS PubMed; (b) H. Xu, H. C. Hu, C. S. Cao and B. Zhao, Inorg. Chem., 2015, 54, 4585–4587 CrossRef CAS PubMed; (c) J. N. Hao and B. Yan, Chem. Commun., 2015, 51, 7737–7740 RSC; (d) B. L. Chen, L. B. Wang, Y. Q. Xiao, F. R. Fronczek, M. Xue, Y. J. Cui and G. D. Qian, Angew. Chem., Int. Ed., 2009, 48, 500–503 CrossRef CAS PubMed; (e) J. N. Hao and B. Yan, J. Mater. Chem. A, 2015, 3, 4788–4792 RSC; (f) Z. M. Hao, G. C. Yang, X. Z. Song, M. Zhu, X. Meng, S. N. Zhao, S. Y. Song and H. J. Zhang, J. Mater. Chem. A, 2014, 2, 237–244 RSC.
- (a) P. F. Shi, H. C. Hu, Z. Y. Zhang, G. Xiong and B. Zhao, Chem. Commun., 2015, 51, 3985–3988 RSC; (b) X. Y. Guo, F. Zhao, J. J. Liu, Z. L. Liu and Y. Q. Wang, J. Mater. Chem. A, 2017, 5, 20035–20043 RSC; (c) H. Xu, C. S. Cao and B. Zhao, Chem. Commun., 2015, 51, 10280–10283 RSC; (d) J. M. Zhou, W. Shi, H. M. Li, H. Li and P. Cheng, J. Phys. Chem. C, 2014, 118, 416–426 CrossRef CAS; (e) H. Xu, Y. Q. Xiao, X. T. Rao, Z. S. Dou, W. F. Li, Y. J. Cui, Z. Y. Wang and G. D. Qian, J. Alloys Compd., 2011, 509, 2552–2554 CrossRef CAS.
- (a) F. Y. Yi, S. C. Wang, M. L. Gu, J. Q. Zheng and L. Han, J. Mater. Chem. C, 2018, 6, 2010–2018 RSC; (b) X. C. Sun, Y. Wang and Y. Lei, Chem. Soc. Rev., 2015, 44, 8019–8061 RSC; (c) J. M. Zhou, W. Shi, N. Xu and P. Cheng, Inorg. Chem., 2013, 52, 8082–8090 CrossRef CAS; (d) N. N. Yang, W. Sun, F. G. Xi, Q. Sui, L. J. Chen and E. Q. Gao, Chem. Commun., 2017, 53, 1747–1750 RSC; (e) T. Gong, P. Li, Q. Sui, J. Q. Chen, J. H. Xu and E. Q. Gao, J. Mater. Chem. A, 2018, 6, 9236–9244 RSC.
- (a) H. L. Jiang, D. Feng, K. C. Wang, Z. Y. Gu, Z. W. Wei, Y. P. Chen and H. C. Zhou, J. Am. Chem. Soc., 2013, 135, 13934–13938 CrossRef CAS; (b) P. L. Feng, K. Leong and M. D. Allendorf, Dalton Trans., 2012, 41, 8869–8877 RSC; (c) D. Li, X. G. Yang and D. P. Yan, ACS Appl. Mater. Interfaces, 2018, 10, 34377–34384 CrossRef CAS; (d) A. M. Kaczmarek, J. Mater. Chem. C, 2018, 6, 5916–5925 RSC; (e) T. Wehner, M. T. Seuffert, J. R. Sorg, M. Schneider, K. Mandel, G. Sextlbc and K. Müller-Buschbaum, J. Mater. Chem. C, 2017, 5, 10133–10142 RSC; (f) K. Xing, R. Q. Fan, F. Y. Wang, H. Nie, X. Du, S. Gai, P. Wang and Y. L. Yang, ACS Appl. Mater. Interfaces, 2018, 10, 22746–22756 CrossRef CAS; (g) T. F. Xia, F. L. Zhu, K. Jiang, Y. J. Cui, Y. Yang and G. D. Qian, Dalton Trans., 2017, 46, 7549–7555 RSC.
- G. M. Sheldrick, SHELXS-97, Program for the Solution of Crystal Structures, University of Göttingen, Göttingen, Germany, 1997 Search PubMed.
- G. M. Sheldrick, SHELXL-97, Program for the Refinement of Crystal Structures, University of Göttingen, Göttingen, Germany, 1997 Search PubMed.
- A. L. Spek, PLATON, A multipurpose crystallographic tool, Utrecht University, Utrecht, The Netherlands, 2001 Search PubMed.
- (a) Z. Q. Shi, Z. J. Guo and H. G. Zheng, Chem. Commun., 2015, 51, 8300–8303 RSC; (b) L. J. Liu, K. Konstas, M. R. Hill and S. G. Telfe, J. Am. Chem. Soc., 2013, 135, 17731–17734 CrossRef CAS PubMed; (c) A. Banerjee, S. Nandi, P. Nasa and R. Vaidhyanathan, Chem. Commun., 2016, 52, 1851–1854 RSC; (d) W. Bury, I. Justyniak, D. Prochowicz, Z. Wrobelb and J. Lewinski, Chem. Commun., 2012, 48, 7362–7364 RSC; (e) H. Ryu, Y. Mulyana, I. Park, J. Kim, L. F. Lindoy and S. S. Lee, CrystEngComm, 2015, 17, 5717–5724 RSC; (f) L. M. Yang, P. Vajeeston, P. Ravindran, H. Fjellvag and M. Tilset, Inorg. Chem., 2010, 49, 10283–10290 CrossRef CAS.
- (a) Y. Q. Chen, G. R. Li, Y. K. Qu, Y. H. Zhang, K. H. He, Q. Gao and X. H. Bu, Cryst. Growth Des., 2013, 13, 901–907 CrossRef CAS; (b) D. Tian, Y. Li, R. Y. Chen, Z. Chang, G. Y. Wang and X. H. Bu, J. Mater. Chem. A, 2014, 2, 1465–1470 RSC; (c) X. H. Zhou, L. Li, H. H. Li, A. Li, T. Yang and W. Huang, Dalton Trans., 2013, 42, 12403–12409 RSC; (d) X. H. Zhou, H. H. Li, H. P. Xiao, L. Li, Q. Zhao, T. Yang, J. L. Zuo and W. Huang, Dalton Trans., 2013, 42, 5718–5723 RSC; (e) Q. G. Meng, X. L. Xin, L. L. Zhang, F. N. Dai, R. M. Wang and D. F. Sun, J. Mater. Chem. A, 2015, 3, 24016–24021 RSC.
- (a) P. Cui, Z. Chen, D. L. Gao, B. Zhao, W. Shi and P. Cheng, Cryst. Growth Des., 2010, 10, 4370–4378 CrossRef CAS; (b) B. Parmar, Y. Rachuri, K. K. Bisht, R. Laiya and E. Suresh, Inorg. Chem., 2017, 56, 2627–2638 CrossRef CAS PubMed; (c) Y. Yuan, X. N. Xue, W. W. Fan, Q. M. Qiu, Y. Z. Cui, M. Liu, Z. F. Li, Q. H. Jin, Y. P. Yang, Z. W. Zhang, W. X. Geng and W. J. Zheng, J. Mol. Struct.: THEOCHEM, 2016, 1118, 98–104 CrossRef; (d) S. Liu, Z. H. Xiang, Z. Hu, X. P. Zheng and D. P. Cao, J. Mater. Chem., 2011, 21, 6649–6653 RSC; (e) C. Y. Song, Q. F. Liu, W. Liu, Z. Q. Cao, Y. Y. Ren, Q. C. Zhou and L. Zhang, J. Mol. Struct.: THEOCHEM, 2015, 1099, 49–53 CrossRef CAS.
- (a) H. Wang, W. T. Yang and Z. M. Sun, Chem. – Asian J., 2013, 8, 982–989 CrossRef CAS; (b) S. Ohkoshi, H. Tokoro, T. Hozumi, Y. Zhang, K. Hashimoto, C. Mathonière, I. Bord, G. Rombaut, M. Verelst, C. C. Moulin and F. Villain, J. Am. Chem. Soc., 2006, 128, 270–277 CrossRef CAS PubMed; (c) T. G. Qu, Q. Wei, C. Ordonez, J. Lindline, M. Petronis, M. S. Fonari and T. Timofeeva, Crystals, 2018, 8, 162 CrossRef; (d) D. D. Censo, S. Fantacci, F. D. Angelis, C. Klein, N. Evans, K. Kalyanasundaram, H. J. Bolink, M. Gra1tzel and M. K. Nazeeruddin, Inorg. Chem., 2008, 47, 980–989 CrossRef PubMed.
- (a) Z. Q. Shi, Z. J. Guo and H. G. Zheng, Chem. Commun., 2015, 51, 8300–8303 RSC; (b) P. Yang, X. X. Wu, J. Z. Huo, B. Ding, Y. Wang and X. G. Wang, CrystEngComm, 2013, 15, 8097–8109 RSC; (c) C. Y. Song, Q. F. Liu, W. Liu, Z. Q. Cao, Y. Y. Ren, Q. C. Zhou and L. Zhang, J. Mol. Struct., 2015, 1099, 49–53 CrossRef CAS.
Footnote |
| † Electronic supplementary information (ESI) available. CCDC 1842585. For ESI and crystallographic data in CIF or other electronic format see DOI: 10.1039/c8qi01260a |
| This journal is © the Partner Organisations 2019 |

