DOI:
10.1039/C8QI01039K
(Research Article)
Inorg. Chem. Front., 2019,
6, 278-286
Selective anionic dye adsorption, topology and luminescence study of structurally diverse cadmium(II) coordination polymers†
Received
27th September 2018
, Accepted 27th November 2018
First published on 28th November 2018
Abstract
A flexible carboxylate EGTA (ethylene bis(oxyethylenenitrilo) tetraacetic acid) ligand was used to construct four coordination polymers, namely, {[Cd3(EGTA)(NO3)2(H2O)6]·H2O}n1, {[Cd5(EGTA)2(bpy)4(H2O)4]bpy·(NO3)2·(H2O)8}n2, {[Cd3(EGTA)(1,2-dpe)1.5(H2O)3](NO3)2(H2O)6}n3 and {[Cd2(EGTA)(dpe)(H2O)]·(H2O)4}n4, bearing N-donor pyridyl co-linkers 4,4′-bipyridine (bpy), 1,2-di(4-pyridyl)ethane (1,2-dpe) and 1,2-di(4-pyridyl)ethylene (dpe), under solvothermal conditions. Complexes were characterized by spectroscopic and single crystal X-ray diffraction techniques to explore binding manners, geometries, dimensions and involvement of non-covalent interactions in stabilization of the structure. Complexes 1 and 3 afforded 1D zigzag infinite chain structure stabilized by hydrogen bonding of co-crystallized water molecule with uninodal 2C1 and 2,2,4C3 topologies, respectively. In contrast, complexes 2 and 4 displayed 3D sheet frameworks with 4,6-c net-connected fsc and sqc11 and uninodal 6-c net connected rob topologies, respectively. Cd(II) exhibits rare distorted trigonal pyramidal geometrical configuration in complex 3. The complexes also show solid state emission properties. Furthermore, evaluation of dye adsorption properties of complexes indicates that complexes 2 and 3 selectively adsorb anionic dyes (methyl orange and Congo red) quickly (within 30 and 90 minutes, respectively), while complex 4 adsorbs anionic dye in a longer time (∼24 h). The adsorption capabilities of complexes 2 and 3 are stronger, possibly owing to the cationic nature of the complexes and greater non-covalent interactions compared to complex 4.
1. Introduction
Rapid growth in industrial development has led to high levels of pollution in the environment. Organic dyes are a central source of environmental pollution as these dyes are commonly liberated from varied sources, i.e., leather, textiles, medicine, plastic and printing industries.1,2 Some organic dyes are toxic in nature and cause severe issues in humans as well as marine animals. In view of environmental protection, several researchers are actively developing techniques for removal of these waste organic dyes. For this purpose, numerous approaches, such as chemical, physical and biological, have been used to effectively eradicate organic dyes from the environment.3 Among several methods that are currently being investigated, adsorption has acquired the most prominent position owing to its simplicity, high efficiency and nominal effective cost.4–6 In particular, several adsorbent materials namely zeolites, resin, clay, activated carbon and porous organic and inorganic materials, have been explored as dye adsorbents.7–9 However, selectivity towards the targeted dyes is usually poor for these adsorbents. Hence, the primary goal is to design a material for the effective elimination of organic dyes.
In this direction, coordination polymers are of remarkable importance in selective uptake and adsorptive removal of dye due to their tunable porous structure, ionic framework, ultra-high surface area abundant active sites and excellent stability.10–14 The ionic coordination polymers selectively adsorb and remove anionic/cationic dyes from pollutants via noncovalent interactions and/or host–guest interactions.15 For improvement of dye adsorption property, several attempts have been employed to alter the structure of coordination polymers. Sensible selection of multi-dentate bridging ligands containing nitrogen and oxygen donors and choice of metal ion connectors has accelerated the advancement of coordination polymers with versatile functionality.16 The diversified coordination modes of multi-carboxylic acid ligands generate fascinating multidimensional and porous networks. The carboxylate ligands, owing to hydrogen donors as well as acceptor sites, have been established as worthy candidates for coordination polymers.17 In this study, EGTA ligand (ethylene bis(oxyethylenenitrilo) tetraacetic acid) was selected due to its six oxygen donor atoms and flexible framework.18 The longer span unit of EGTA enhances its chelating and bridging abilities to metal ions and contributes to the robust nature of the coordination polymers. The structural and functional properties of coordination polymers can also be modified by the introduction of pyridyl co-linkers, such as 4,4′ bipydine, 1,2-di(4-pyridyl)ethane (1,2-dpe), and 1,2-di(4-pyridyl)ethylene (dpe).19 The length and nature of coordination linkers can lead to unusual architectures, enhanced accessible molecular surface area, and diverse applications.20,21 In addition to choice of ligands, metal ions also play an important role in coordination polymers. In this perspective, Cd metal ion with d10 configuration is promising owing to its range of coordination numbers, thermal stability, and applications in photoluminescence.22,23
Encouraged by these characteristics, it is exciting to synthesize linker-dependent coordination polymers with flexible EGTA ligands under solvothermal condition. Complexes 1 and 3 showed 1D zigzag chain networks and complexes 2 and 4 showed 3D networks with several non-covalent interactions and H-bonding. Complexes 2, 3 and 4 also exhibited solid state photoluminescence properties. A dye adsorption study for complexes 2, 3 and 4 showed the selective adsorption of anionic dyes (methyl orange and Congo red) over cationic dyes (methylene blue and crystal violet).
2. Experimental section
2.1. General methods and materials
All reagents were acquired from commercially available sources and used without further purification. IR data was collected from a PerkinElmer Spectrum2 Version 10.03.06 instrument. Elemental analysis (C, H, N) data were obtained from a PerkinElmer 2400 CHN elemental analyser after overnight vacuum exposure. Solid-state fluorescence spectra were recorded using a Horiba Jobin Yvon fluorescence spectrophotometer at room temperature (RT). Thermogravimetric analyses were performed on a PerkinElmer Pyris 6 machine with a heating rate of 10 °C min−1 under N2 atmosphere from 30 to 800 °C. FE-SEM images were obtained from FEI Quanta 200 microscope equipped with a tungsten filament gun. Powder X-ray diffraction (PXRD) was recorded with a PANalytical X'Pert PRO diffractometer with Cu Kα radiation (1.54505 Å).
2.2. X-ray structural studies
The single crystal structures of complexes were collected from Bruker SMART APEX CCD diffractometer with graphite monochromatized Mo Kα radiation (λ = 0.71073 Å) at 100 K. SAINT software packages were used for data collection and reduction. The structures of complexes were solved using direct methods in SHELXTL and refined by full-matrix least-squares technique.24 Due to high disorder, thermal motion, and high degree of hydration, hydrogen atoms for one coordinated water molecule in 1, one co-crystallised water molecule in 2 and two coordinated and two co-crystallised water molecules in 3 could not be located or fixed. In the case of complex 3, the lattice contained several diffused peaks with high residual electron density, which can be attributed to the disordered nitrate as well as solvent molecules present in the crystal lattice. After unsuccessful attempts to resolve these disorder peaks, PLATON/SQUEEZE25 was used to mask the diffraction data to prevent their involvement. The solvent-accessible void volume and electron counts per unit cell were estimated to be 372 Å3 and 100e, respectively, for 3. This electron count corresponds to the nearly disordered nitrate and water molecules present in the crystal lattice.
2.3 Synthesis of {[Cd3(EGTA)(NO3)2(H2O)6]·H2O}n (1)
A mixture of Cd(NO3)2·4H2O (0.616 g, 4 mmol), EGTA (0.190 g, 1 mmol), and NaOH (0.080 g, 4 mmol) was dissolved in DMF (3 mL) and H2O (7 mL) and then heated at 110 °C in Teflon-lined vessel for 36 h. The solution was cooled to room temperature and left undisturbed. Colorless crystals were observed after two weeks and dried at 298 K under vacuum overnight. Yield: 67% (0.321 g). Elemental analysis (%) for C14H34Cd3N4O23, calcd: C, 17.45; H, 3.56; N, 5.81. Found: C, 17.89; H, 2.92; N, 6.21. FT-IR (KBr pellet, cm−1): 3429(b), 2925(w), 1613(m), 1586(s), 1411(s), 1308(s), 1262(s), 1159(s), 1005(m), 927(s), 735(b), 646(m).
2.4 Synthesis of complex {[Cd5(EGTA)2(bpy)4(H2O)4](bpy)·(NO3)2·(H2O)8}n (2)
A mixture of Cd(NO3)2·4H2O (0.616 g, 4 mmol), EGTA (0.190 g, 1 mmol), 4,4′ bipyridine (0.312 g, 4 mmol) and NaOH (0.080 g, 4 mmol) was dissolved in DMF (3 mL) and H2O (7 mL) and then heated at 110 °C in a Teflon-lined vessel for 36 h. The solution was cooled to room temperature and left undisturbed. Colorless crystals were observed after two weeks and dried at 298 K under vacuum overnight. Yield: 32% (0.390 g). Elemental analysis (%) for C78H102Cd5N16O38, calcd: C, 38.49; H, 4.22; N, 9.21 Found: C, 37.92; H, 3.74; N, 9.78. FT-IR (KBr pellet, cm−1): 3427(b), 2923(w), 1606(s), 1416(s), 1384(S), 1253(m), 1221(w), 1161(w), 1069(s), 1015(s) 839(s), 630(w), 551(s).
2.5 Synthesis of complex {[Cd3(EGTA)(1,2-dpe)1.5(H2O)3](NO3)2(H2O)6}n (3)
Complex 3 was synthesized by the same procedure as described for the synthesis of 2 except that 1,2-di(4-pyridyl)ethane (1,2-dpe) was used instead of 4,4′ bipyridine. After heating at 110 °C, crystals of 3 were obtained after 7 h and dried at 298 K under vacuum overnight. Yield: 36% (0.410 g). Elemental analysis (%) for C64H100Cd5N12O44, calcd: C, 33.37; H, 4.38; N, 7.3. Found: C, 34.04; H, 5.12; N, 7.49. FT-IR (KBr pellet, cm−1): 3423(b), 2923(w), 1605(s), 1385(s), 1254(m), 1075(m), 839(s), 631(m), 552(s).
2.6 Synthesis of complex {[Cd2(EGTA)(dpe)(H2O)]·(H2O)4}n (4)
Complex 4 was synthesized by the same procedure as described for the synthesis of 2 except that 1,2-di(4-pyridyl)ethylene (dpe) was used instead of 4,4′ bipyridine. After heating at 110 °C, crystals of 4 were obtained after 7 h and dried at 298 K under vacuum overnight. Yield: 86% (0.375 g). Elemental analysis (%) for C26H40Cd2N4O15, calcd: C, 35.75; H, 4.62; N, 6.41. Found: C, 36.04; H, 4.16; N, 6.92. FT-IR (KBr pellet, cm−1): 3429(b), 3059 (w), 1612(s), 1559(b), 1502(m), 1455(s), 1292(s), 1222(s), 1063(m), 1015(s), 845(s), 595(m), 5533(s).
2.7 Dye adsorption experiments
The freshly prepared complexes 1–4 (10 mg) were added into aqueous solutions of methyl orange (MO), Congo red (CR), methylene blue (MB) and crystal violet (CV) (1 mL, 10 μM). The solutions were monitored by UV-vis spectroscopy at successive intervals. The removal of dye (%) was obtained using the following equation:
| Dye removal (%) = Ci − Ce/Ci × 100 |
where Ci and Ce are initial and final concentrations of the dye solution, respectively.
3. Results and discussion
3.1 Structural description of the complexes
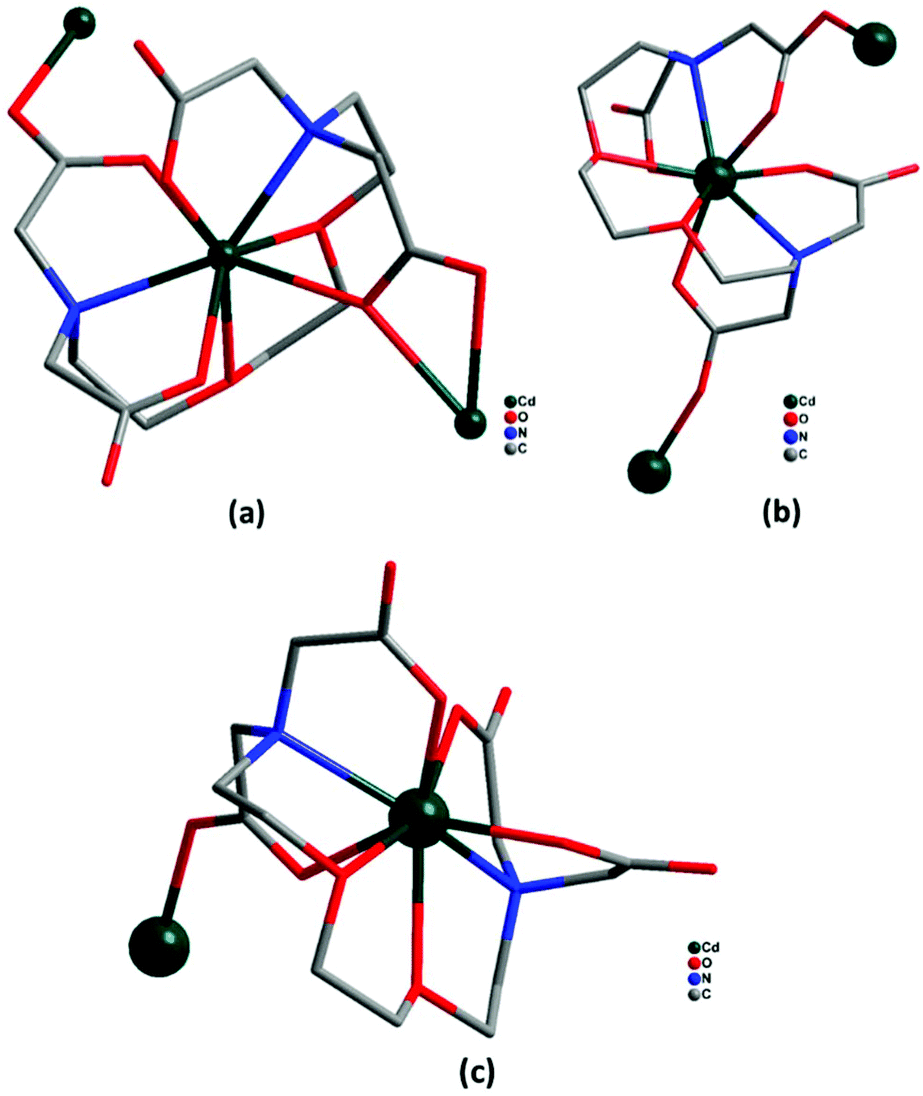
Crystallographic parameters and refinement details for the crystal structural analyses of complexes 1–4 are summarized in Table 1. Selected bond lengths and angles are tabulated in ESI1† and selected parameters for weak interactions are given in ESI2.† The coordination modes of EGTA ligand with Cd(II) ion in complexes 1–4 are shown in Fig. 1.
 |
| | Fig. 1 (a–c) Coordination modes of EGTA ligand with Cd(II) in complexes 1–4 (hydrogen atoms omitted for clarity). | |
Table 1 Crystallographic data of complexes 1–4
| Parameters |
Complex 1 |
Complex 2 |
Complex 3 |
Complex 4 |
| Chemical formula |
C14H32Cd3N4O23 |
C78H100Cd5N16O38 |
C64H92Cd5N12O44 |
C26 H40Cd2N4O15 |
|
M
r
|
961.63 |
2431.73 |
2295.49 |
873.42 |
| Crystal system |
Triclinic |
Monoclinic |
Triclinic |
Monoclinic |
| Space group |
P![[1 with combining macron]](https://www.rsc.org/images/entities/char_0031_0304.gif) |
Cc
|
P |
C2/c |
|
a (Å) |
8.4865(6) |
25.474(3) |
10.069(5) |
22.7079(10) |
|
b (Å) |
13.3852(10) |
23.533(3) |
11.558(5) |
16.2566(10) |
|
c (Å) |
13.4110(11) |
18.769(2) |
22.692(5) |
18.0067(9) |
|
α (°) |
90.842(6) |
90 |
87.207(5) |
90 |
|
β (°) |
100.808(7) |
125.827(5) |
85.685(5) |
102.003(2) |
|
γ (°) |
97.102(6) |
90 |
77.232(5) |
90 |
| Volume (Å3) |
1483.8(2) |
9123(2) |
2566.8(18) |
6501.9(6) |
|
Z
|
2 |
4 |
1 |
8 |
|
D
x (Mg m−3) |
2.152 |
1.771 |
1.485 |
1.785 |
|
F(000) |
944 |
4896 |
1152 |
3520 |
|
μ (mm−1) |
2.230 |
1.246 |
1.105 |
1.384 |
| Theta range for data collection (°) |
2.929 to 29.084 |
4.098 to 25.026 |
2.046 to 24.40 |
2.046 to 28.349 |
| Limiting indices |
−6 ≤ h ≤ 11 |
−30 ≤ h ≤ 30 |
−10 ≤ h ≤ 11 |
−30 ≤ h ≤ 30 |
| −17 ≤ k ≤ 18 |
−28 ≤ k ≤ 28 |
−12 ≤ k ≤ 13 |
−21 ≤ k ≤ 21 |
| −16 ≤ l ≤ 18 |
−22 ≤ l ≤ 22 |
−24 ≤ l ≤ 26 |
−24 ≤ l ≤ 24 |
| Reflections collected |
11![[thin space (1/6-em)]](https://www.rsc.org/images/entities/char_2009.gif) 283 283 |
54749 |
24796 |
52098 |
| Unique reflections |
7965 |
16038 |
8440 |
8110 |
|
R(int) |
0.0245 |
0.0617 |
0.0412 |
0.0253 |
| Completeness to θ |
= 25, 99.8 |
= 25.026, 99.5 |
= 24.400 99.7 |
= 25.242, 99.8 |
| Data/restraints/parameters |
6718/0/409 |
16120/3/1233 |
6616/0/560 |
8110/0/433 |
| GOF on F2 |
1.042 |
1.016 |
1.039 |
1.018 |
|
R
1 and R2 [I > 2σ(I)] |
R
1 = 0.0396, wR2 = 0.0953 |
R
1 = 0.0401, wR2 = 0.0869 |
R
1 = 0.0763, wR2 = 0.2065 |
R
1 = 0.0358, wR2 = 0.0819 |
|
R
1 and R2 (all data) |
R
1 = 0.0517, wR2 = 0.1027 |
R
1 = 0.0486, wR2 = 0.0904 |
R
1 = 0.0820, wR2 = 0.2109 |
R
1 = 0.0384, wR2 = 0.0840 |
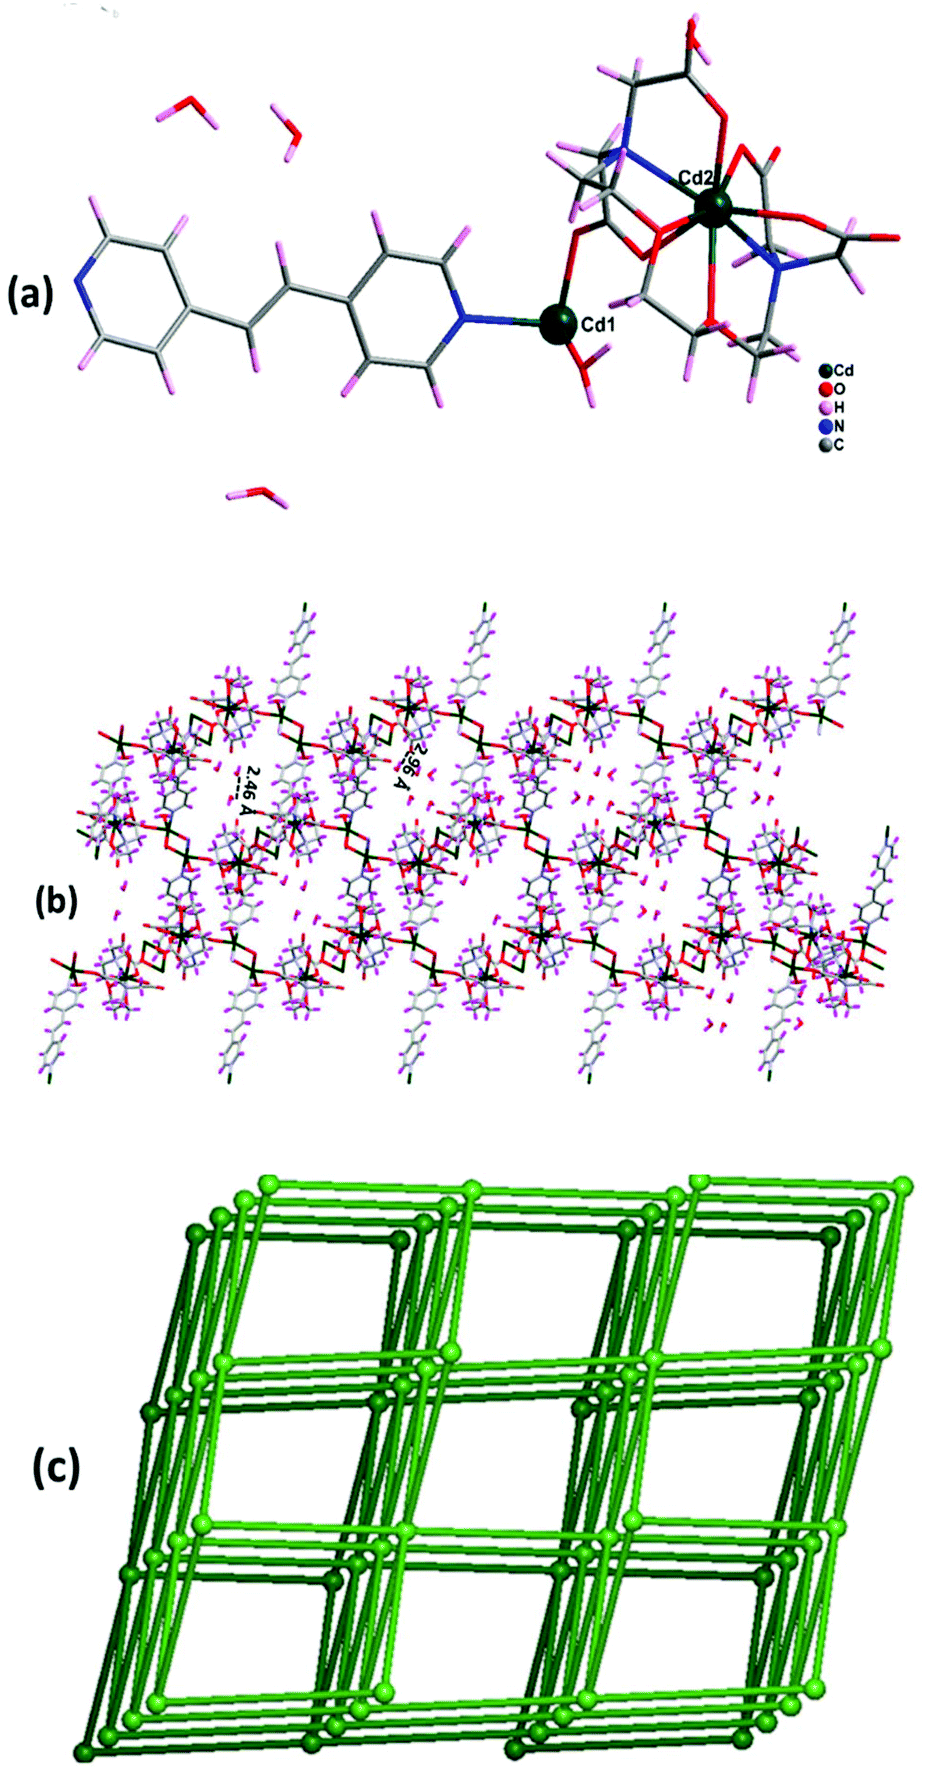
3.2 Crystal structure analysis of {[Cd3(EGTA)(NO3)2(H2O)6]·H2O} (1)
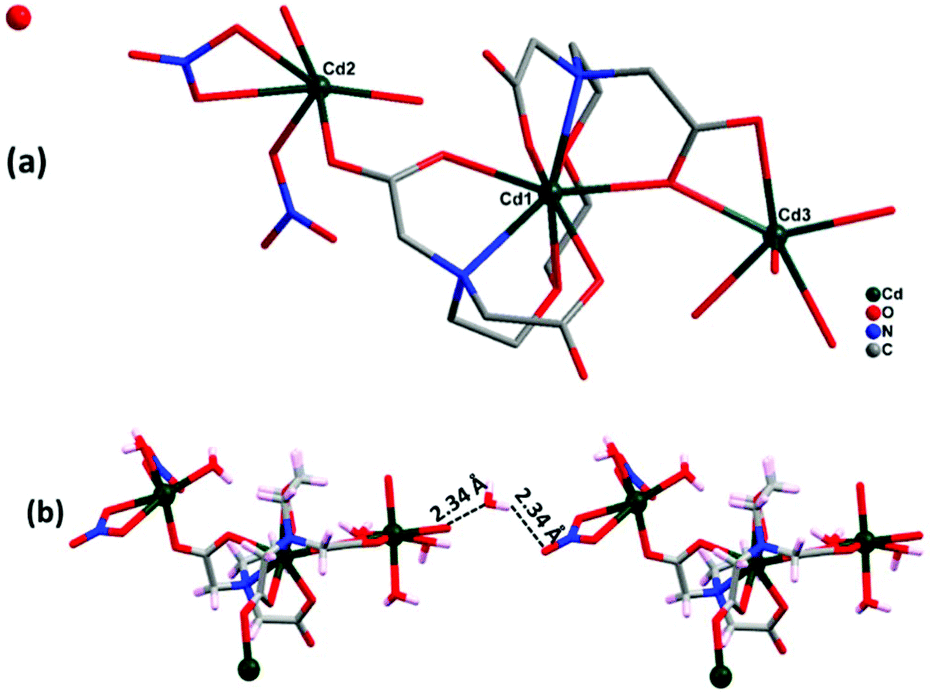
Complex 1 crystallizes in the triclinic crystal system with space group P. The asymmetric unit of 1 consists of three cadmium ions, one EGTA ligand, and two coordinated nitrates along with six coordinated and one lattice water molecules (Fig. 2a). EGTA ligand is connected to one Cd(II) center in an octa-dentate fashion, with typical Cd–O bond lengths ranging from 2.283(4) to 2.530(3) Å and Cd–N bond lengths ranging from 2.387(4) to 2.433(4) Å. Two Cd(II) ions are hexa-coordinated, showing monocapped and bicapped distorted octahedral geometry, while one Cd(II) ion is octa-coordinated with distorted square antiprism geometry (ESI3†). These three Cd(II) ions display different coordination modes with EGTA ligand: Cd1 has all four coordinated COOH groups in chelating and bridging modes, whereas Cd2 has one coordinated carboxylate group in μ2–η1:η1 bridging mode, two coordinated nitrate groups and two water molecules. Cd3 has a chelating and μ2–η2:η1 bridging mode carboxylate moiety of EGTA ligand along with four water molecules. The chelating EGTA moiety at Cd1 makes bite angles of 145.38(13)° (N2–Cd1–N1) and 82.80(13)° (O1–Cd1–O7). Carboxylate oxygen atoms present in the complex contributed to hydrogen bonding (O–H⋯O) interactions with lattice water molecules with a distance of 2.34 Å, thus providing overall stability to the molecule (Fig. 2b). The outcome is the formation of a 1D chain-like structure. Topological analysis26 shows that the zig zag 1D polymeric framework of complex 1 is a uninodal 2-connected net with simple 2C1 topology.
 |
| | Fig. 2 (a) Asymmetric unit of complex 1 (hydrogen atoms omitted for clarity). (b) Two sets of complex 1 showing O–H⋯O interactions. | |
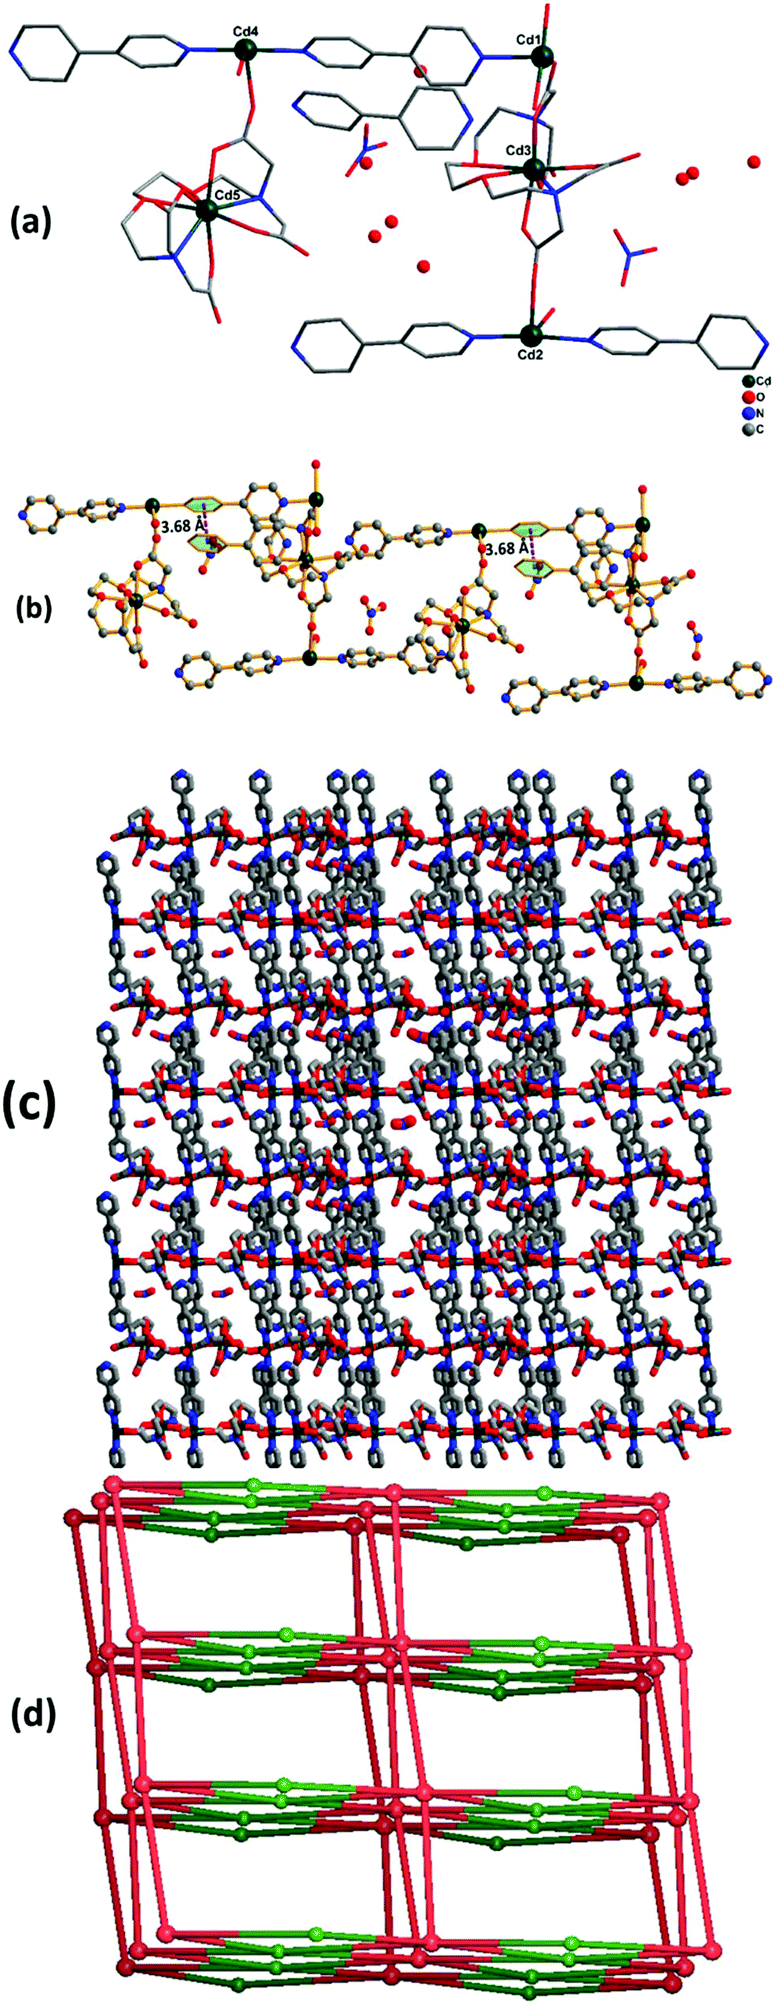
3.3. Crystal structure analysis of {[Cd5(EGTA)2(bpy)4(H2O)4](bpy)·(H2O)8·(NO3)2}n (2)
Complex 2 crystallizes in the monoclinic crystal system with space group Cc. The asymmetric unit contains five Cd(II) ions, two EGTA molecules, four co-ligand 4,4′-bpy moieties, and four coordinated water molecules along with two nitrate groups, one 4,4′-bpy and eight water molecules in the lattice (Fig. 3a). Cd3 and Cd5 are octa-coordinated with a distorted square antiprism geometry caused by carboxylate anion and nitrogen donor of the EGTA ligand, whereas Cd1, Cd2, and Cd4 are tetra-coordinated with a distorted tetrahedral geometry. The Cd1–Cd3 binding distance is 5.5 Å. The dihedral angle between the EGTA ligand and 4,4′-bpy linker O(1)–Cd(2)–N(016) was observed to be 100.73(18)°. The chelating EGTA moiety at Cd1 makes bite angles at N(011)–Cd(3)–N(017) and O(3)–Cd(3)–O(10) of 144.5(2)° and 84.38(16)°, respectively. The lattice 4,4′-bpy linker with adjacent Cd-EGTA chains displayed an intramolecular π⋯π stacking interaction distance of 3.68(1) Å (Fig. 3b). The hydrogen atom of co-crystallised water and adjacent carboxylate of Cd-EGTA form hydrogen bonding (O–H⋯O) interactions with bond distances of 2.43 Å and 3.14 Å (ESI4†). Furthermore, two neighbouring polymeric chains interact with each other to produce a 3D sheet-like supramolecular structure of dimension 15.59 × 12.79 Å2 (Fig. 3c).
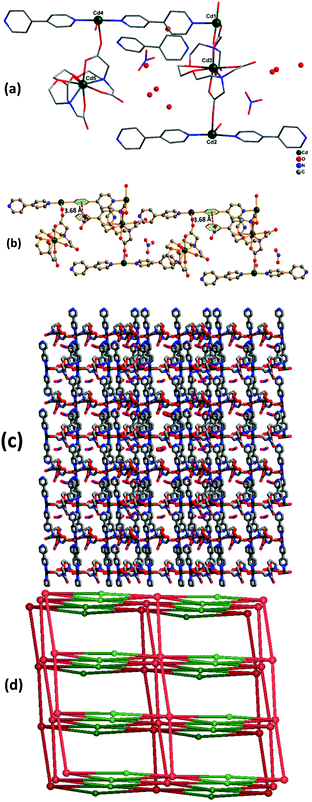 |
| | Fig. 3 (a) Asymmetric unit of 2 (hydrogen atoms are omitted for clarity). (b) The intermolecular π–π interaction in 2 along c axis. (c) 3D sheet-like supramolecular structure of 2 along c axis. (d) Schematic of the binodal (4,6-c) net forming fsc (sqc11) topology in 2. | |
Topological analysis26 shows that the dinuclear Cd center acts as a four-connected node, while carboxylate groups of EGTA and bpy act as six-connected nodes and the overall SBUs act as a two-connected node. Thus, the entire 3D framework has a 4,6-connected net and the framework exhibits fsc (sqc11) topological configuration (Fig. 3d). Topological simplification displays a binodal (4,6-c) net forming network with Schläfli point symbol {44·610·8}{44·62}.
3.4 Crystal structure analysis of {[Cd3(EGTA)(1,2-dpe)1.5(H2O)3](NO3)2(H2O)6}n (3)
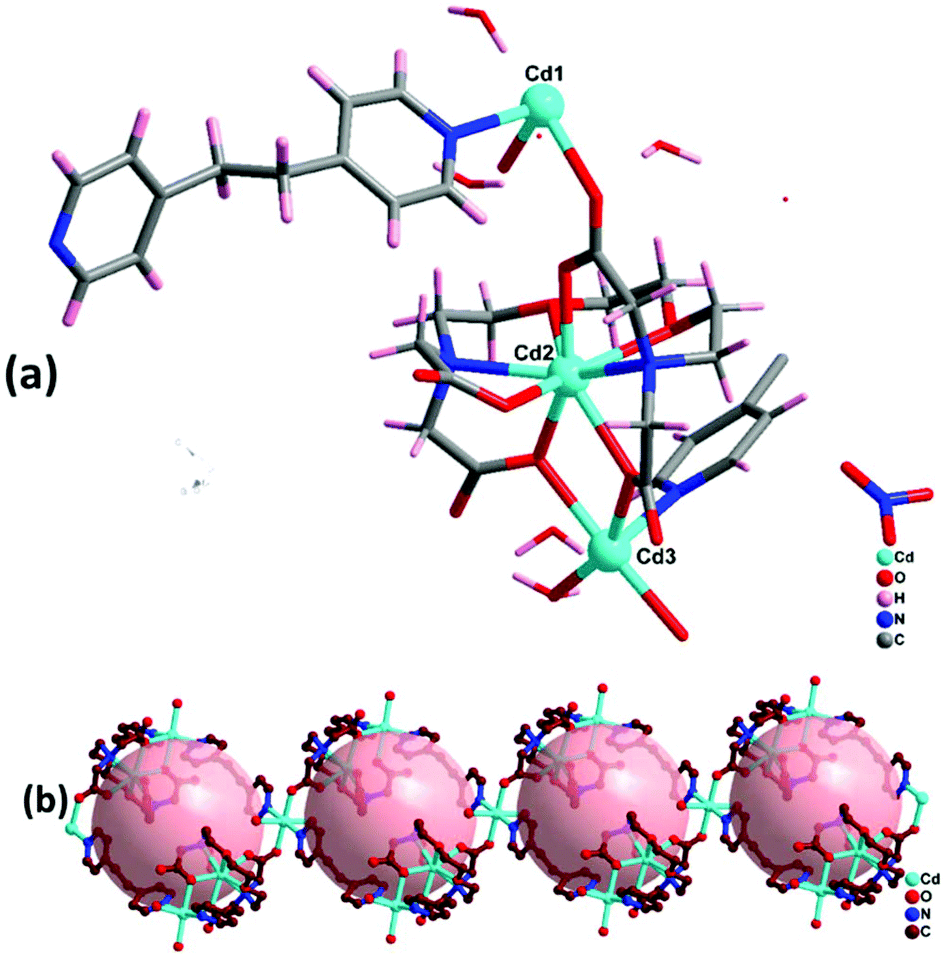
Complex 3 crystallizes in the triclinic crystal system with space group P. The asymmetric unit contains three Cd(II) ions, one EGTA ligand, one and a half co-ligand 1,2-dpe, and three coordinated water molecules along with one nitrate and six water molecules in the lattice (Fig. 4a). The difference electron density map for complex 3 indicates disordered nitrate and solvent molecules, which is further confirmed by PLATON/SQUEEZE. The calculated solvent-accessible void volume/electron count is found to be 372 Å3/100e. All three Cd(II) ions are coordinated differently with different geometries: (1) Cd1 is tri-coordinated via one 1,2-dpe, water and bridging (μ2–η1:η1) mode carboxylate anion of EGTA ligand with rare distorted trigonal pyramidal geometry; (2) Cd2 has octa-coordinated distorted square antiprism geometry by employing bridging (μ2–η1:η1) mode and chelating and bridging (μ4–η2:η2) mode carboxylate anions and nitrogen donor of EGTA ligand; (3) Cd3 is tetra-coordinated with chelating, bridging (μ4–η2:η2) mode carboxylate anion of EGTA, 1,2-dpe and two water molecules, with highly distorted tetrahedral geometry. Cd2 and Cd3 are separated by a bridged carboxylate anion of EGTA ligand with distance of 3.84 Å.
 |
| | Fig. 4 (a) Asymmetric unit of complex 3 (hydrogens of EGTA and water molecules omitted for clarity). (b) 1D zig zag chain-like structure of complex 3 along b axis. | |
Inside the co-crystal, water molecules stabilised the structure and the lattice revealed 1D chain-like structure (Fig. 4b). The unit cell packing shows the formation of a 22-membered ring of ∼6 Å diameter. Topological analysis revealed that the underlying network can be classified as 2,2,4C3 topology.
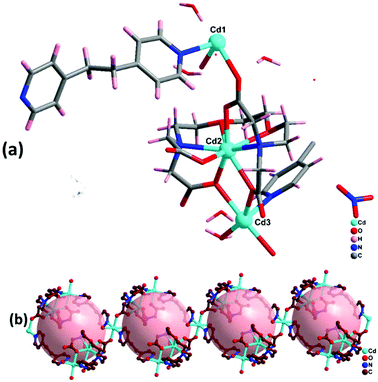
3.5 Crystal structure analysis of {[Cd2(EGTA)(dpe)(H2O)](H2O)4}n4
Complex 4 crystallizes in the monoclinic crystal system with space group C2/c. The asymmetric unit contains two Cd(II) ions, one EGTA ligand, one co-ligand dpe, and one coordinated water molecule along with four water molecules in the lattice (Fig. 5a). Cd1 is tri-coordinated with ligation from one dpe, one bridging (μ2–η1:η1) mode carboxylate anion of EGTA, and one coordinated water molecule, giving it a distorted trigonal pyramidal geometry. Cd2 is octa-coordinated with a distorted square antiprism geometry. The Cd–O bond distances range between 2.266(2) and 2.523(2) Å, while the Cd–N distances are between 2.310(2) and 2.431(3) Å. Carboxylate oxygen atoms and neighbouring water in the complex contributed to hydrogen bonding (O–H⋯O) interactions with a distance of 2.29 Å and further form a 3D channel of dimension 15.66 × 16.14 Å2 (Fig. 5b).
 |
| | Fig. 5 (a) Asymmetric unit of complex 4. (b) 3D channel-like structure of 4 with hydrogen bonding along b axis. (c) The six-connected uninodal network with rob topology. | |
Topological investigation explains that the dinuclear Cd(II) centers can behave as a single node, with EGTA and dpe ligands as linkers. Interestingly, each node is linked to six other nodes and forms a six-connected uninodal net, which is assigned to rob topology with point symbol {48·66·8} (Fig. 5c).
3.6 Thermal analyses
Thermogravimetric analyses (TGA) were performed on crystalline samples under nitrogen atmosphere, as depicted in Fig. SI5.† TGA study of the complexes showed the loss of crystallized water molecules begins at ∼30 °C. Complex 1 shows gradual weight loss up to 323 °C due to coordinated nitrate, water and co-crystallised water (observed 25.93%, calculated 25.86). Then, the final decomposition starts from 323 °C and continues up to 800 °C. In complex 2, weight loss (%) is attributed to the loss of lattice nitrate and water molecules (observed 10.83%, calculated 10.90) from 30–186 °C followed by gradual loss of co-crystallised 4,4′-bpy (observed 6.25%, calculated 6.40) up to 209 °C. The second weight loss of 34.69% (calcd 34.17) in the temperature range of 209–239 °C is attributed to loss of coordinated EGTA and water molecules. The final decomposition was observed from 239 to 800 °C. In complex 3, the weight loss (%) corresponds to lattice water and coordinated water molecules (observed 6.96%, calculated 7.03) at 148 °C followed by gradual loss of nitrate, coordinated EGTA and 1,2-dpe at 324 °C (observed 33.86%, calculated 34.07). The final decomposition starts at 314 °C and continues up to 800 °C. In complex 4, the gradual weight loss in the temperature range of 30–125 °C is attributed to loss of lattice water and coordinated water molecule (observed 10.2%, calculated 9.69). The second weight loss through the temperature range of 125–319 °C is due to the loss of dpe co-ligand (observed 19.89%, calculated 20.83). The final decomposition began above 319 °C and continued up to 800 °C.
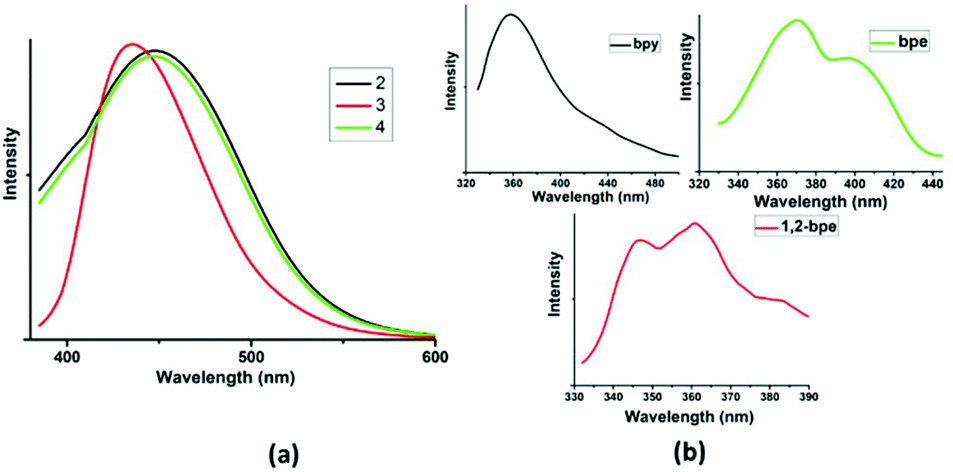
3.7 Photoluminescence
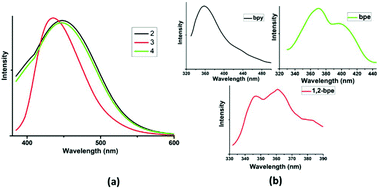
Complexation with d10 closed shell metals affords interesting supramolecular frameworks with variable photophysical properties due to their higher stability over the organic ligands.27 In addition, the N-pyridyl co-linkers encourage the formation of charge-transfer interaction owing to the presence of both n- and π-electrons.28 The solid state emission spectra of complexes 2–4 are displayed in Fig. 6a. Complex 1 is non-emissive in nature. Complex 2 exhibits an emission peak at 435 nm upon excitation at λmax = 375 nm. This can be attributed to ligand-centred (4,4′ bipyridine) transitions. The luminescence spectra of complexes 3 and 4 seem to be slightly blue-shifted compared with that of complex 2. Complexes 3 and 4 exhibit emission at λmax of 448 and 450 nm (λmax = 380 nm and λmax = 382 nm), respectively, which can be assigned to the intra-ligand transition of 1,2-bpe and bpe ligands, respectively.29 The decrease in the emission intensity for complexes 3 and 4 is due to the vibrational quenching of water present in the framework. The luminescence peaks are red-shifted relative to those of the free linker ligands (λmax = 357 nm for 4,4′-bipyridine, λmax = 344 and 365 nm for 1,2-bpe; λmax = 370 and 395 nm for bpe), as shown in Fig. 6b.
 |
| | Fig. 6 (a) Solid state luminescence spectra of complexes 2–4 and (b) solid state luminescence spectra of free linkers. | |
3.8 Dye adsorption study
Several toxic commercial dyes used in industries and laboratories cause severe side effects in the surroundings and aquatic life.30,31 To date, numerous approaches have been implemented for the removal of dyes from wastewater resources, among which adsorption is the most prominent owing to its economic feasibility, high efficiency and effectiveness.32,33 In recent years, coordination polymers have been paid special attention for the removal of hazardous dyes through adsorption method. Charged and porous coordination polymers have been stated as probable materials for adsorption of dyes. Particularly, ion exchange, size selectivity and non-covalent interactions are the main aspects of dye adsorption methods.34–36
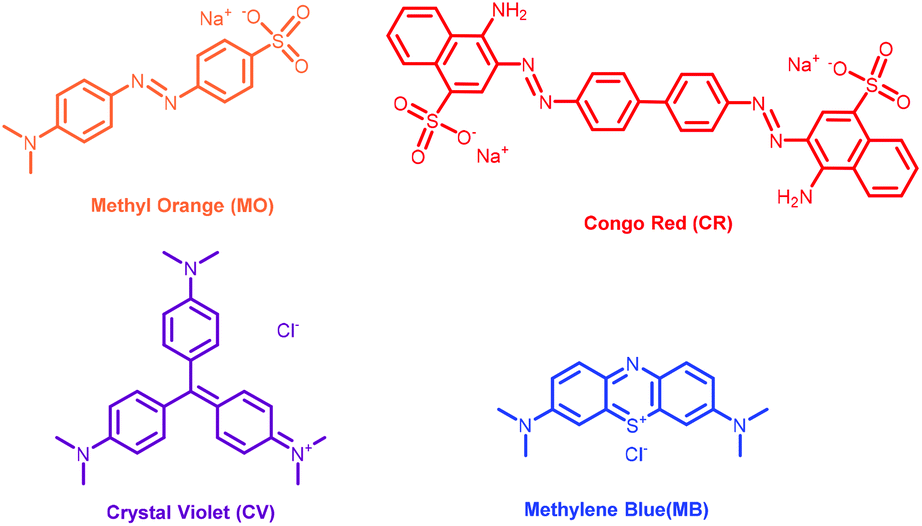
In view of the similar sizes and different charges of cationic (crystal violet, CV; methylene blue, MB) and anionic (methyl orange, MO; Congo red, CR) dyes (Scheme 1), it is interesting to study the comparisons of their adsorption ability. Freshly synthesized 10 mg of complexes 1–4 was immersed in aqueous solutions of the dyes at room temperature. The adsorption capability of the complexes towards dyes was quantitatively evaluated by UV-vis spectroscopy at certain time intervals. The UV-vis spectroscopy showed that complexes 2 and 3 displayed tremendously fast capacity to adsorb anionic dyes (methyl orange and Congo red), while complex 4 shows longer anionic dye adsorption time of ∼24 h in aqueous medium (ESI6a†). However, their abilities to adsorb cationic dyes are almost negligible. In contrast, the complex 1 did not exhibit any adsorption proficiency towards either cationic or anionic dyes (ESI6b†).
 |
| | Scheme 1 Structure of dye molecules used in the adsorption study. | |
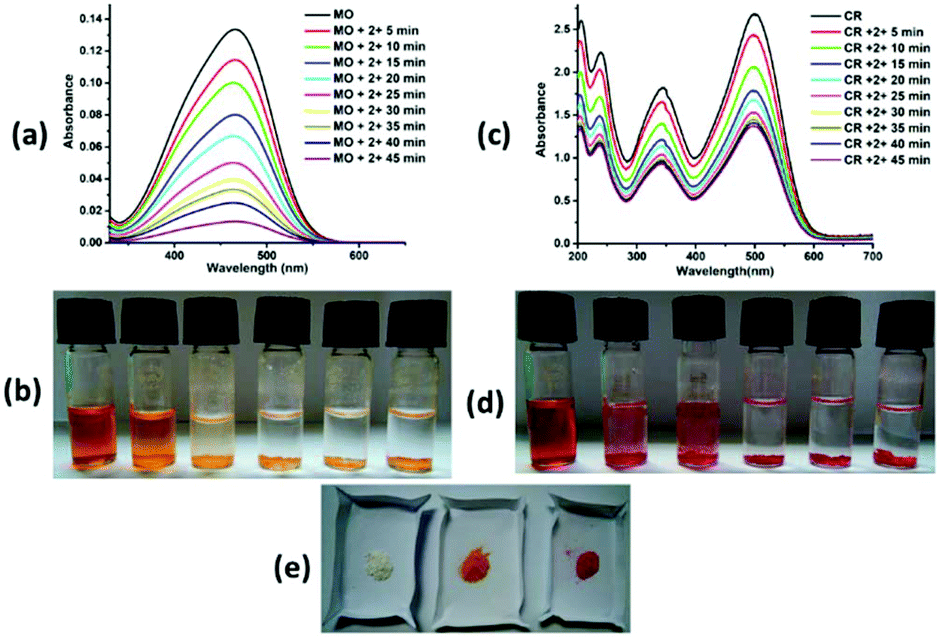
Complexes 2 and 3 adsorbed ∼95% and 91% methyl orange dye solution, respectively, after 5 hours (Fig. 7a and 8a), whereas complex 4 adsorbed ∼82% methyl orange dye after 24 hours (ESI7a†). The colour of the solution changes from orange to colourless and the colour of the crystalline sample changes from white to orange/pale yellow (Fig. 7b, e, 8b, e and ESI7b, e†). Complex 2 exhibited very fast adsorption of dye (within ∼30 minutes). UV-vis spectroscopy showed that the concentration of aqueous MO significantly decreased with time. Indeed, similar results have been reported for age-based cationic copper metal organic framework for MO dye.37 Furthermore, 92% and 89% of Congo red were captured by complex 2 and 3, respectively, with the colour of the crystalline sample changing from white to red; these values are comparable to those for reported complexes. However, the colour of solution changes from red to colourless in both cases (Fig. 7c, d, e and 8c, d, e). Complexes 2 and 3 showed comparable CR dye adsorption to earlier reported complexes.38–40 Similarly, complex 4 adsorbs ∼86% Congo red after 24 hours incubation (ESI 7c, d and e†). Diverse exchange behaviours of both complexes 2 and 3 with anionic dyes displayed the cationic nature of framework, as observed in the crystal structure. The nitrate anion in the structural framework may be favourable for exchange of the anionic dye molecules, as previously reported.41 In other words, complexes 2 and 3 selectively adsorb only cationic dyes through ion exchange mechanism. The IR spectra of complexes 2 and 3 with MO and CR dye showed disappearance of the NO3− ion peak (at ∼1384 and 1385 cm−1, respectively). In contrast, the peaks in the range of 1049–1275 cm−1 (characteristic IR peaks of S![[double bond, length as m-dash]](https://www.rsc.org/images/entities/char_e001.gif) O) and 1400–1426 cm−1 (characteristic IR peaks of azo group) are observed after adsorption of anionic dyes (MO and CR), which confirm the favourable ion exchange (ESI8†). After anionic exchange, the free carboxylic group and large cavity size (3D framework) may be the most likely adsorptive site in complex 2. The interactions between the complexes and dyes may be non-covalent, such as π–π interaction, hydrophobic interaction, and hydrogen bonding interaction. Exploration of the structural framework of complex 4 reveals only the 3D network for anionic dye capture via different non-covalent interactions. In addition, the adsorption of MB and CV with complex 2 was also studied. No adsorption changes were detected in both cases (ESI9†). The adsorption investigation of these complexes suggested that complexes 2 and 3 may have possible applications in selective removal of dyes from wastewater before liberation into the environment.
O) and 1400–1426 cm−1 (characteristic IR peaks of azo group) are observed after adsorption of anionic dyes (MO and CR), which confirm the favourable ion exchange (ESI8†). After anionic exchange, the free carboxylic group and large cavity size (3D framework) may be the most likely adsorptive site in complex 2. The interactions between the complexes and dyes may be non-covalent, such as π–π interaction, hydrophobic interaction, and hydrogen bonding interaction. Exploration of the structural framework of complex 4 reveals only the 3D network for anionic dye capture via different non-covalent interactions. In addition, the adsorption of MB and CV with complex 2 was also studied. No adsorption changes were detected in both cases (ESI9†). The adsorption investigation of these complexes suggested that complexes 2 and 3 may have possible applications in selective removal of dyes from wastewater before liberation into the environment.
 |
| | Fig. 7 (a) UV-vis spectra of aqueous solution of MO dye with complex 2. (b) The photograph shows that the colour of dye solution changes with time in presence of 2. (c) UV-vis spectra of aqueous solution of CR dye with complex 2. (d) The photograph shows that the colour of dye solution changes with time in presence of complex 2. (e) The colour of crystalline complex 2 before and after MO and CR dye adsorption. | |
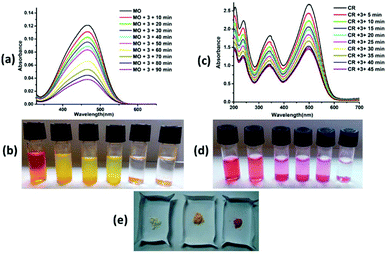 |
| | Fig. 8 (a) UV-vis spectra of aqueous solution of CR dye with complex 3. (b) The photograph shows that the colour of dye solution changes with time in presence of complex 3. (c) UV-vis spectra of aqueous solution of CR dye with complex 3. (d) The photograph shows that the colour of dye solution changes with time in presence of 3. (e) The colour of complex 3 before and after MO and CR dye adsorption. | |
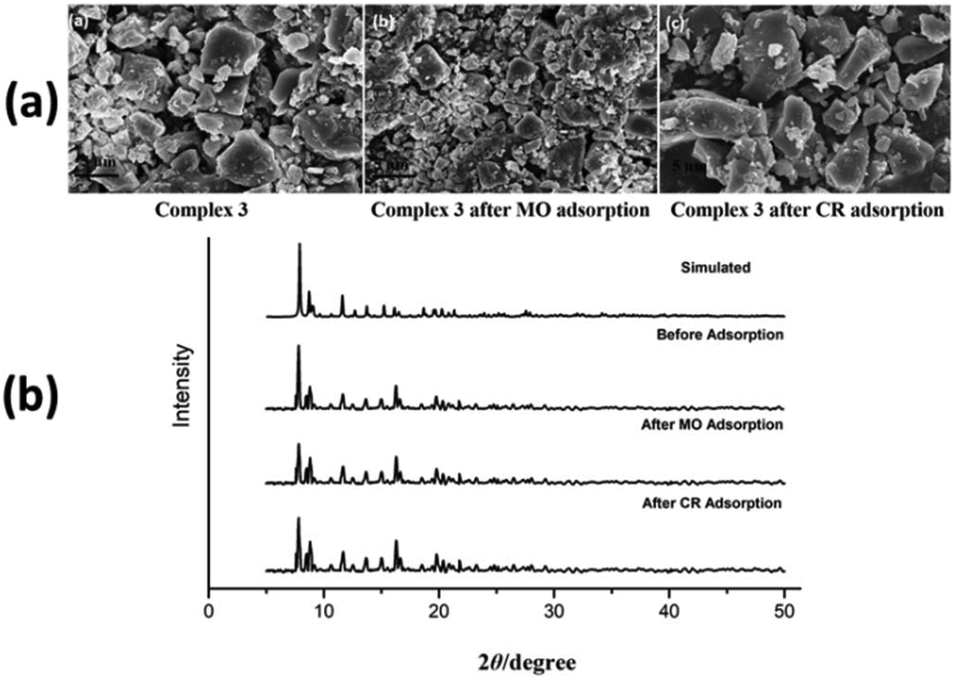
SEM micrographs of complexes 2, 3 and 4 were used to evaluate the stability of complexes after anionic (MO and CR) dye adsorption (Fig. 9a, 10a and ESI10a†). The morphologies of complexes remain consistent to the structural integrity before and after adsorption of anionic dyes, which indicates that complexes are stable after adsorption process. In order to confirm the retention of structural integrity of complexes after the dye adsorption study, PXRD patterns were recorded for complexes 2–4 (Fig. 9b, 10b and ESI10b†) at room temperature. The patterns reveal good agreement with both the corresponding simulated patterns and pure crystalline samples, indicating the good stability of the crystalline phase after dye adsorption.
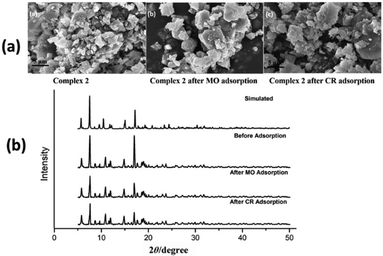 |
| | Fig. 9 (a) FE-SEM micrographs of complex 2 before and after MO and CR dye adsorption. (b) PXRD patterns of simulated and as-synthesized complex 2 before and after dye adsorption. | |
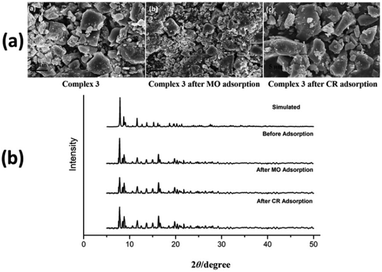 |
| | Fig. 10 (a) FE-SEM micrographs of complex 3 before and after MO and CR dye adsorption. (b) PXRD patterns of simulated and as-synthesized complex 3 before and after dye adsorption. | |
In addition, as a novel material application in the environment, recycling capacities of the complexes were explored in aqueous solution and NaCl solution. The fully adsorbed complexes with dyes were monitored spectrophotometrically at different time intervals. The aqueous solution of saturated complexes containing MO released the dyes at around 24 hours. However, introduction of NaCl in saturated complex solutions containing dyes facilitated the release of dye molecules within 3 hours (ESI11, 12 and 13†). This faster desorption of dye molecules could be due to Cl− acting as a trigger. This result also supports the adsorption and desorption of dye via ion exchange process.
4. Conclusion
Herein, the syntheses of four diverse catenated Cd(II) coordination polymers using EGTA ligand with various N-pyridyl co-linkers under solvothermal conditions were established. Different binding modes, geometries and dimensionalities of Cd(II) complexes with EGTA ligand were also investigated. Complexes 1 and 3 contained 1D zigzag chain-like structures stabilized by co-crystallized water. However, complexes 2 and 4 formed 3D sheet-like structures through significant non-covalent secondary interactions, with fsc (sqc11) and rob topology, respectively. Furthermore, the solid state luminescence spectra of complexes 1–4 were also investigated. Among these complexes, complexes 2, 3 and 4 were explored for their application in dye adsorption. The complexes 2, 3 and 4 were capable of selectively adsorbing the anionic dyes over the cationic dyes via anion exchange and non-covalent interactions. The ease of synthesis of these complexes and their selective adsorption of anionic dyes open up new prospects for these complexes for application in environment-related fields.
Conflicts of interest
There are no conflicts to declare.
Acknowledgements
Financial assistance received from the SERB, New Delhi, India [SB/FT/CS-188/2013] is gratefully acknowledged. I would like to thank Professor Sandeep Verma, Department of Chemistry, IIT Kanpur, India for providing the research facility to carry out the work successfully. I would also acknowledge the single-crystal CCD X-ray facility at IIT Kanpur.
Notes and references
- G. Crini, Bioresour. Technol., 2006, 97, 1061–1085 CrossRef CAS.
- T. A. Saleh and V. K. Gupta, Environ. Sci. Pollut. Res. Int., 2012, 19, 1224–1228 CrossRef CAS PubMed.
- B. B. Chang, D. X. Guan, Y. L. Tian, Z. C. Yang and X. P. Dong, J. Hazard. Mater., 2013, 262, 256–264 CrossRef CAS PubMed.
- A. Afkhami and R. Moosavi, J. Hazard. Mater., 2010, 174, 398–403 CrossRef CAS.
- I. K. Kapdan and R. Ozturk, J. Hazard. Mater., 2005, 123, 217–222 CrossRef CAS PubMed.
- M. Gutierrez, M. Pepió and M. Crespi, Color. Technol., 2002, 118, 1–5 CAS.
- V. Gupta, J. Environ. Manage., 2009, 90, 2313–2342 CrossRef CAS PubMed.
- Y. Fan, H.-J. Liu, Y. Zhang and Y. Chen, J. Hazard. Mater., 2015, 283, 321–328 CrossRef CAS PubMed.
- C.-K. Lee, S.-S. Liu, L.-C. Juang, C.-C. Wang, K.-S. Lin and M.-D. Lyu, J. Hazard. Mater., 2007, 147, 997–1005 CrossRef CAS PubMed.
- W. L. Leong and J. J. Vittal, Chem. Rev., 2011, 111(2), 688–764 CrossRef CAS.
- S. Kitagawa, R. Kitaura and S.-I. Noro, Angew. Chem., Int. Ed., 2004, 43, 2334–2375 CrossRef CAS.
- S. Chen, J. Zhang, T. Wu, P. Feng and X. Bu, J. Am. Chem. Soc., 2009, 131, 16027–16029 CrossRef CAS.
- J.-B. Lin, J.-P. Zhang and X.-M. Chen, J. Am. Chem. Soc., 2010, 132, 6654–6656 CrossRef CAS PubMed.
- J. Pang, F. Jiang, M. Wu, C. Liu, K. Su, W. Lu, D. Yuan and M. Hong, Nat. Commun., 2015, 6, 7575–7581 CrossRef PubMed.
- L.-L. Lv, J. Yan, H.-M. Zhang, Y.-Y. Liu and J.-F. Ma, Inorg. Chem., 2015, 54(4), 1744–1755 CrossRef CAS PubMed.
- A. Y. Robin and K. M. Fromm, Coord. Chem. Rev., 2006, 250, 2127–21573 CrossRef CAS.
- X.-L. Wang, C. Qin and E.-B. Wang, Cryst. Growth Des., 2006, 6, 439–443 CrossRef CAS.
- R. Gaur, A. Susmitha, K. V. R. Chary and L. Mishra, RSC Adv., 2014, 4, 24038–24041 RSC.
- R. Haldara and T. K. Maji, CrystEngComm, 2013, 15, 9276–9295 RSC.
- A. K. Gupta, K. Tomar and P. K. Bharadwaj, CrystEngComm, 2017, 19, 2253–2263 RSC.
- S. Sen, S. Neogi, A. Aijaz, Q. Xu and P. K. Bharadwaj, Dalton Trans., 2014, 6100–6107 RSC.
- K. J. Wei, Y. S. Xie, J. Ni, M. Zhang and Q. L. Liu, Cryst. Growth Des., 2006, 6, 1341–1350 CrossRef CAS.
- Q. Ye, X.-B. Chen, Y.-M. Song, X.-S. Wang, J. Zhang, R.-G. Xiong, H.-K. Fun and X.-Z. You, Inorg. Chim. Acta, 2005, 358, 1258–1262 CrossRef CAS.
- G. M. Sheldrick, Acta Crystallogr., Sect. C: Struct. Chem., 2015, 71, 3–8 Search PubMed.
- A. L. Spek, Acta Crystallogr., Sect. C: Struct. Chem., 2015, 71, 9–18 CrossRef CAS PubMed.
- V. A. Blatov, A. P. Shevchenko and D. M. Proserpio, Cryst. Growth Des., 2014, 14, 3576–3586 CrossRef CAS.
- B. Gole, A. K. Bar and P. S. Mukherjee, Chem. Commun., 2011, 47, 12137–12139 RSC.
- S. M. Teleb and A. S. Gaballa, Spectrochim. Acta, Part A, 2005, 62, 140–145 CrossRef.
- X.-D. Zhu, Y. Li, W.-X. Zhou, R.-M. Liu, Y.-J. Ding, J. Lü and D. M. Proserpio, CrystEngComm, 2016, 18, 4530–4537 RSC.
- X. Liu, W. Gong, J. Luo, C. Zou, Y. Yang and S. Yang, Appl. Surf. Sci., 2016, 362, 517–524 CrossRef CAS.
- A. T. Paulino, M. R. Guilherme, A. V. Reis, G. M. Campese, E. C. Muniz and J. Nozaki, J. Colloid Interface Sci., 2006, 301, 55–62 CrossRef CAS.
- Y. Rachuri, S. Subhagan, B. Parmar, K. K. Bisht and E. Suresh, Dalton Trans., 2018, 898–908 RSC.
- P.-Y. Du, H. Li, X. Fu, W. Gu and X. Liu, Dalton Trans., 2015, 13752–13759 RSC.
- Y. Han, S. Sheng, F. Yang, Y. Xie, M. Zhaoa and J.-R. Li, J. Mater. Chem. A, 2015, 3, 12804–12809 RSC.
- Y. Cui, T. Song, J. Yu, Y. Yang, Z. Wang and G. Qian, Adv. Funct. Mater., 2015, 25, 4796–4802 CrossRef CAS.
- X.-S. Wang, J. Liang, L. Li, Z.-J. Lin, P. P. Bag, S.-Y. Gao, Y.-B. Huang and R. Cao, Inorg. Chem., 2016, 55, 2641–2649 CrossRef CAS PubMed.
- X. Zhang, Y. Gao, H. Liua and Z. Liu, CrystEngComm, 2015, 17, 6037–6043 RSC.
- K. Maity, T. Kundu, R. Banerjee and K. Biradha, CrystEngComm, 2015, 17, 4439–4443 RSC.
- J. Zhang, C.-C. Wang, P. Wang and Y.-L. Cao, RSC Adv., 2016, 6, 73595–73599 RSC.
- F.-L. Hu, Y.-X. Shi, H.-H. Chen and J.-P. Lang, Dalton Trans., 2015, 18795–18803 RSC.
- D.-M. Chen, W. Shi and P. A. Cheng, Chem. Commun., 2015, 51, 370–372 RSC.
|
| This journal is © the Partner Organisations 2019 |
Click here to see how this site uses Cookies. View our privacy policy here.