
Sn(TFSI)2 as a suitable salt for the electrodeposition of nanostructured Cu6Sn5–Sn composites obtained on a Cu electrode in an ionic liquid†
Nadia
Soulmi
 a,
Ana-Gabriela
Porras-Gutierrez
*ac,
Natalia E.
Mordvinova
b,
Oleg I.
Lebedev
b,
Cécile
Rizzi
ac,
Juliette
Sirieix-Plénet
ac,
Henri
Groult
ac,
Damien
Dambournet
ac and
Laurent
Gaillon
*ac
a,
Ana-Gabriela
Porras-Gutierrez
*ac,
Natalia E.
Mordvinova
b,
Oleg I.
Lebedev
b,
Cécile
Rizzi
ac,
Juliette
Sirieix-Plénet
ac,
Henri
Groult
ac,
Damien
Dambournet
ac and
Laurent
Gaillon
*ac
aSorbonne Université, CNRS, Physico-Chimie des Électrolytes et Nano-Systèmes Interfaciaux, PHENIX, F-75005 Paris, France. E-mail: laurent.gaillon@sorbonne-universite.fr; ana-gabriela.porras-gutierrez@sorbonne-universite.fr
bLaboratoire CRISMAT, ENSICAEN, Université de Caen, CNRS, 6 Bd Maréchal Juin, F-14050 Caen, France
cRéseau sur le Stockage Electrochimique de l'Energie (RS2E), FR CNRS 3459, 80039 Amiens cedex, France
First published on 29th November 2018
Abstract
The preparation of binder and carbon-free electrodes is of great interest owing to their higher energy density. In this scope, electrodeposition is a suitable method that can be easily scaled up provided that suitable chemical reactants are used. In this work, we used a highly soluble Sn precursor based on TFSI counter ions dissolved in an [EMIm+][TFSI−] ionic liquid. The use of similar anionic groups in both the Sn precursor and the solvent allowed avoiding impurities typically encountered when using the Sn chloride precursor. The resulting solution was characterized by cyclic voltammetry using either an inert (Mo) or a reactive substrate (Cu). In both cases, the electrodeposition occurred in a diffusion controlled process. In the case of Cu, however, a Cu–Sn alloy that is the η-Cu6Sn5 phase was identified. An FIB cross section revealed that Cu and Sn interdiffused and that no epitaxial growth occurred. Prolonging the electrodeposition time favored the formation of β-Sn because Cu could no longer diffuse within the deposited structure. This resulted in a mixed β-Sn/η-Cu6Sn5 composite whose proportions depended on the deposition duration time. The deposited samples were directly assembled in lithium coin cells to characterize the capacity and cyclability of the binder and carbon-free electrodes. Increasing the mass of the deposited sample degraded the capacity and reversibility of the system which was explained by a lower ability to accommodate the volume variation occurring during the electrochemical lithiation/delithiation process.
Introduction
Sn-Based materials are challenging the widely used graphite anode materials for Li-ion batteries because of their higher lithium storage capacity (up to 991 mA h g−1 for a Li4.4Sn composition). However, due to dramatic volume expansion (up to approximately 300%) during the charge/discharge cycling, the Sn-based electrode provides only poor cycle life caused by its mechanical disintegration.1,2Downscaling the size of the material is one approach of choice to overcome this issue by buffering these expansion/contraction processes.3,4 However to achieve higher conductivity between the grains without the loss of mechanical properties, several strategies associated with electrode formulation, embedding and processing have been used.5 The Sn/C based composite electrode, with a high binder content (to maintain adhesion to the current collector and cohesion within the composite), is currently required to achieve good electrochemical performances.6,7 Likewise considerable interest has also been given to intermetallic Sn-based materials, where an inactive metal M vs. Li+/Li was used to modulate the volume change (e.g. M = Cu, Ni, Co, Fe, etc.).8–11
Instead of the composite electrode, the use of a pure metallic Sn electrode could be employed by combining nanostructuration with a thin film approach.12,13
Such electrodes can be obtained more easily by an electrodeposition process that uses an electric field to reduce ionic species onto a specific substrate. Typically, the deposition of metallic species can be performed directly on a current collector with the advantages that tuning the experimental conditions (i.e. solvent, electrode substrate, applied potential or current density, metallic salt precursor, additives, working temperature, etc.) permits the modulation of the morphology of the deposit.14
Henceforth, electrodeposition in ionic liquid (IL) media is of great interest owing to their wide electrochemical potential window stability and high deposition current efficiency and furthermore, compared to the conventional aqueous electrolyte the deposit does not suffer from H2 evolution and metal oxide formation.15,16
It has already been demonstrated that Sn can be electrodeposited from various IL electrolytic solutions,17 among which imidazolium18 and pyrrolidinium19 based ionic liquid solutions are most often used. Electrodeposition of Sn has also been achieved from an IL mixture with AlCl3,20,21 or ZnCl2,22 or even in deep eutectic solvents.23
Even if experimental deposition conditions modulate the morphology, the thickness, and the nanostructuration of the deposited layer, in this kind of synthesis, they are also dramatically influenced by the choice of the anion/cation combination of the IL.19,24–27 Indeed the physicochemical properties of the solvent (conductivity, solubility, viscosity) impact the deposition potentials and the electrodeposition mechanism. In the case of the Sn deposit, some studies have already underlined the influence of the anion24,26–29 on the viscosity and stabilization of the precursor tin species from one part. From another part, the influence of the ionic liquid cation on viscosity and likely its different adsorption/interactions with the substrate or the nuclei was also demonstrated.26–28 Different complexes of Sn2+ with various ILs have been identified by infrared spectroscopy, also underlining that both the anion and cation of the IL play a role in the deposition process.26
One of the main drawbacks when using ILs for Sn electrodeposition is the low solubility of the generally used halide precursor salt (SnCl2).30 Moreover, the anhydrous salt should be privileged rather than its stable hydrated form (i.e. SnCl2·2H2O) since water is undesired in the electrolytic media. Al-Salman et al.28 showed that the liquid (but very hygroscopic) solution of SnCl4 could also be used. Otherwise, when using SnCl2, due to its strong donor ligand properties [DCA−] (dicyanamide), anion based ILs were demonstrated to provide the highest solubility of this metal salt precursor,31–33 and therefore it has been thoroughly studied for Sn electrodeposition. The [DCA−] anion is generally associated with the [EMIm+] (1-ethyl-3-methylimidazolium) cation because this IL has a low viscosity and high conductivity.26,27,31
Therefore, ILs with a [TFSI−] (bis(trifluoromethanesulfonyl)imide) anion are generally preferred because they are known for their low hydrophilicity and hence low water uptake compared to the [DCA−] anion, low viscosity and good conductivity. But due to the fact that [TFSI−] is a non-coordinating anion, such ILs suffer from low solubility of halide salts. In one of our previous studies, to overcome this issue, we had used anodic electrodissolution of a metallic Sn wire to introduce the desired amount of Sn2+ in the solution.27 One of the additional benefits of this method was that neither halides nor other counter ions were introduced in the electroplating bath. Therefore, the electrogenerated Sn2+ cations could only complex with the anion of the IL used.
In the present study, the [EMIm+][TFSI−] IL was used to prepare solutions incorporating Sn(TFSI)2 salt, as plating solutions to electrodeposit Sn nanostructures. The salt Sn(TFSI)2 was chosen because of its good solubility in ILs composed of the same counter-anion. Sn nanostructures obtained directly on the current collector (active copper substrate), when varying electrodeposition conditions (duration, potential, concentration of Sn precursor), were shown to influence the electrochemical performances (charge/discharge capacity and cycling stability) of such a synthesized binder-free negative electrode.
Experimental
Chemicals
1-Ethyl-3-methylimidazolium bis(trifluoromethanesulfonyl)imide ([EMIm+][TFSI−]), 99.5% and the electrolyte 1 M lithium hexafluorophosphate in ethylene carbonate![[thin space (1/6-em)]](https://www.rsc.org/images/entities/char_2009.gif) :ethyl methyl carbonate (1:1 vol%) with 2 wt% fluoroethylene carbonate were obtained from Solvionic. Sn(II) bis(trifluoromethylsulfonyl)imide (Sn(TFSI)2) was obtained from Alfa Aesar, and acetonitrile (ACN), HPLC grade 99.9%, was obtained from Sigma-Aldrich.
:ethyl methyl carbonate (1:1 vol%) with 2 wt% fluoroethylene carbonate were obtained from Solvionic. Sn(II) bis(trifluoromethylsulfonyl)imide (Sn(TFSI)2) was obtained from Alfa Aesar, and acetonitrile (ACN), HPLC grade 99.9%, was obtained from Sigma-Aldrich.
All the chemicals were used as received and stored in a glove box filled with argon (H2O and O2 content <1 ppm).
Preparation and electrochemical characterization of Sn electrodes
All electrochemical measurements were performed in the glove box filled with argon (H2O and O2 content <1 ppm). A three-electrode electrochemical cell controlled by a potentiostat (PAR 273A) was used. Cu (A = 0.785 cm2) or Mo (A = 0.503 cm2) foils were used as the working electrode (they were cleaned with 1 M H2SO4 solution, rinsed with water and dried prior to use). The counter electrode was a Pt wire and a Sn bar was used as the reference electrode.Cyclic voltammetry (CV) curves were recorded at different scanning rates (0.005–0.200 V s−1) in an electrochemical window between −0.6 and +0.4 V vs. Sn2+/Sn.
The electrodeposition of Sn was performed potentiostatically at −0.3 V vs. Sn2+/Sn for a given duration. After the deposition, the samples were thoroughly cleaned in the glove box to avoid oxidation of the surface with acetonitrile to remove all the ILs present on the surface of the electrode.34
Characterization methods
X-ray diffraction (XRD) was performed using a Rigaku Ultima IV X-ray diffractometer with Cu Kα radiation (λ = 1.54059 Å) with a scan rate of 0.1° min−1 between 10° and 80° (2θ).Scanning Electron Microscopy (SEM) measurements were performed with a SEM-FEG ZEISS Ultra 55 equipped with or coupled to a Bruker QUANTAX EDS analysis system.
The microstructure of the Sn-based electrode was examined with transmission electron microscopy (TEM). Two types of TEM samples were prepared. The first one was obtained by scrapping the electrode surface and further depositing the material together with ethanol on a holey Ni carbon grid. In order to investigate the substrate/film interface and possible interdiffusion, cross-section samples were prepared by focused ion beam (FIB) techniques in a Helios NanoLab 660FIB. Electron diffraction (ED) and high resolution TEM (HRTEM) experiments were performed on a Tecnai G2 30 UT microscope operated at 300 kV and having a 0.17 nm point resolution. High angle annular dark field scanning TEM (HAADF-STEM) imaging and energy dispersive X-ray spectroscopy (EDX) elemental mapping were recorded on a double aberration corrected JEM ARM200F Cold FEG electron microscope operated at 200 kV and equipped with a large solid-angle CENTURIO EDX detector.
Electrochemical characterization
The electrochemical performances of negative electrode materials in Li-ion batteries of the as-prepared Sn-based electrodes were determined with CR2032-type coin cells. The electrolyte was 1 M LiPF6 dissolved in a mixture of ethylene carbonate (EC) and ethyl methyl carbonate (EMC) (1:1 vol%) with 2 wt% of fluoroethylene carbonate (FEC). The cells were assembled with lithium metal as the anode and were tested in the voltage range of 2.0–0.05 V vs. Li+/Li at different current densities.
Results and discussion
Cyclic voltammetry study using inert (Mo) and reactive (Cu) electrodes
A solution containing Sn(TFSI)2 solubilized in [EMIm+][TFSI−] was characterized to investigate the electrochemical behaviour using two different working electrodes that are copper and molybdenum. Cu is commonly used as a current collector for negative electrode materials. It is, therefore, an interesting substrate for Sn electrodeposition as it allows to prepare an electrode ready to be used in a lithium cell. However, it can form alloys with Sn at room temperature which makes it a reactive substrate/electrode.35–37 On the other hand, Mo does not form alloys with Sn and is therefore a non-reactive substrate suitable to characterize the electrochemical behaviour of Sn2+ in solution.Cyclic voltammetry was used to characterize the electrochemical properties of a 25 mM solution of Sn(TFSI)2 in [EMIm+][TFSI−]. Fig. 1 presents the cyclic voltammograms obtained using Mo and Cu as working electrodes at a scan rate of 0.05 V s−1 starting from the open current potential (EOCP) toward cathodic and reversed anodic sides. The potential window was −0.6 to +0.4 V which is within the electrochemical stability window of the [EMIm+][TFSI−] ionic liquid (ESI, Fig. S1†) The EOPC was around +0.2 V. In both electrode materials, the shape of the reduction peak is characteristic of an electrodeposited solid that is insoluble.38
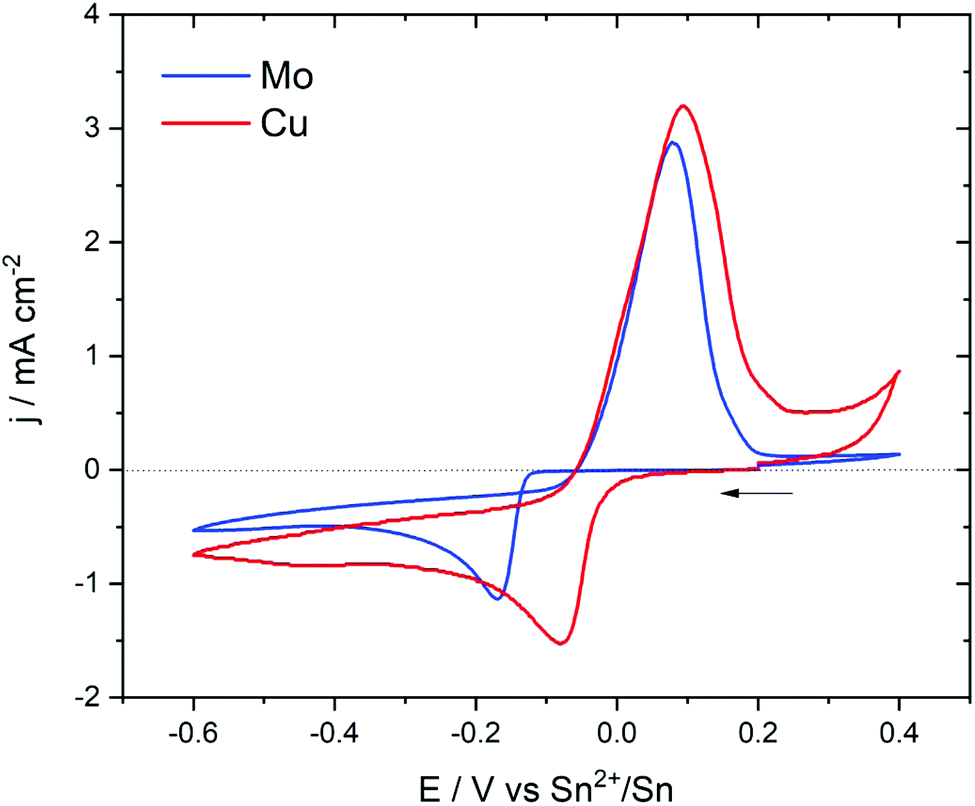 | ||
| Fig. 1 Cyclic voltammetry of 25 mM Sn(TFSI)2 in [EMIm+][TFSI−] on Cu and Mo electrodes at a scan rate of 0.05 V s−1. | ||
On the Mo electrode, a cathodic peak was observed at −0.17 V vs. Sn2+/Sn and was assigned to the reduction of Sn2+ to Sn0. On the reverse potential scan, Sn was re-oxidized at around +0.10 V. The current loop during the cathodic and the anodic scan indicated that the electrodeposition of Sn into Mo required an overpotential to initiate nucleation and growth, as already observed in diverse ILs.19,27
On the Cu electrode, the reduction peak appeared at a potential of −0.08 V, which was higher than that observed in the Mo electrode. Moreover, the loop feature observed in the case of Mo was absent here. This meant that the Cu electrode did not require an overpotential to initiate the growth of Sn due the interaction between Sn and the substrate. After the first reduction peak, the current still decreased smoothly which might indicate the occurrence of other chemical reactions coupled to the primary electrochemical process and/or the formation of other compositions of Sn–Cu alloys. The occurrence of these additional reactions was also suggested by the ratio of the total anodic to cathodic charge (Qa/Qc) which was lower than unity indicating that the deposited material was not totally electrochemically removed during the positive scan.
Cyclic voltammetry was performed at different scan rates. On the Mo electrode (Fig. 2a), an increase in the scan rate led to an increase in the over-potential. In contrast, the oxidation peak remained relatively unchanged. Due to the overpotential electrocrystallisation, it was difficult to compare and interpret the variation of ΔEp = Epa − Epc in terms of reversibility or irreversibility of the reaction.
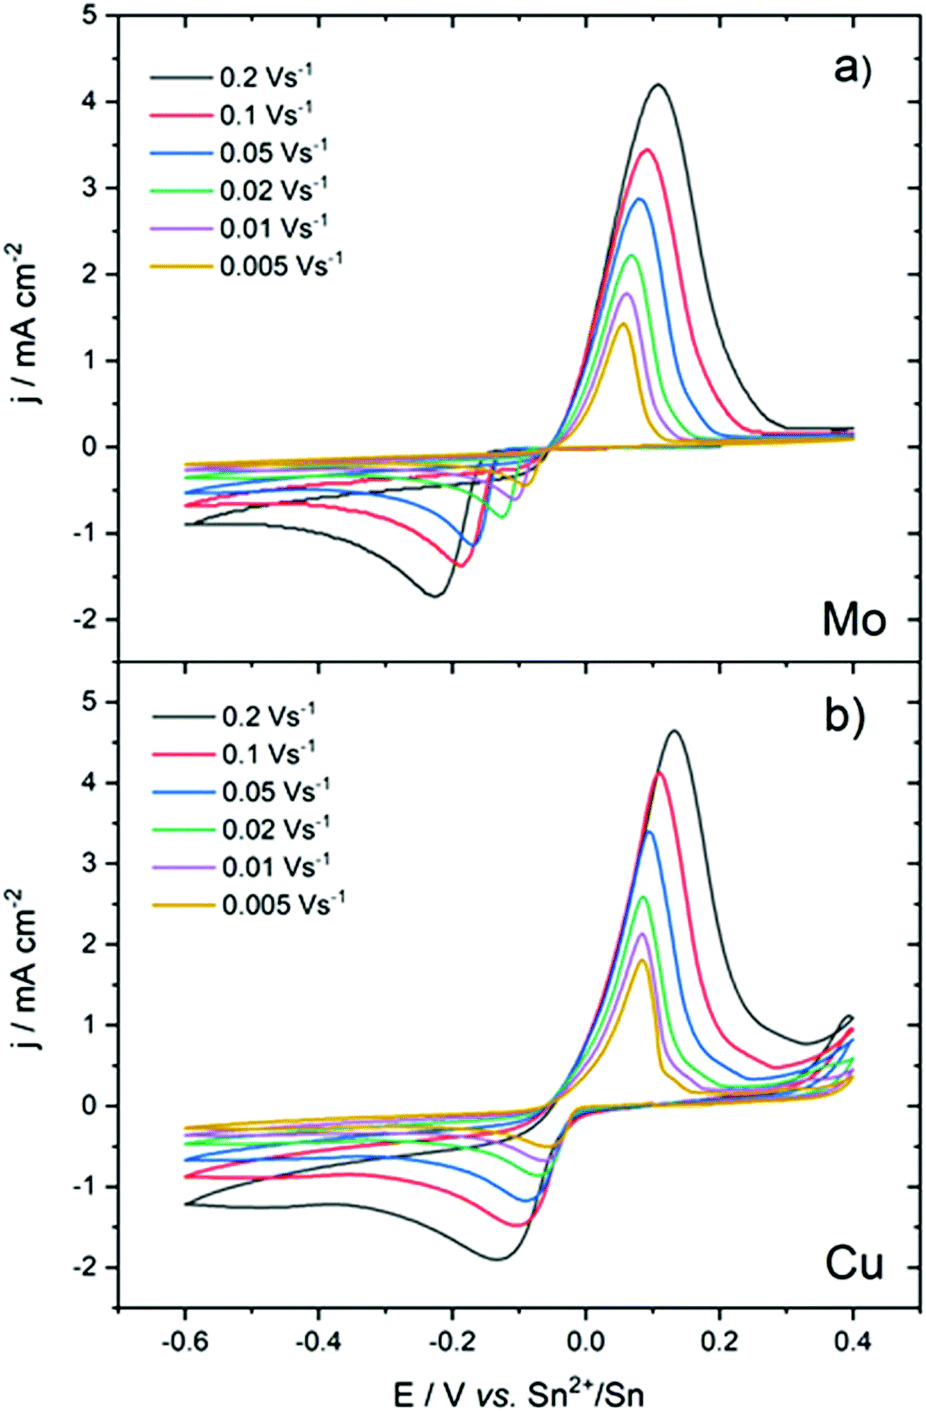 | ||
| Fig. 2 Evolution of the cyclic voltammograms of a 25 mM Sn(TFSI)2 in [EMIm+][TFSI−] solution at different scan rates on (a) Mo and (b) Cu electrodes. | ||
On the Cu electrode (Fig. 2b), the reduction peak potential did not vary significantly with an increasing scan rate. For all scan rates, the reduction current started at the equilibrium potential of the redox couple. The overvoltage at the zero-crossing, η0 = −0.05 V, of backward curves was close to its theoretical value predicted for reversible systems.39,40
The CVs, overall, indicated an electrochemical behaviour largely influenced by the nature of the working electrode. However, a linear relationship between the cathodic peak current density and the square root of the scan rate (Ipc = f(v1/2)), in Mo and Cu electrodes, indicated that the reduction of Sn2+ was governed by diffusion-controlled processes8,41,42 (Fig. S2†) as follows:
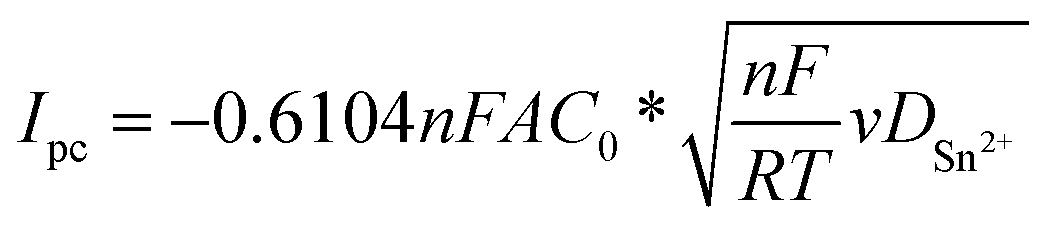 | (1) |
The calculated diffusion coefficient of Sn2+ species in [EMIm+][TFSI−] at 298 K in the Mo electrode was approximately 1.61 × 10⁻⁸ cm2 s−1. DSn2+ in [EMIm+][TFSI−] is in the same order of magnitude than that reported in [EMIm+][BF4−], [EMIm+][TfO−],29 and [BMP+][TFSI−].19,30 However, it is lower than those determined in [EMIm+][DCA−] and [BMP+][DCA−],27,29,30 probably due to higher viscosity for [EMIm+][TFSI−] that induced a lower mobility of Sn2+. Moreover, because the coordination state of Sn2+ is modified by the counter ion solvation force of the ionic liquid anion versus the counter-ion of the Sn precursor, different solvation environments influencing Sn2+ mobility are expected.
Electrodeposition and characterization of deposited solids
To better understand the reactivity of Sn2+ on the Cu electrode, a cathodic deposition was performed at −0.3 V, a potential located after the reduction peak, in the mass-transfer controlled region for different duration times (5 min, 30 min, 1 h and 2 h). In such experiments, the mass of the deposited solid scales linearly with the time of electrodeposition (Fig. S3†). In general, the use of ILs as electrolytes prevents the occurrence of side reactions and therefore allows high efficiency to be obtained.15 Increasing the duration time led to an increasing amount of deposited solids as revealed by the colour changes of the substrate going from black for lower mass to bright metallic for higher deposited mass (Fig. S4†). Moreover, all samples showed good adhesion to the substrate.XRD measurements were performed on the deposited solids obtained at different duration times (Fig. 3). Overall, the XRD patterns of the electrodeposited solids could be indexed with two phases exhibiting Bragg peaks characteristic of β-Sn (space group: I41/amd) and η-Cu6Sn5 (space group: P63/mmc). Prolonging the duration time led to an intensity increase of the [200] and [101] lines of β-Sn. At t >1 h, β-Sn became the predominant phase suggesting that η-Cu6Sn5 was formed at the early stage of the deposition and then, once Cu and Sn could no longer interdiffuse, β-Sn started to form. This was confirmed by energy-dispersive X-ray (EDX) spectroscopy measurements and the associated Sn/Cu ratio which showed that increasing the deposition time led to increasing and decreasing contents of Sn and Cu, respectively (Fig. S5†).
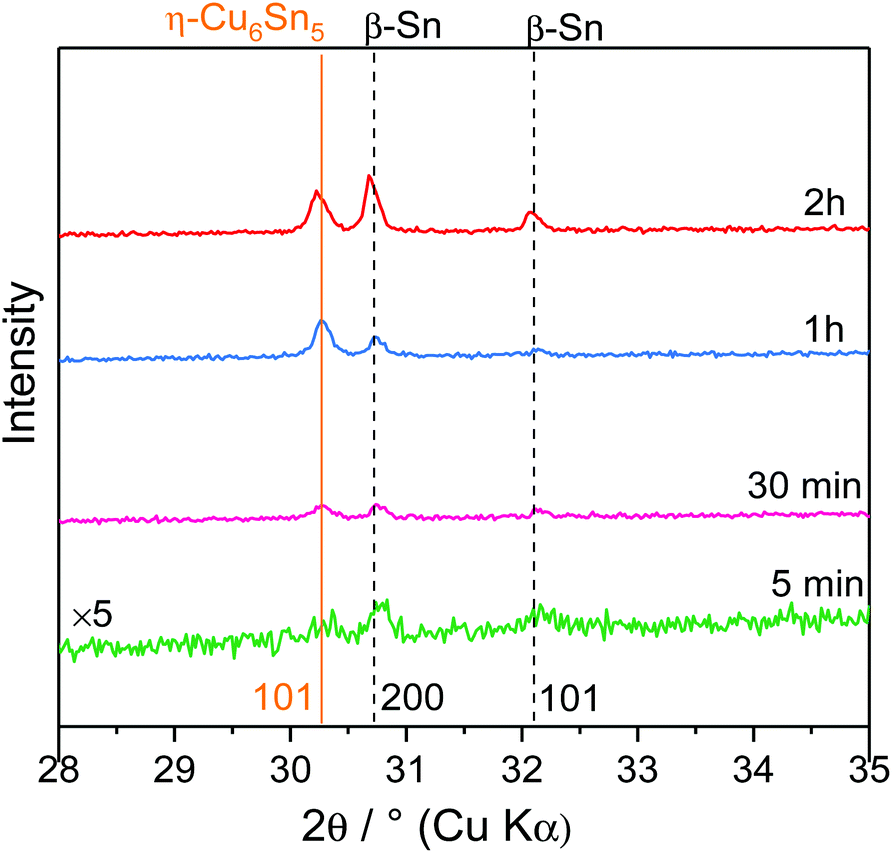 | ||
| Fig. 3 XRD patterns performed on electrodeposited samples obtained at different deposition times. | ||
To extend the comprehension on the formation of an Cu–Sn alloy, an FIB cross section TEM sample of a Cu electrode was prepared on which a solid was electrodeposited over 30 min. The HAADF-STEM image of the corresponding cross section is shown in Fig. 4a. It shows that the electrodeposited solid was not uniformly attached to the Cu substrate and was quite uneven at the nanoscale level. The high resolution HAADF-STEM image (Fig. 4b†) was obtained on a single [001] oriented grain and allowed us to identify the η-Cu6Sn5 phase which was further confirmed by the corresponding FT pattern. In Fig. 4c, the high-resolution HAADF-STEM image of the Cu/deposited solid interface did not evidence any epitaxial growth between the substrate and the deposited solid. This suggested that Cu and Sn interdiffused to form the η-Cu6Sn5 phase. EDX elemental mappings shown in Fig. 4d revealed that Sn was present both at the surface of the Cu electrode and within larger grains, i.e., around 200 nm. The HAADF-STEM image and Cu K mapping clearly showed the occurrence of the attachment point from which these large particles were growth. This highlighted the diffusion of Cu coming from the substrate.
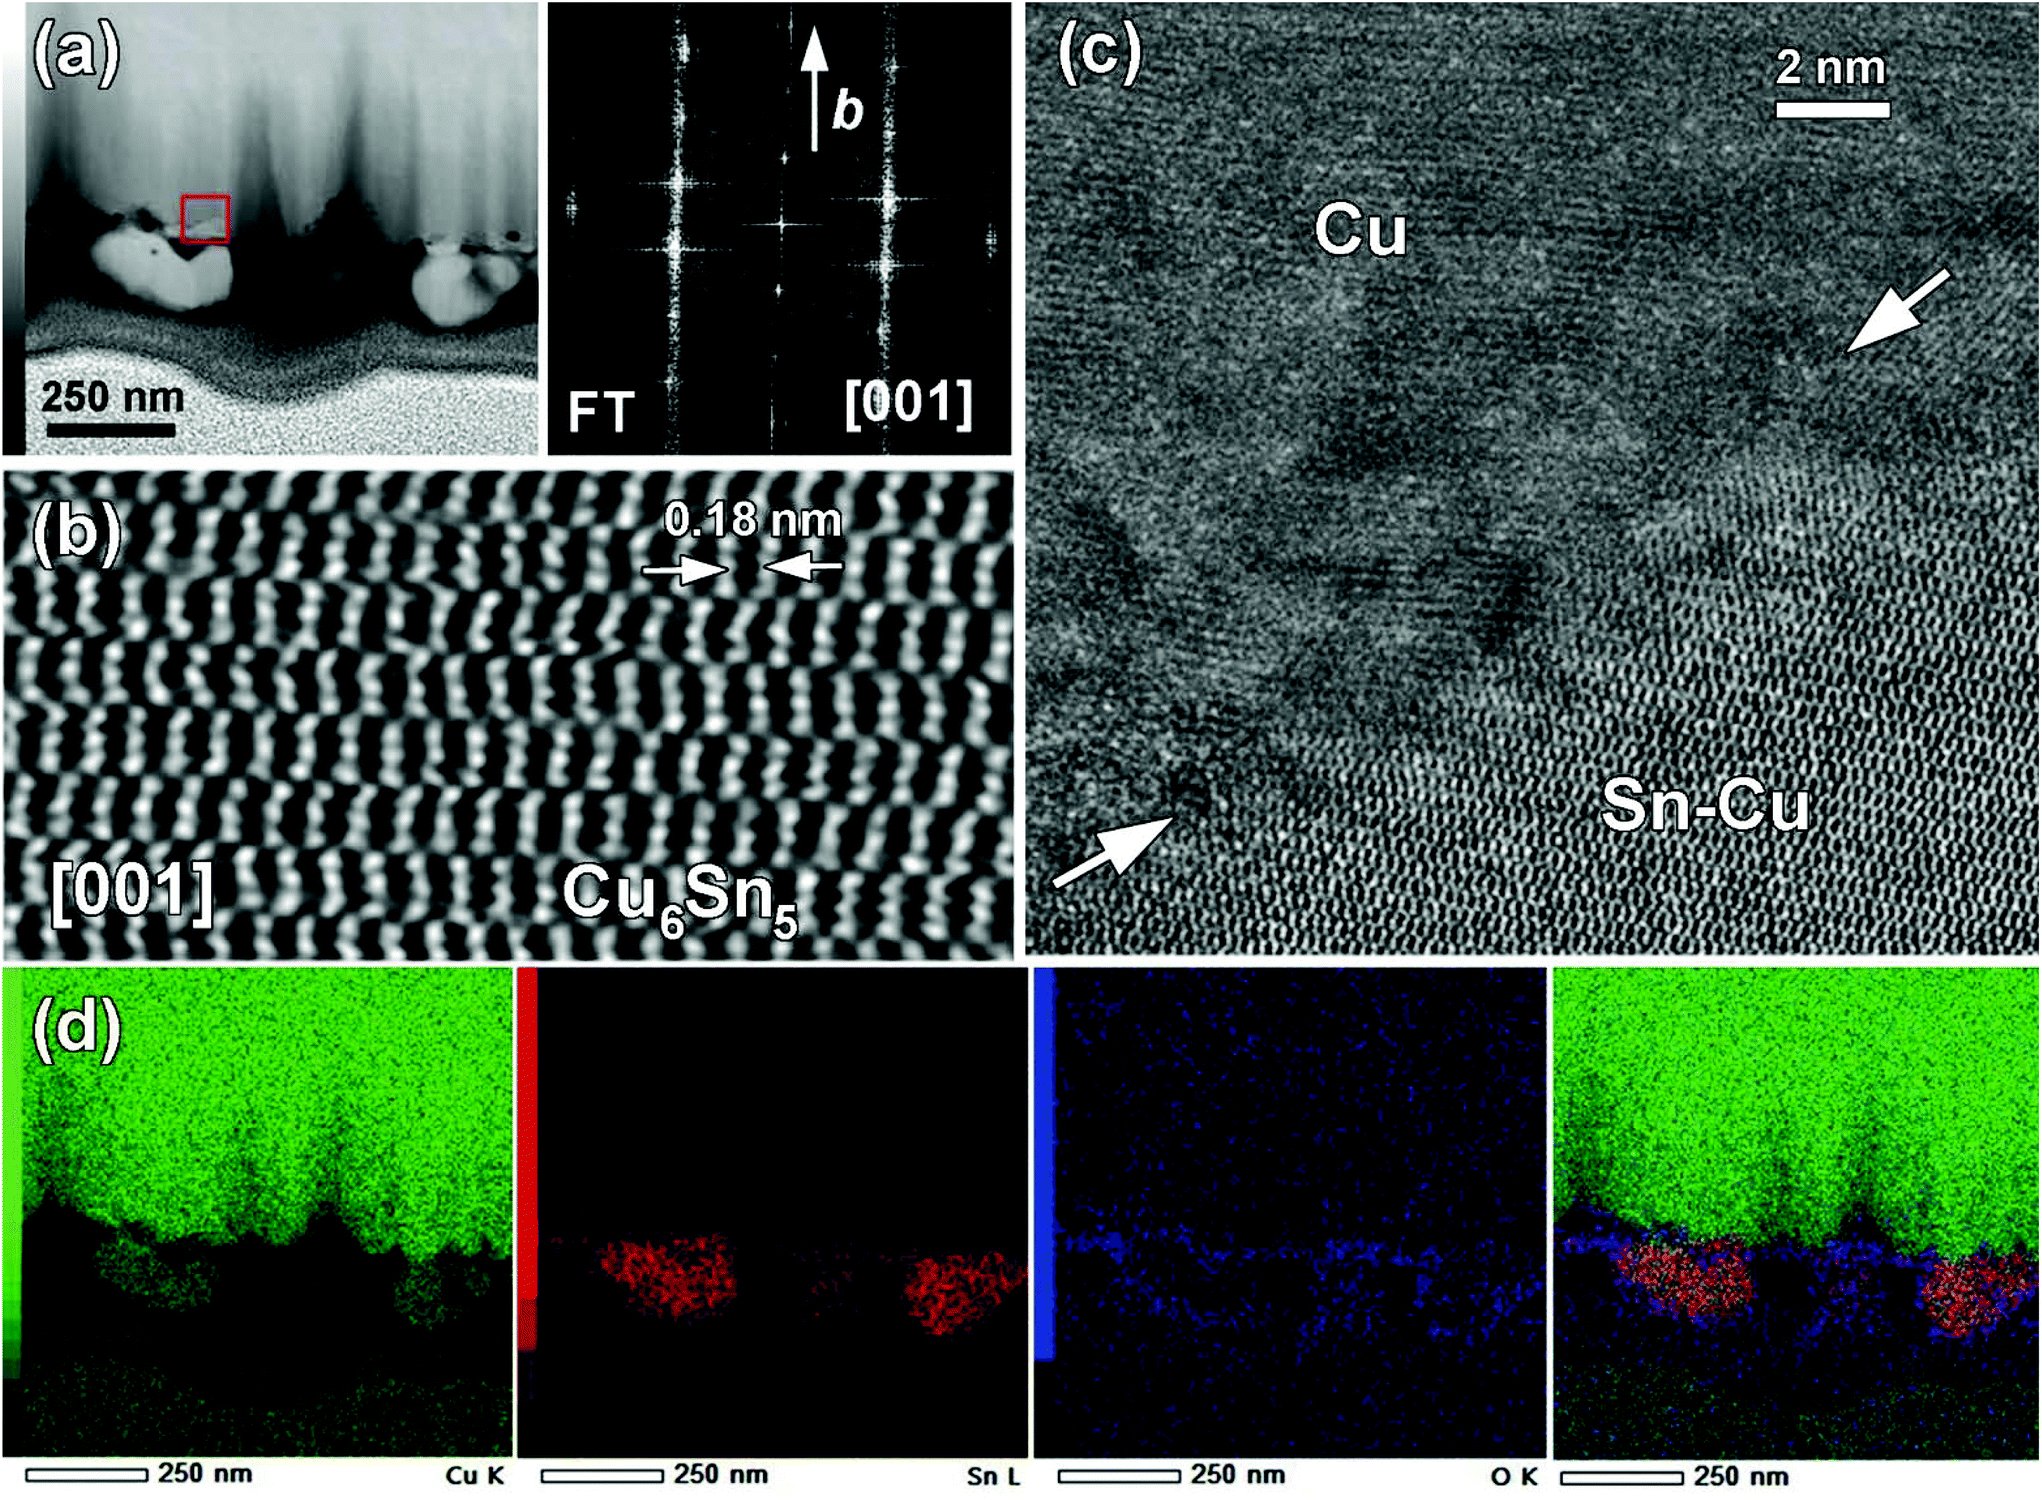 | ||
| Fig. 4 (a) Low magnification HAADF-STEM image of FIB cross section of a Cu electrode on which a solid was electrodeposited over 30 min. (b) High resolution [001] HAADF-STEM image of single grain showing the η-Cu6Sn5 phase and the corresponding FT pattern given above. (c) The HAADF-STEM image showing the interface between the Cu electrode and electrodeposited solid marked in (a) by a red square (arrows). (d) EDX elemental mapping of Cu K (green), Sn L (red), O K (blue) and overlaid colour map. | ||
The morphology at the particle level was investigated by HAADF-STEM imaging and EDX mapping on particles obtained by scrapping the surface of the Cu electrodes. Typical examples of TEM images along with EDX mapping of the particles observed are shown in Fig. 5a. For all samples, we observed particles featuring two different sizes, small ones in the range of 3–15 nm and larger ones with sizes ranging from 100–300 nm after 5 min, 200–400 nm after 30 min, 300–1000 nm after 1 h and 200–800 nm after 2 h. EDX mapping performed on the samples obtained after 5 min and 2 h of deposition revealed the presence of both Sn and Cu at the particle level. In the case of 5 min deposition, we observed generally a homogeneous distribution of Sn and Cu, in agreement with the predominant formation of the η-Cu6Sn5 phase. However, small areas of the Sn–O phase could also be observed. In the case of 2 h deposition, we observed Cu and Sn separation. While Sn was present all over the particle, Cu was not (see ESI Fig. S6† for other examples), which was in agreement with the formation of β-Sn as shown by XRD analysis. The formation of two phases was also confirmed by EDX mapping performed on a cross section for a sample prepared for 2 h (Fig. 5b).
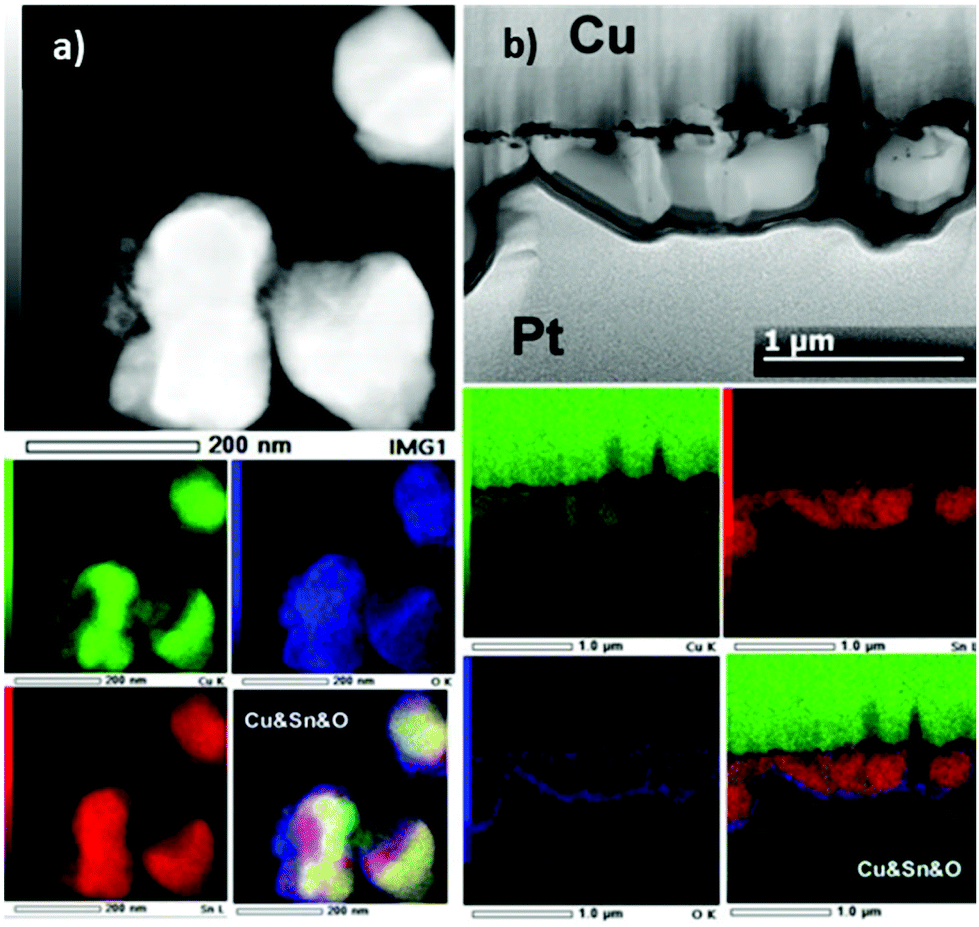 | ||
| Fig. 5 (a) HAADF-STEM image of the particles obtained by scrapping the electrode surface obtained on the electrodeposited solids for 5 min and the corresponding EDX elemental mapping of Cu K (green), Sn L (red), O K (blue) and overlaid colour image. (b) The HAADF-STEM image of the FIB sample of a Cu electrode on which a solid was electrodeposited over 2 h and the corresponding EDX elemental mapping of Cu K (green), Sn L (red), O K (blue) and overlaid colour image. | ||
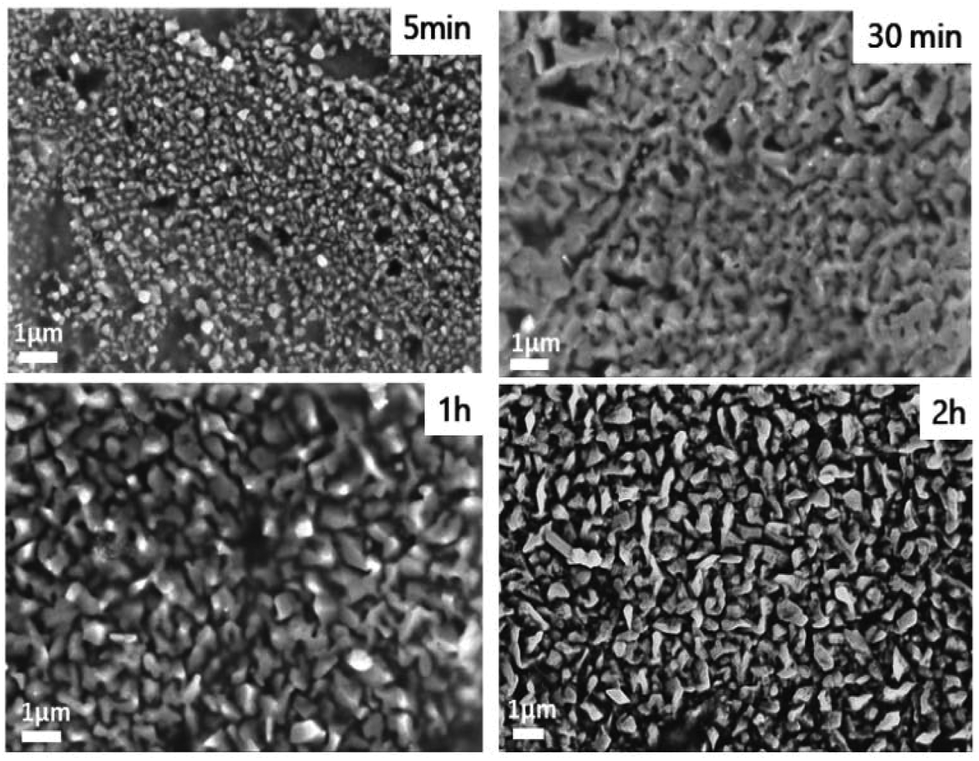
Scanning electron microscopy was further used to visualize the upper scale of the particle's organization (Fig. 6). After 5 min of deposition, the solid is composed of nanoparticles. After 30 min and 1 h, a network of interconnected particles was observed. This interconnected organization disappears after 2 h of deposition suggesting a different growth mechanism.
 | ||
| Fig. 6 Scanning electron micrographs of the electrodeposited samples prepared at different duration times. | ||
The occurrence of interconnected particles might be caused by the interdiffusion of Cu and Sn. For a longer duration time, however, Cu atoms cannot reach the top of the deposited surface leaving the growth of Sn particles forming isolated structures.
Electrochemical properties
The electrodeposited solids on the Cu substrate provided electrode materials free of carbon and binder additives. They were directly assembled in coin-type half cells to investigate their properties vs. Li+/Li.The multi-step lithiation–delithiation processes on the Sn electrode3,29,44 as on the Sn based alloy electrode29,45–48 are already well documented, and it has already been concluded that CV profiles and peak potentials are in both cases characteristic of electrodes containing metallic tin. Especially the plateau of potential attributed to the lithiation of Cu6Sn5 arises in the same domain of potential where intermetallic tin–lithium phases prevail. The potentials of the peaks in charge are similar in both cases to the Sn–Li de-alloying process. Comparison of CV curves obtained on electrodes with lower and higher amounts of tin (Fig. S7†) does not permit one to distinguish the composition of the electrode.
Fig. 7 presents the galvanostatic discharge/charge curves obtained on the series of electrodeposited samples. The mass of the active materials determined by the measured current during the electrodeposition process yielded 0.04 mg for 5 min, 0.085 mg for 30 min, 0.15 mg for 1 h and 0.29 mg for 2 h. The cells were cycled between 0.05 V and 2.0 V (vs. Li+/Li) at a current density of 100 mA g−1.
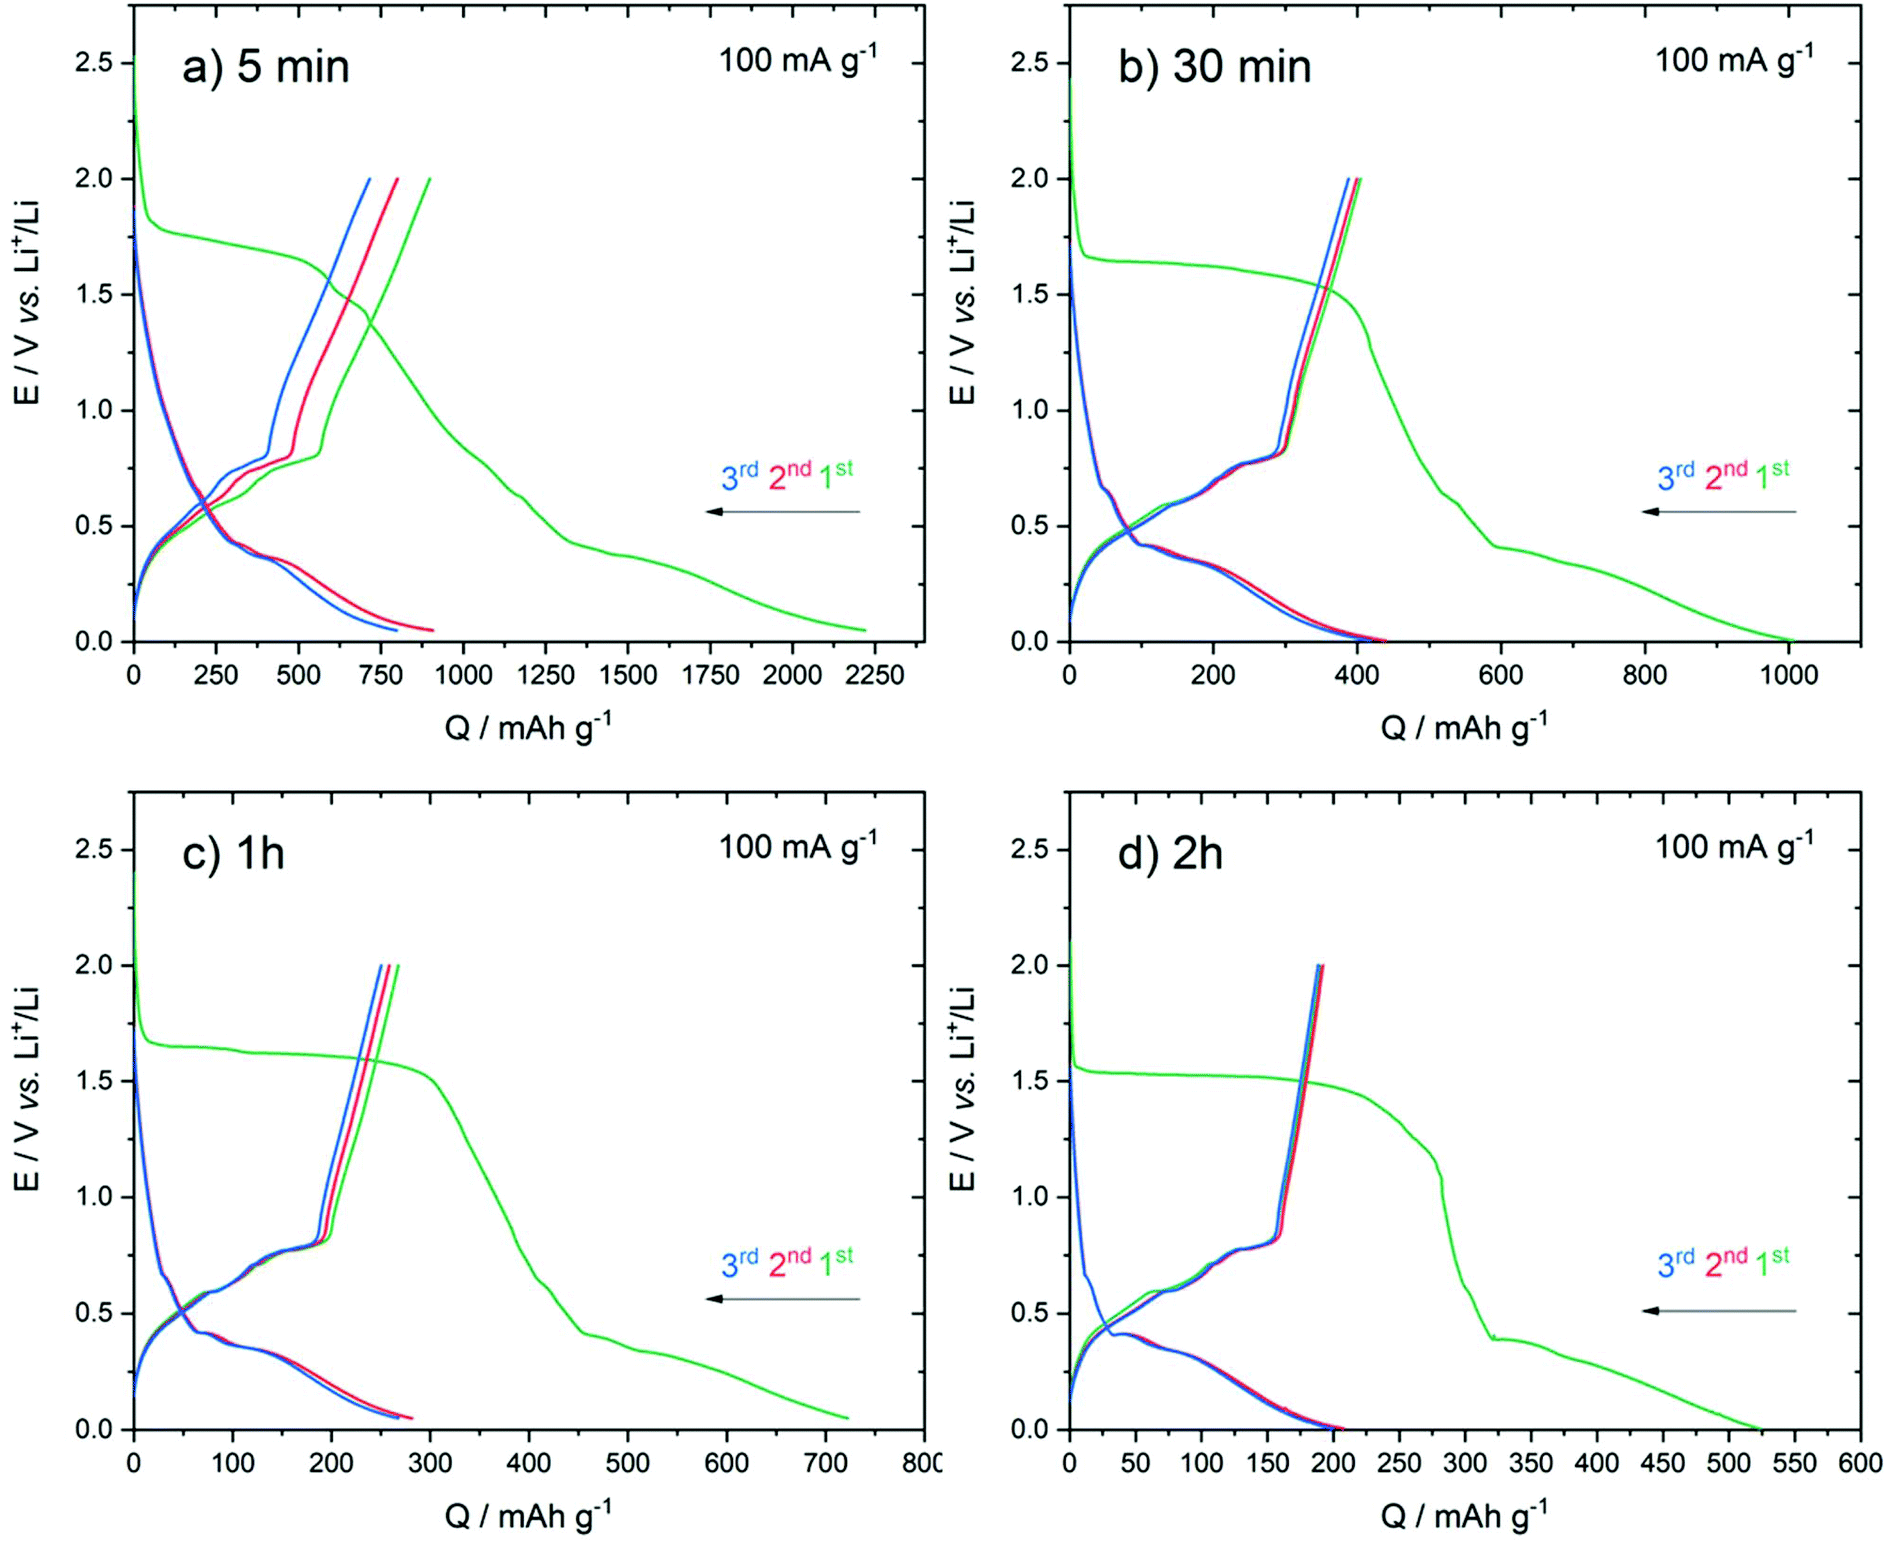 | ||
| Fig. 7 Galvanostatic discharge/charge curves obtained for the first three cycles on the series of electrodeposited samples. (a) 5 min, (b) 30 min, (c) 1 h and (d) 2 h. The cells were cycled under 100 mA g−1 between 0.05 and 2.0 V vs. Li+/Li. | ||
During the first discharge, all the samples featured an irreversible plateau at around 1.5 V vs. Li+/Li. Such a plateau was also observed in other studies and was assigned to the decomposition of the electrolyte (EC degradation) and the formation of the solid electrolyte interface (SEI) layer.49 We noted that the plateau length decreased with the increase of the deposition duration time. The occurrence of isolated nanoparticles obtained after 5 min might favour the decomposition of the electrolyte due to higher surface area.
During the first cycle, all samples presented a large irreversible capacity. The charge capacity decreased with the increase of the deposition duration time with the corresponding values obtained for the first charge of: 900 (5 min), 400 (30 min), 265 (1 h) and 190 (2 h) mA h g−1. For all the samples, the subsequent discharge and charge curves showed a similar shape suggesting that the first cycle allowed the activation of the electrode.
The cells were subsequently left for prolonged cycles under 100 mA g−1. Overall, the capacity slightly decreases upon cycling. The solid prepared for 5 min presents the highest capacity with 510 mA h g−1 measured after 50 cycles. As shown in Fig. 8, the solids prepared at t >5 min present lower capacities.
 | ||
| Fig. 8 Long term cycling of the electrodeposited samples. The cells were cycled under 100 mA g−1 between 0.05 and 2.0 V vs. Li+/Li. | ||
To determine the rate performance of this electrode material, the C rate was increased stepwise from C/10 to 5C and then decreased to C/10, and cycled for 10 cycles at each rate (Fig. S8†). The best performing electrode is the thinnest at any rate, which correlated well with the high increase of lithium storage capacity with the decrease of Sn mass. At a high rate of 5C, 33% of the total capacity is recovered for the thinnest deposit. It was observed that this recovery of the total capacity increases either because the mass of the deposited Sn decreases (25% for the thickest deposit) or because of the improved retention capacity brought by Cu–Sn alloys.
The difference in electrochemical properties for the series of samples can be related to two interconnected factors that are the particle morphology and the composition. A less dense film will allow the better accommodation of the volume expansion experienced during the insertion/de-insertion reactions of lithium. Moreover, as compared to β-Sn, Cu–Sn alloys benefit from a lower volume expansion upon reactions with lithium.
The evolution of the morphology after cycling was compared between the deposited samples obtained after 5 min and 1 h (Fig. 9). The first sample featuring the less dense structure allowed the better accommodation of the volume variation by preserving the porous structure. After cycling, the sample prepared for 1 h became much more compact which probably induced a blocking effect toward the lower part of the electrode.
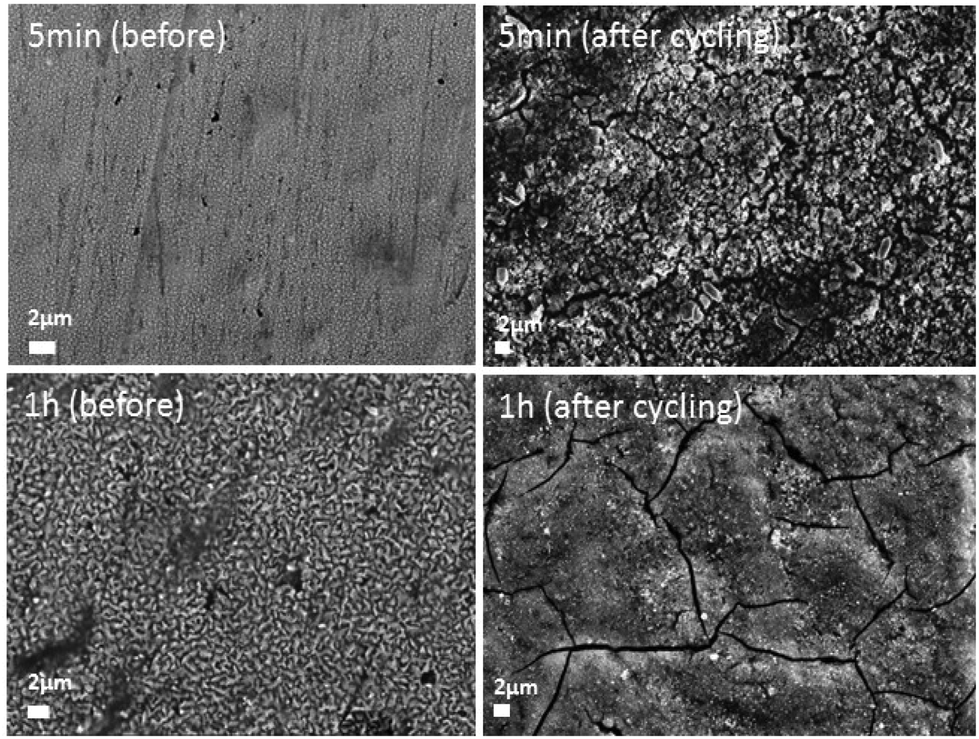 | ||
| Fig. 9 Scanning electron micrographs of the electrodeposited samples (after 5 min and 1 h) on the Cu substrate before and after 50 cycles vs. Li+/Li. | ||
Conclusions
We investigated the electrodeposition of Sn using a soluble Sn precursor based on TFSI− counter ions dissolved in an [EMIm+][TFSI−] ionic liquid. The electrochemical behaviour of the Sn-ionic liquid solution was characterized by cyclic voltammetry using either an inert (Mo) or a reactive substrate (Cu). The diffusion coefficient of Sn2+ in the Mo electrode was found to be 1.61 × 10⁻⁸ cm2 s−1 which is comparable to values obtained with other types of ionic liquids. The electrodeposition onto Cu led to the formation of a Cu–Sn alloy that was the η-Cu6Sn5 phase as identified by X-ray and electron diffraction. By analysing a FIB cross section on the electrodeposited sample, we emphasized the interdiffusion of Cu and Sn atoms without any evidence of epitaxial growth. When prolonging the electrodeposition time, Cu atoms could no longer reach the upper surface favouring the formation of β-Sn. Tuning the reaction duration times enabled tuning the proportions of β-Sn/η-Cu6Sn5. The electrochemical properties of the binder and carbon-free electrodes were investigated in lithium coin cells. Increasing the mass of the deposited sample degraded the capacity and reversibility of the system which was explained by a lower ability to accommodate the volume variation occurring during the electrochemical lithiation/delithiation process. This work is likely to be relevant to other types of elements providing similar salts.Conflicts of interest
There are no conflicts to declare.Acknowledgements
O. L. acknowledges the “Agence Nationale de la Recherche (ANR)” in the framework of the “Investissements d'Avenir” with the reference “ANR-11-EQPX-0020” (GENESIS EQUIPEX) for the financial support that allowed the acquisition of the FIB system (HELIOS Nanolab 600 from FEI) for TEM sample preparations.References
- I. A. Courtney and J. R. Dahn, J. Electrochem. Soc., 1997, 144, 2045–2052 CrossRef CAS.
- Y. Idota, T. Kubota, A. Matsufuji, Y. Maekawa and T. Miyasaka, Science, 1997, 276, 1395–1397 CrossRef CAS.
- M. Winter and J. O. Besenhard, Electrochim. Acta, 1999, 45, 31–50 CrossRef CAS.
- P. G. Bruce, B. Scrosati and J.-M. Tarascon, Angew. Chem., Int. Ed., 2008, 47, 2930–2946 CrossRef CAS PubMed.
- D. Larcher, S. Beattie, M. Morcrette, K. Edström, J.-C. Jumas and J.-M. Tarascon, J. Mater. Chem., 2007, 17, 3759–3772 RSC.
- J. Hassoun, G. Derrien, S. Panero and B. Scrosati, Adv. Mater., 2008, 20, 3169–3175 CrossRef CAS.
- G. Derrien, J. Hassoun, S. Panero and B. Scrosati, Adv. Mater., 2007, 19, 2336–2340 CrossRef CAS.
- H. Groult, H. El Ghallali, A. Barhoun, E. Briot, L. Perrigaud, S. Hernandorena and F. Lantelme, Electrochim. Acta, 2010, 55, 1926–1932 CrossRef CAS.
- O. Mao and J. R. Dahn, J. Electrochem. Soc., 1999, 146, 423–427 CrossRef CAS.
- J. Hassoun, S. Panero, P. Simon, P. L. Taberna and B. Scrosati, Adv. Mater., 2007, 19, 1632–1635 CrossRef CAS.
- K. D. Kepler, J. T. Vaughey and M. M. Thackeray, Electrochem. Solid-State Lett., 1999, 2, 307–309 CrossRef CAS.
- H. Mukaibo, T. Sumi, T. Yokoshima, T. Momma and T. Osaka, Electrochem. Solid-State Lett., 2003, 6, A218–A220 CrossRef CAS.
- A. Lahiri and F. Endres, J. Electrochem. Soc., 2017, 164, D597–D612 CrossRef CAS.
- F. C. Walsh and C. T. J. Low, Surf. Coat. Technol., 2016, 304, 246–262 CrossRef CAS.
- E. Frank, ChemPhysChem, 2002, 3, 144–154 CrossRef.
- A. P. Abbott and K. J. McKenzie, Phys. Chem. Chem. Phys., 2006, 8, 4265–4279 RSC.
- F. C. Walsh and C. T. J. Low, Surf. Coat. Technol., 2016, 288, 79–94 CrossRef CAS.
- M. Morimitsu, Y. Nakahara and M. Matsunaga, Electrochemistry, 2005, 73, 754–757 CAS.
- N. Tachikawa, N. Serizawa, Y. Katayama and T. Miura, Electrochim. Acta, 2008, 53, 6530–6534 CrossRef CAS.
- Y. S. Fung and D. R. Zhu, J. Electrochem. Soc., 2002, 149, A319–A324 CrossRef CAS.
- D. Zhu, H. Sun and Y. Fung, ECS Trans., 2007, 3, 239–248 CAS.
- J.-F. Huang and I.-W. Sun, J. Electrochem. Soc., 2003, 150, E299–E306 CrossRef CAS.
- L. Anicai, A. Petica, S. Costovici, P. Prioteasa and T. Visan, Electrochim. Acta, 2013, 114, 868–877 CrossRef CAS.
- A. Lahiri, G. Pulletikurthi, S. Abedin and F. Endres, J. Solid State Electrochem., 2015, 19, 785–793 CrossRef CAS.
- T.-I. Leong, Y.-T. Hsieh and I.-W. Sun, Electrochim. Acta, 2011, 56, 3941–3946 CrossRef CAS.
- P. Giridhar, A. M. Elbasiony, S. Zein El Abedin and F. Endres, ChemElectroChem, 2014, 1, 1549–1556 CrossRef CAS.
- D. Liu, H. Groult, L. Gaillon, C. Rizzi, N. Soulmi, C. M. Julien, E. Briot and D. Krulic, J. Solid State Electrochem., 2015, 19, 2517–2532 CrossRef CAS.
- R. Al-Salman, H. Sommer, T. Brezesinski and J. Janek, Chem. Mater., 2015, 27, 3830–3837 CrossRef CAS.
- X. Xie, X. Zou, K. Zheng, S. Wang, X. Lu, Q. Xu and Z. Zhou, J. Electrochem. Soc., 2017, 164, D945–D953 CrossRef CAS.
- B. C. M. Martindale, S. E. W. Jones and R. G. Compton, Phys. Chem. Chem. Phys., 2010, 12, 1827–1833 RSC.
- M.-J. Deng, P.-Y. Chen, T.-I. Leong, I.-W. Sun, J.-K. Chang and W.-T. Tsai, Electrochem. Commun., 2008, 10, 213–216 CrossRef CAS.
- D. R. MacFarlane, J. Golding, S. Forsyth, M. Forsyth and G. B. Deacon, Chem. Commun., 2001, 1430–1431 RSC.
- D. R. MacFarlane, S. A. Forsyth, J. Golding and G. B. Deacon, Green Chem., 2002, 4, 444–448 RSC.
- N. Soulmi, D. Dambournet, C. Rizzi, J. Sirieix-Plénet, M. Duttine, A. Wattiaux, J. Swiatowska, O. J. Borkiewicz, H. Groult and L. Gaillon, Inorg. Chem., 2017, 56, 10099–10106 CrossRef CAS PubMed.
- N. N. Acharya and P. G. Mukunda, Metallography, 1988, 21, 137–150 CrossRef CAS.
- S. Fürtauer, D. Li, D. Cupid and H. Flandorfer, Intermetallics, 2013, 34, 142–147 CrossRef.
- D. Li, P. Franke, S. Fürtauer, D. Cupid and H. Flandorfer, Intermetallics, 2013, 34, 148–158 CrossRef CAS.
- H. El Ghallali, H. Groult, A. Barhoun, K. Draoui, D. Krulic and F. Lantelme, Electrochim. Acta, 2009, 54, 3152–3160 CrossRef CAS.
- D. Krulic, N. Fatouros and D. Liu, J. Electroanal. Chem., 2015, 754, 30–39 CrossRef CAS.
- D. Liu, D. Krulic, H. Groult and N. Fatouros, J. Electroanal. Chem., 2016, 775, 91–104 CrossRef CAS.
- D. J. Schiffrin, J. Electroanal. Chem. Interfacial Electrochem., 1986, 201, 199–203 CrossRef CAS.
- T. Berzins and P. Delahay, J. Am. Chem. Soc., 1953, 75, 555–559 CrossRef CAS.
- Y. NuLi, J. Yang and P. Wang, Appl. Surf. Sci., 2006, 252, 8086–8090 CrossRef CAS.
- M. Guo, X. Zhang, W. Meng, X. Liu, G. Wang, Z. Bai, Z. Wang and F. Yang, Solid State Ionics, 2018, 325, 120–127 CrossRef CAS.
- R. Z. Hu, M. Q. Zeng and M. Zhu, Electrochim. Acta, 2009, 54, 2843–2850 CrossRef CAS.
- H. Algul, M. Uysal, M. Toku, S. Ozcan, T. Cetinkaya, H. Akbulut and A. Alp, Int. J. Hydrogen Energy, 2016, 41, 9819–9827 CrossRef CAS.
- G. F. Ortiz, M. C. Lopez, R. Alcantara and J. L. Tirado, J. Alloys Compd., 2014, 585, 331–336 CrossRef CAS.
- P. Antitomaso, B. Fraisse, L. Stievano, S. Biscaglia, D. Aymé-Perrot, P. Girard, M. T. Sougrati and L. Monconduit, J. Mater. Chem. A, 2017, 5, 6546–6555 RSC.
- J.-S. Bridel, S. Grugeon, S. Laruelle, J. Hassoun, P. Reale, B. Scrosati and J.-M. Tarascon, J. Power Sources, 2010, 195, 2036–2043 CrossRef CAS.
Footnote |
| † Electronic supplementary information (ESI) available. See DOI: 10.1039/C8QI00982A |
| This journal is © the Partner Organisations 2019 |