
Synthesis of CuO–CdS composite nanowires and their ultrasensitive ethanol sensing properties†
Nan
Zhang‡
a,
Xiaohui
Ma‡
a,
Yanyang
Yin
a,
Yu
Chen
ab,
Chuannan
Li
a,
Jingzhi
Yin
*a and
Shengping
Ruan
 *a
*a
aState Key Laboratory on Integrated Optoelectronics and College of Electronic Science & Engineering, Jilin University, Changchun 130012, P. R. China. E-mail: yjz886666@163.com
bInstitute of Semiconductors, Chinese Academy of Sciences, Beijing 100083, PR China
First published on 3rd December 2018
Abstract
In this paper, CuO–CdS composites were synthesized by a facile two-step solvothermal method. The composite materials were characterized by a series of systematical measures, such as X-ray diffraction, Fourier transform infrared spectroscopy, X-ray photoelectron spectroscopy, scanning electron microscopy and transmission electron microscopy. Through detailed experiments, it was observed that the shape of the as-prepared materials could be tailored by varying the CuO content in composites. The experimental results manifested that CdS decorated with 0.05 at% CuO presents superior performance including response/recovery speed, detection limit, optimum operating temperature, and sensitivity in comparison with pure CdS. The possible mechanisms of enhanced sensing properties were discussed in detail. At the interface of the two different material surfaces, the capacity of surface-adsorbed oxygen was elevated, which can be attributed to the formation of the p–n heterojunction between CdS and CuO. In conclusion, the functionalization of CuO with CdS may be a promising method to enhance gas-sensing properties.
Introduction
Gas sensors with excellent sensing properties play a vital role in our daily life. They are usually used in toxic-gas alarms,1 automotive cabin air-quality control,2 health care,3 household appliances,4 and so on. Therefore, it is necessary to fabricate reliable and practical gas sensors with high selectivity and sensitivity (e.g., low detection limit, rapid response/recovery). In order to improve the sensing properties of gas sensors, various morphologies of pure phase materials such as nanoparticles,5 nanotubes,6 nanowires,7 nanobelts,8 nanoplates9 and nanospheres10,11 have been synthesized, and lots of achievements in the synthetic methods of nanomaterials have been made. However, it is difficult for pure phase materials to meet people's requirements for detecting gases at low concentration. Therefore methods of forming composite materials are applied in the field of gas sensors. Surface modification is a commonly used method for the formation of composite materials,12 which can alter the charge, functionality, and reaction of the surface by decorating other materials. Meanwhile, it can also improve the physical and chemical stability of the materials.13–15Cadmium sulfide (CdS) is widely used as a material for light detection for its excellent light response. Its application in gas sensors is rare and its gas-sensing performance is not as good as expected due to the low chemical activity and poor electrical conductivity of the sulfide semiconductor. Therefore, discovering a suitable material that can be used to decorate the surface of CdS is necessary to achieve a better performance of gas sensing. Cupric oxide (CuO) is a typical p-type semiconductor with an energy gap of about 1.5 eV and has been widely used in catalysis and gas sensing.16,17 Volanti et al. studied the effects of different morphologies of CuO on gas sensing properties.18 In addition, Deng et al. introduced CuO into TiO2 nanofibers to improve the response of materials.19 According to these studies, it is possible that decorating CuO nanoparticles on the surface of CdS to form p–n junctions could effectively improve the gas sensing properties of CdS.
In this study, CdS nanowires were synthesized by a one-step solvothermal method, which could achieve a fast response/recovery time of less than 1 s as expected. To enhance the performance, CuO–CdS (p–n heterojunction) composites were synthesized by a solvothermal method. Different contents of CuO nanoparticles were grown on the surface of the CdS nanowires, forming p–n heterostructures. As a result, the prepared CuO–CdS composites showed superior gas sensing properties. The CdS composites doped with 0.05 at% CuO showed higher sensitivity, lower optimum operating temperature, and quicker response/recovery speed. Furthermore, the detection limit was decreased. In general, the excellent gas-sensing performance was highly associated with the p–n heterojunction structure.
Experimental
Chemical reagents
All the starting materials (AR grade) including cadmium nitrate (Cd(NO3)2 × 4H2O, Mw = 308.47, Tianjin Yongsheng Fine Chemical Co., Ltd), thiourea (CS(NH2)2, Mw = 76.12, Xilong Chemical Co., Ltd), trihydrate cupric nitrate (Cu(NO3)2 × 3H2O, Mw = 241.6, Guangdong Fine Chemicals Engineering Technology Research and Development Center) and ethylenediamine (NH2(CH2)2NH2, Mw = 60.1, Xilong Chemical Co., Ltd) were used as received without any further purification.Preparation of CdS nanowires
The CdS nanowires were synthesized through a simple solvothermal method. 1.9 g of cadmium nitrate (Cd(NO3)2·4H2O) and 1.4 g of thiourea (SC(NH2)2) were added into 30 ml ethylenediamine solution sonicated for 5 min. Then, the above solution was transferred into a 50 ml Teflon-lined stainless steel autoclave and kept at 180 °C for 48 h. Then the precipitate was separated through centrifugation, and washed with deionized water and ethanol several times. Finally, the yellow precipitate was dried in air at 70 °C.Preparation of CuO–CdS nanocomposites
0.1 mM as-prepared CdS nanowires were dissolved in 24 ml of ethanol solution. Different contents of Cu(NO3)2·3H2O were added into the above solutions with an atomic ratio of Cd/Cu 1000![[thin space (1/6-em)]](https://www.rsc.org/images/entities/char_2009.gif) :1, 1000:5, 10000:1 and 10000:5, respectively. After stirring for 10 min, the above solutions were transferred into 50 ml Teflon-lined stainless steel autoclaves, respectively. Then we maintained the temperature of 200 °C for 24 h. After the precipitates (denoted as 0.1 at% CuO–CdS, 0.5 at% CuO–CdS, 0.01 at% CuO–CdS and 0.05 at% CuO–CdS) cooled down to room temperature naturally, they were separated through centrifugation, and washed several times with deionized water and ethanol. Finally, all samples were dried in air at 70 °C for 10 h.
:1, 1000:5, 10000:1 and 10000:5, respectively. After stirring for 10 min, the above solutions were transferred into 50 ml Teflon-lined stainless steel autoclaves, respectively. Then we maintained the temperature of 200 °C for 24 h. After the precipitates (denoted as 0.1 at% CuO–CdS, 0.5 at% CuO–CdS, 0.01 at% CuO–CdS and 0.05 at% CuO–CdS) cooled down to room temperature naturally, they were separated through centrifugation, and washed several times with deionized water and ethanol. Finally, all samples were dried in air at 70 °C for 10 h.
Characterization
The structure of products was characterized by X-ray diffraction (XRD, Shimadzu XRD-6000, Cu-Kα radiation λ = 1.5418 Å); and the chemical composition of samples was analysed by using an FTIR spectrometer (Nicolet 5PC); valence states and species of elements were obtained by X-ray photoelectron spectroscopy (XPS, VG ESCALAB MK II spectrometer, Mg KR excitation (1253.6 eV)); the morphology of the samples was investigated by scanning electron microscopy (SEM, SHIMADZU SSX-550) and transmission electron microscopy (TEM, JEM-ARM200F).Fabrication and measurement of the gas sensor
The method for fabrication was similar to the previous work.20 Firstly, the as-prepared samples were mixed with deionized water at a ratio of 4:1. They were then ground gently to form a paste. Then the paste was coated on the surface of an alumina ceramic tube with four Pt wires and gold electrodes. Gold electrodes were fabricated by jetting Au paste on ceramic plates through a metal-jetting system (MJ-10, Beijing Elite Tech Co., Ltd, China). Then a Ni–Cr alloy heater was inserted into the ceramic tube to provide operating temperature. Finally, the heater and ceramic tube were welded on the pedestal. The illustration of the sensor is shown in Fig. 1.
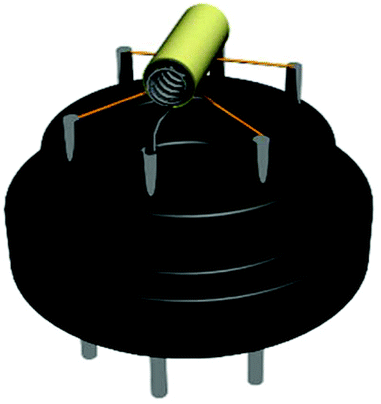 | ||
| Fig. 1 Schematic structure of the completed gas sensor. | ||
The gas sensing properties were measured through a CGS-8 intelligent gas sensing analysis system (Beijing Elite Tech Co., Ltd, China). The response was defined as S = Ra/Rg. Ra represented the resistance of the sensor in air, and Rg was the sensor's resistance in the atmosphere of target gas. The response–recovery time was taken by the sensor changing 90% of the total resistance change.
Results and discussion
Structural and morphological characteristics
The crystalline structures of the as-prepared materials were characterized through XRD. For the diffraction peaks of a pure CdS sample shown in Fig. 2(a), all of them could be seen from the curves, which correspond to the Joint Committee on Powder Diffraction Standards card (JCPDS, no. 41-1049). After the CuO nanoparticles were modified on the surface of CdS nanowires by a hydrothermal method, the peaks can be indexed to cubic CuO (JCPDS card 41-1107). No other diffraction peaks corresponding to impurities were observed, which indicated that the CuO–CdS composites were a mixture of CdS and CuO with high purity. Then, the low-angle XRD patterns in Fig. 2(b) showed the different degrees of phase shift in the diffraction peaks of CuO–CdS composites compared with the standard peak of the (002) crystal surface of the cubic CuO, which may be attributed to the lattice distortion caused by CuO modification on the surface of CdS nanowires. In addition, to further confirm the existence of a Cu-contained compound, characterization of the material was performed in the subsequent process.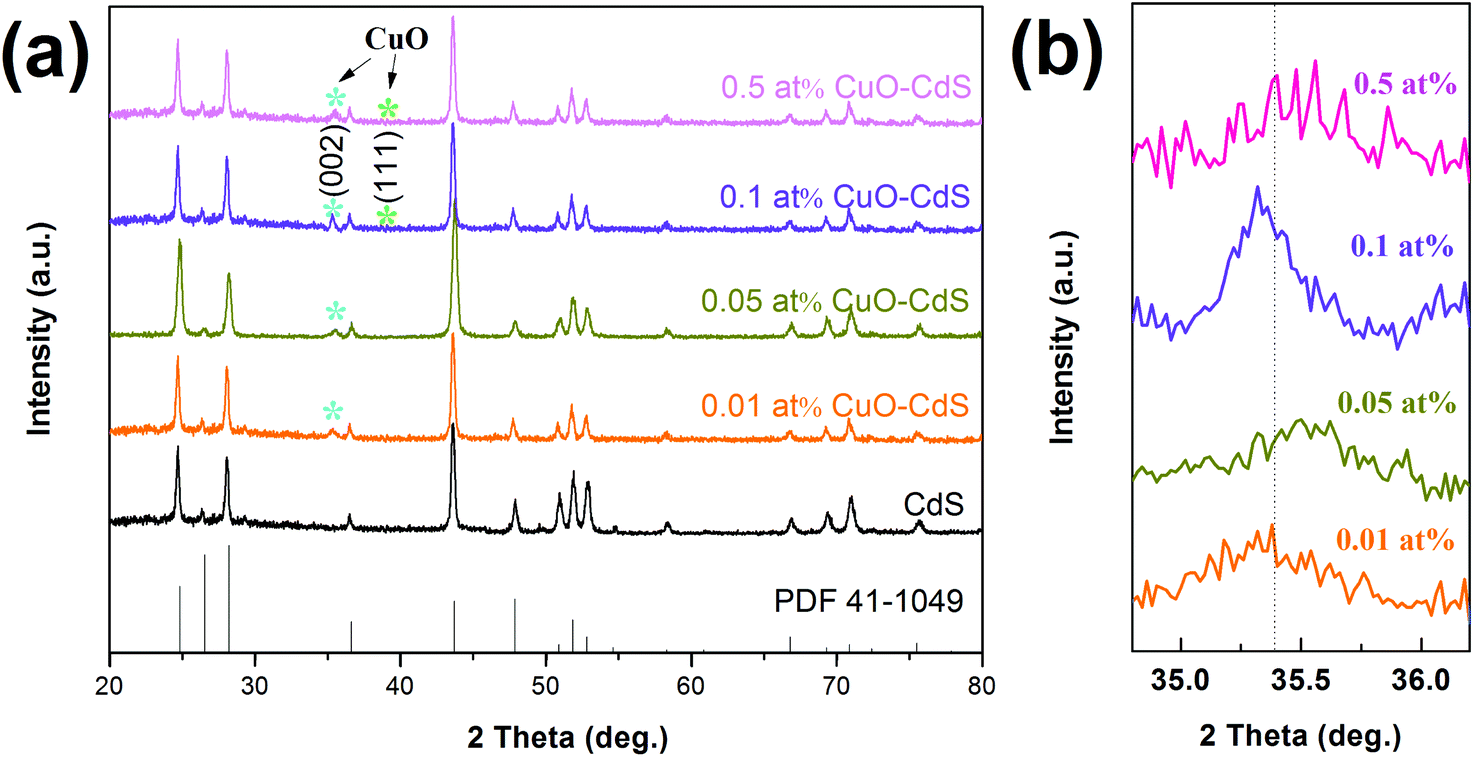 | ||
| Fig. 2 The wide-angle (a) and low-angle (b) XRD pattern of the as-prepared samples. | ||
The FTIR spectrum was recorded to analyze the chemical composition of the samples. The FTIR spectrum in the frequency range (400–4000 cm−1) of nanocrystalline CdS is depicted in Fig. 3. The peaks at 601 cm−1 and 405 cm−1 were induced by the stretching frequency of the Cd–S bond.21,22 The strong interaction of water with CdS was reflected by the peaks at 3368 cm−1 and 1629 cm−1, due to O–H stretching and O–H bending modes, respectively.23 The band at 1401 cm−1 came from aromatic C–C stretches.22 However, the FTIR spectrum did not show the presence of copper, which can be predicted because the content of trihydrate cupric nitrate added in the reaction was very small.
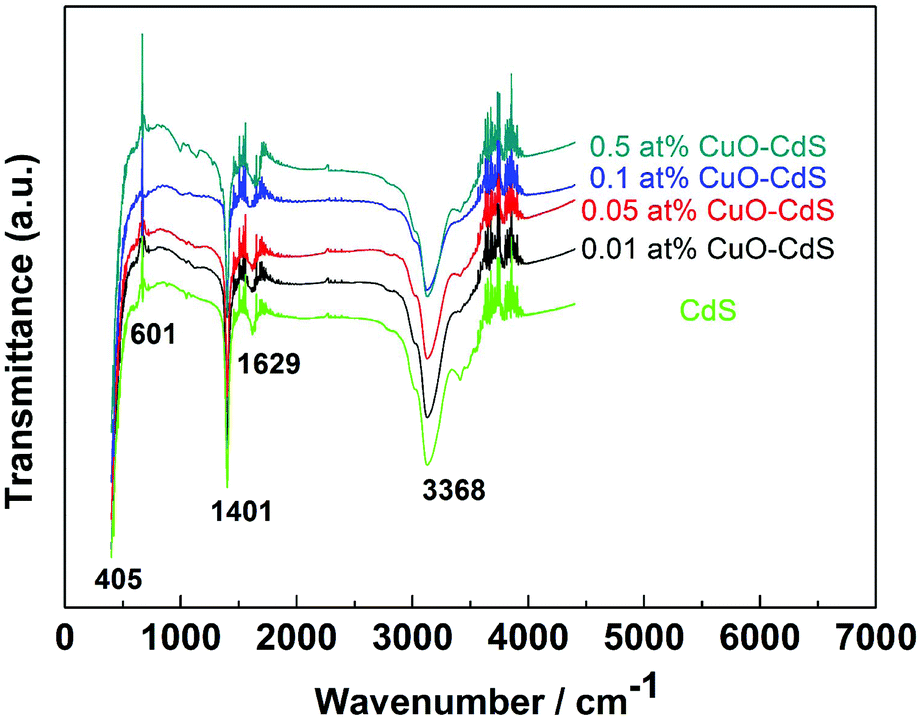 | ||
| Fig. 3 FTIR spectra of the as-prepared samples. | ||
In order to further confirm the existence of the compound containing Cu, the XPS spectra of all samples have been provided in the ESI.† The measured atom ratios of Cu to Cd of the as-prepared samples according to XPS are shown in Table S1.† Taking into consideration the surface decoration of CuO and shallow detecting depth of XPS, it is reasonable that the atom ratio of Cu to Cd detected by XPS is higher than the theoretical one. In addition, it is worth mentioning that for a material with surface decoration, the surface content may be more important than the total content of the decorated component in the sample. Fig. 4 shows the sample of 0.05 at% CuO–CdS. The elements of Cd, S, Cu, and O can be observed clearly in Fig. 4(a–d), respectively. The peaks at 405.3 and 411.8 eV were indexed to Cd 3d5/2 and Cd 3d3/2 regions; the peaks at 162.8 eV and 161.4 eV can be assigned to S 2p regions; the peak of O 1s was at 532.1 eV; and Cu 2p spectra showed the peaks’ positions at binding energies of 936.5 eV and 954 eV. Because the gap energy between Cu 2p3/2 and Cu 2p1/2 was 19.6 eV, the test values were consistent with the theoretical values, so it was corresponding to CuO.24 Therefore, CuO–CdS composites were successfully synthesized.
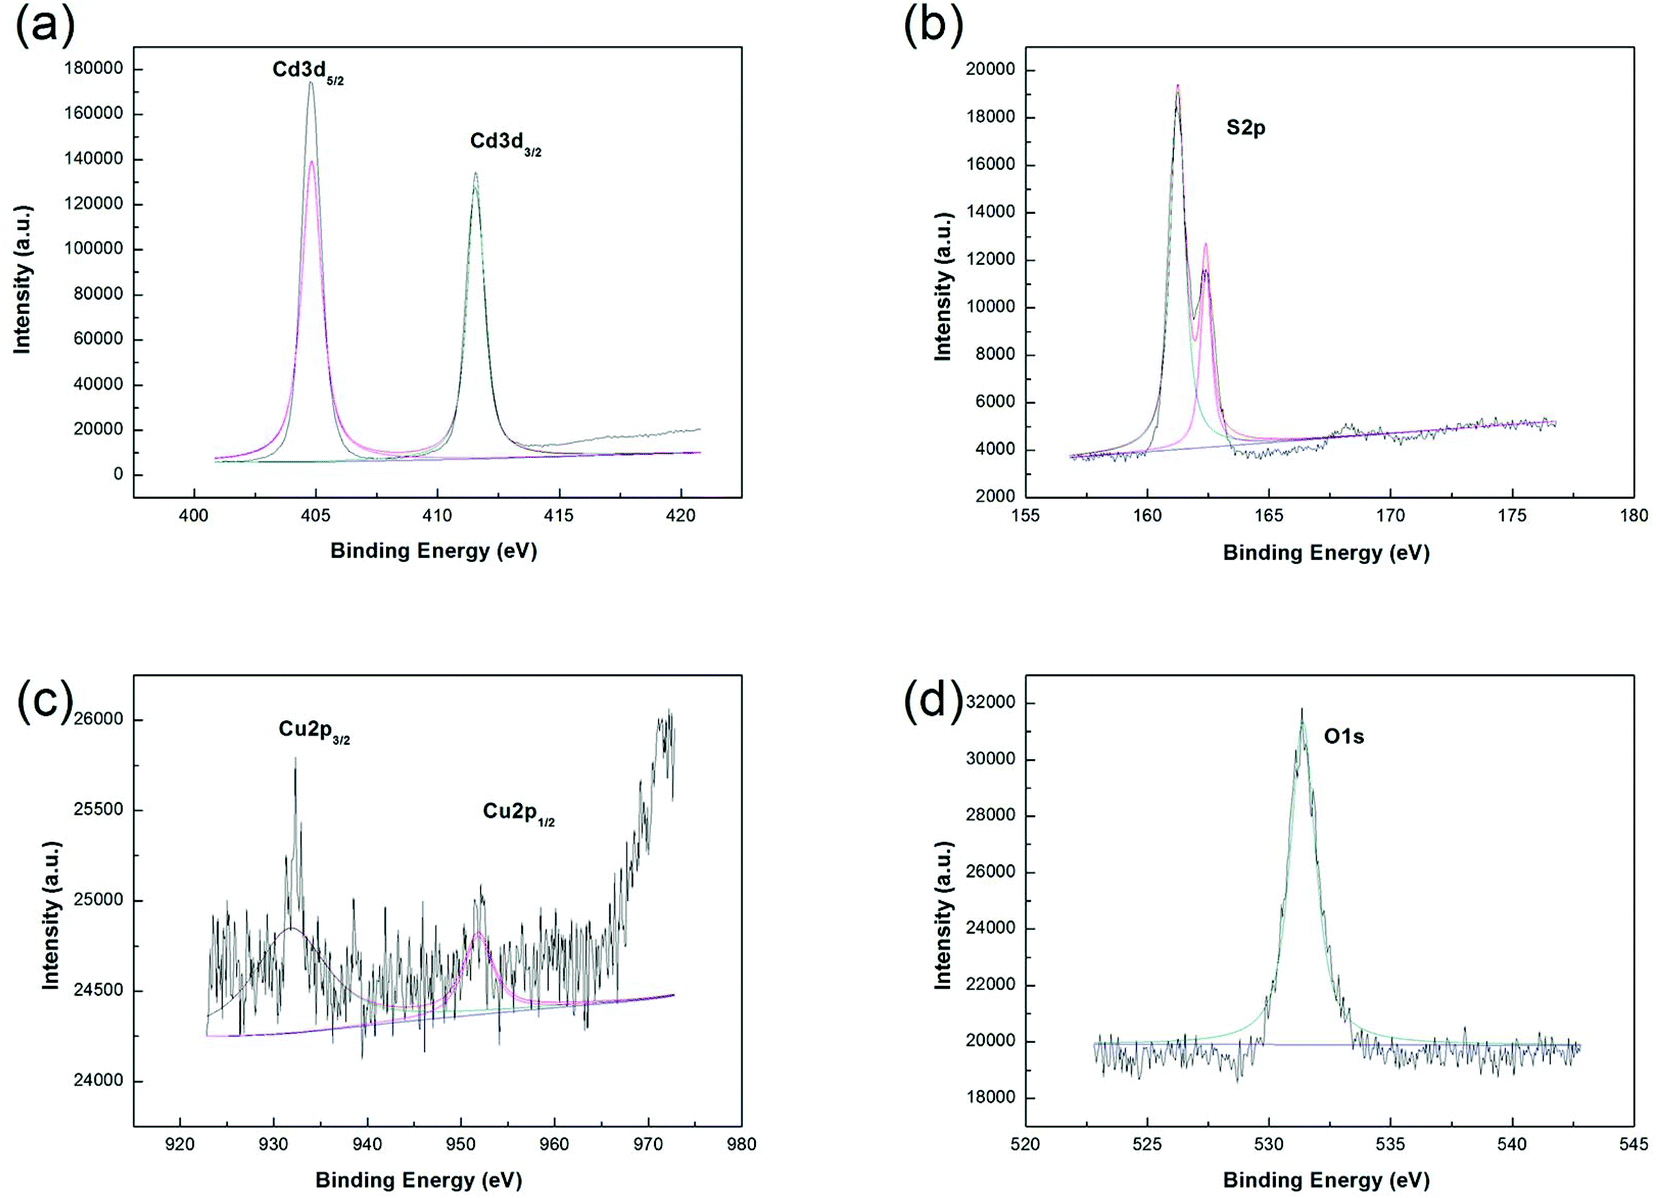 | ||
| Fig. 4 The XPS spectra of the 0.05 at% CuO–CdS: (a) Cd element, (b) S element, (c) Cu element and (d) O element. | ||
To observe the morphology of CuO–CdS composites, SEM and TEM of the samples were measured. Fig. 5 displays the SEM images of the as-synthesized samples. The pristine CdS nanowires are shown in Fig. 5(a and b), with 30–70 nm in diameter and several micrometres in length. As can be seen from Fig. 5(b), the surface of the nanowires was smooth and the diameter was about 65 nm. Fig. 5 displays the effect on the morphology of the materials owing to different contents of trihydrate cupric nitrate added in the reactions. It can be clearly observed that CuO nanoparticles grow on the surface of CdS nanowires. With different contents of trihydrate cupric nitrate, the amounts of CuO nanoparticles were different on the surface of CdS nanowires. There are many CuO nanoparticles in the sample of 0.5 at% CuO–CdS as shown in Fig. 5(c), while the sample of 0.05 at% CuO–CdS shown in Fig. 5(f) has fewer CuO nanoparticles. To observe the detailed morphology, TEM and high-resolution TEM (HRTEM) were necessary.
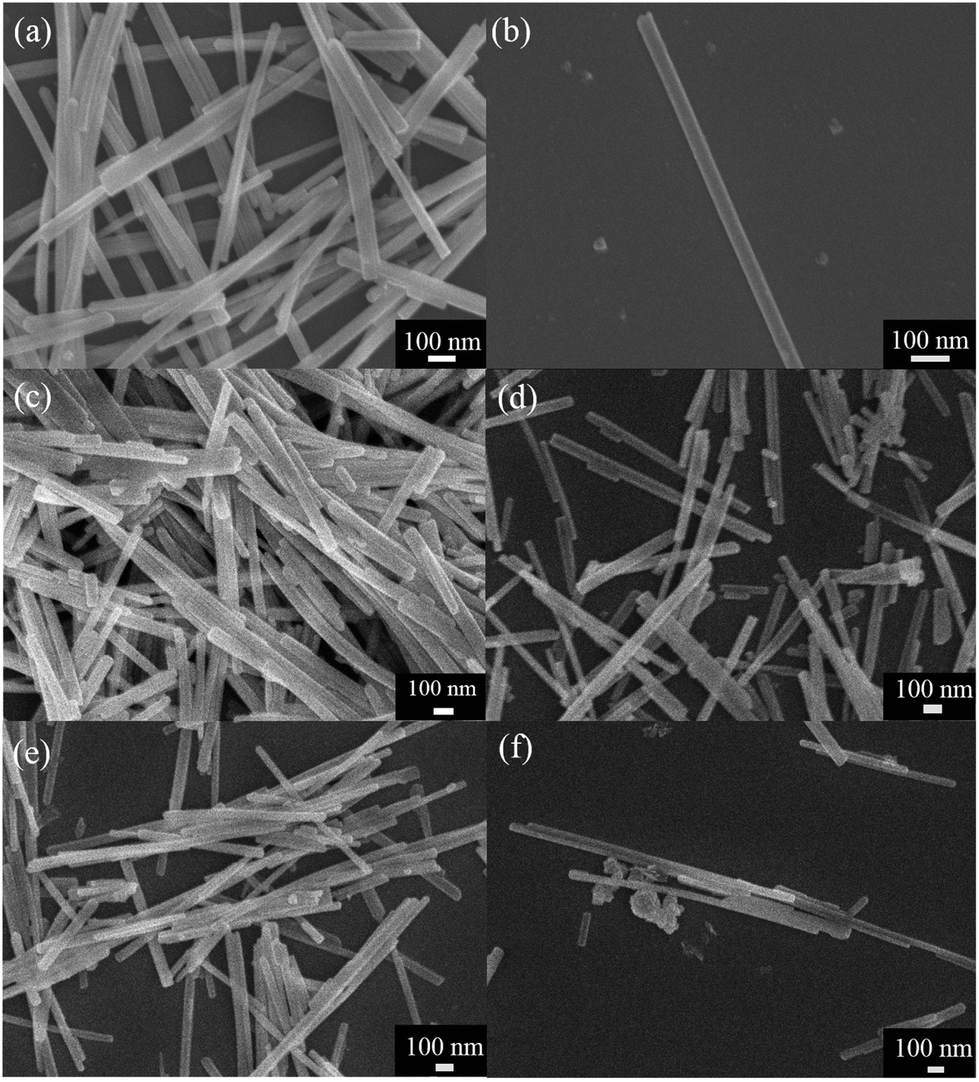 | ||
| Fig. 5 SEM images of the as-prepared (a–b) pure CdS, (c) 0.5 at% CuO–CdS, (d) 0.1 at% CuO–CdS, (e) 0.05 at% CuO–CdS, and (f) 0.01 at% CuO–CdS samples. | ||
For characterizing the microscopic morphology of 0.05 at% CuO–CdS nanowires, TEM and HRTEM images are shown in Fig. 6. Fig. 6(a) depicts the TEM image of 0.05 at% CuO–CdS. The HRTEM image in Fig. 6(b), the partially enlarged picture of Fig. 6(a) at the interface of CdS nanowires and nanoparticles, further shows the detailed crystallographic structure of 0.05 at% CuO–CdS, which clearly revealed two distinct sets of lattice fringes. The measured interplanar distance of 0.336 nm in the CdS nanowire region was in good agreement with the d spacing of the (002) lattice planes of the hexagonal CdS crystal, while in the nanoparticle region, an interplanar distance of 0.215 nm was observed, and it complied with the lattice spacing of the (002) planes of CuO, confirming that CuO nanoparticles were successfully decorated on the surface of CdS nanowires. This result is consistent with that of XRD. Fig. 6c is the scanning TEM (STEM) image of a single nanowire, and the EDS elemental mapping images (Fig. 6d and e) confirm the spatial distribution of Cd and S elements in the CdS nanowires. As shown in Fig. 6(f), the signals of the Cu element were detected on the surface of CdS nanowires which also confirm that CuO nanoparticles were successfully decorated on the surface of CdS nanowires. In addition, the energy-dispersive X-ray spectroscopy (EDS) analysis (Fig. S1†) further showed that the 0.05 at% CuO–CdS nanowires consisted of CdS, Cu and S elements.
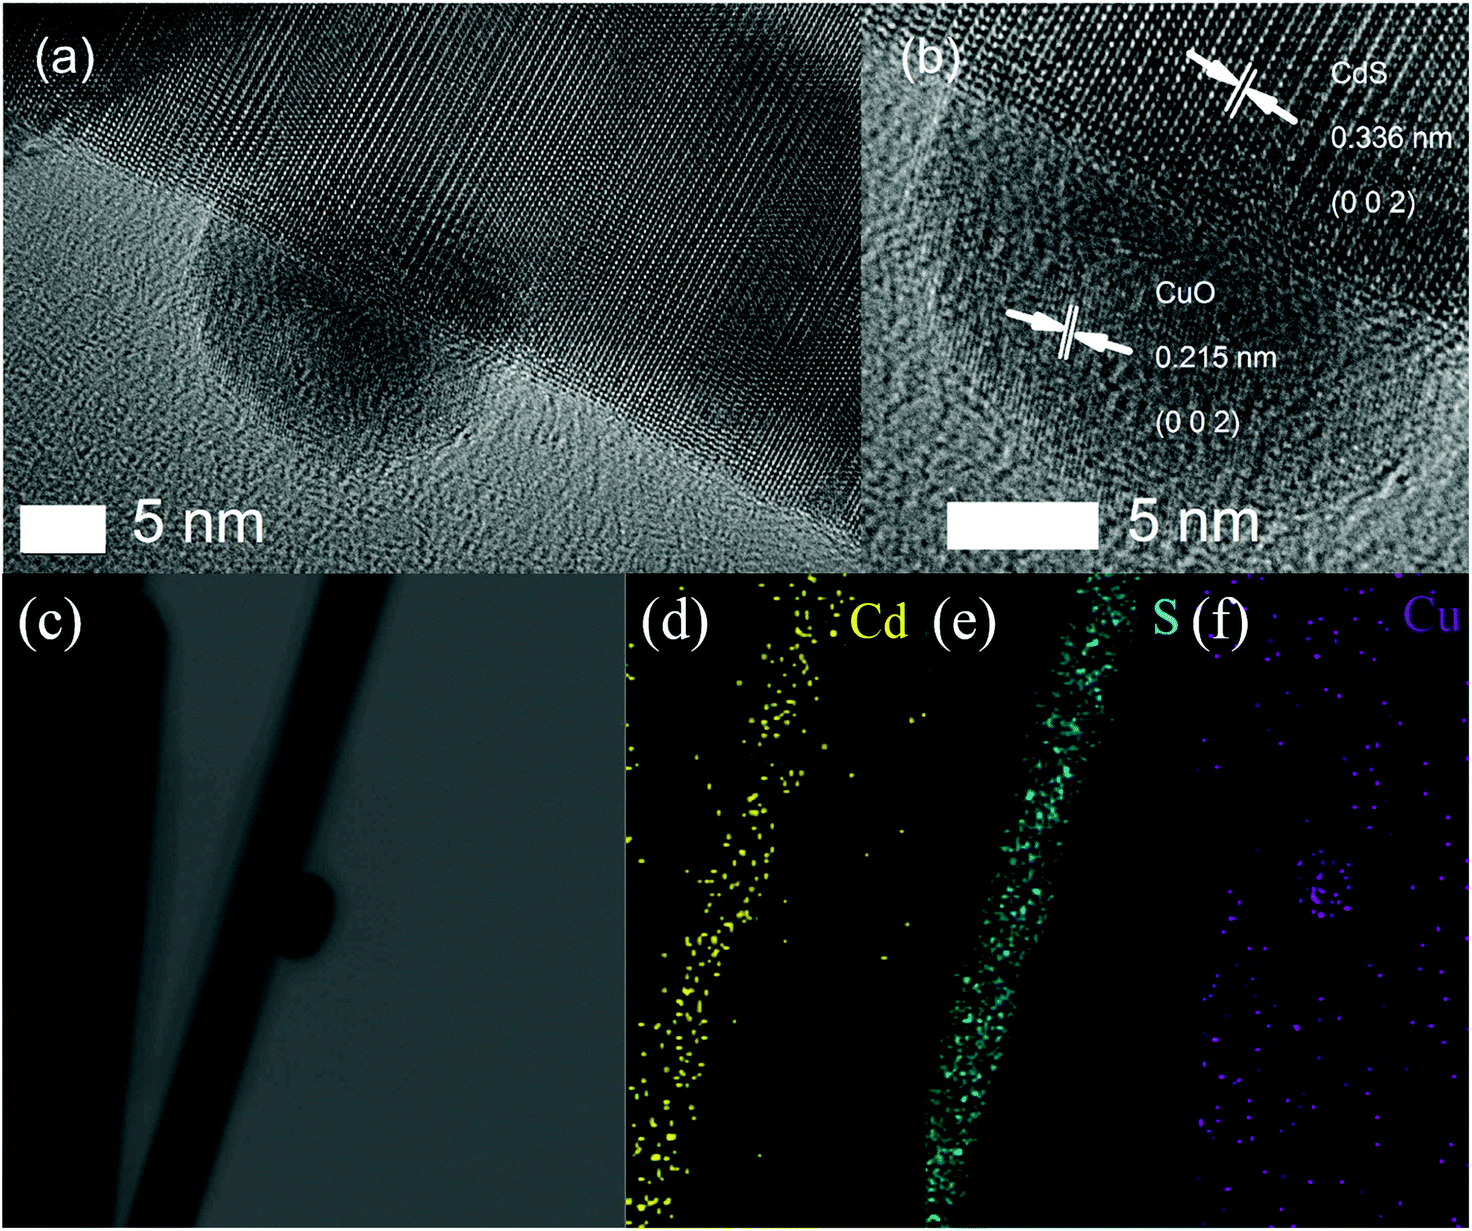 | ||
| Fig. 6 (a) Low-resolution and (b) high-resolution TEM images of the as-prepared 0.05 at% CuO–CdS nanocomposites. (c–f) Scanning TEM (STEM) image and corresponding elemental mapping images. | ||
Gas sensor performance
Gas sensor detection is crucial, and its operating temperature should be first considered. The responses of the as-prepared sensors based on 0.01 at% CuO–CdS, 0.05 at% CuO–CdS, 0.1 at% CuO–CdS, 0.5 at% CuO–CdS, and pure CdS have been investigated in 100 ppm ethanol at different operating temperatures (from 160 °C to 280 °C). As shown in Fig. 7, with the increase of the operating temperature, the responses of all sensors increased rapidly. When the temperature reached a certain degree, the responses achieved the maximal level. With the operating temperature increasing further, the responses decreased gradually. In our investigation, it was found that the working temperature of pure CdS at about 230 °C was the optimal value at which we can obtain the best gas response of 20; and the optimum working temperatures of all CuO–CdS composites were about 182 °C at which the best gas responses were 40, 61, 82, and 120, respectively. The sensors based on CuO–CdS composites displayed higher responses with lower optimum operating temperature, compared with that based on pure CdS. The samples of 0.05 at% CuO–CdS and 0.1 at% CuO–CdS showed 6 and 4 times enhanced responses, respectively. The results clearly showed that the CuO nanoparticles played a key role in improving gas-sensing performance. All of the following tests were performed at the optimum operating temperatures.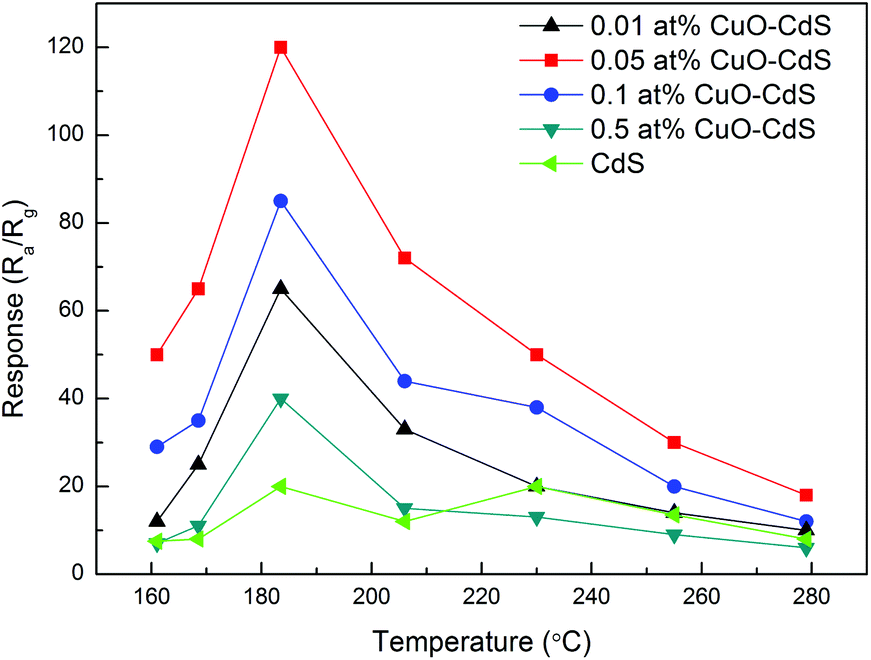 | ||
| Fig. 7 Response of sensors based on CdS and CuO–CdS nanocomposites in 100 ppm ethanol at different operating temperatures. | ||
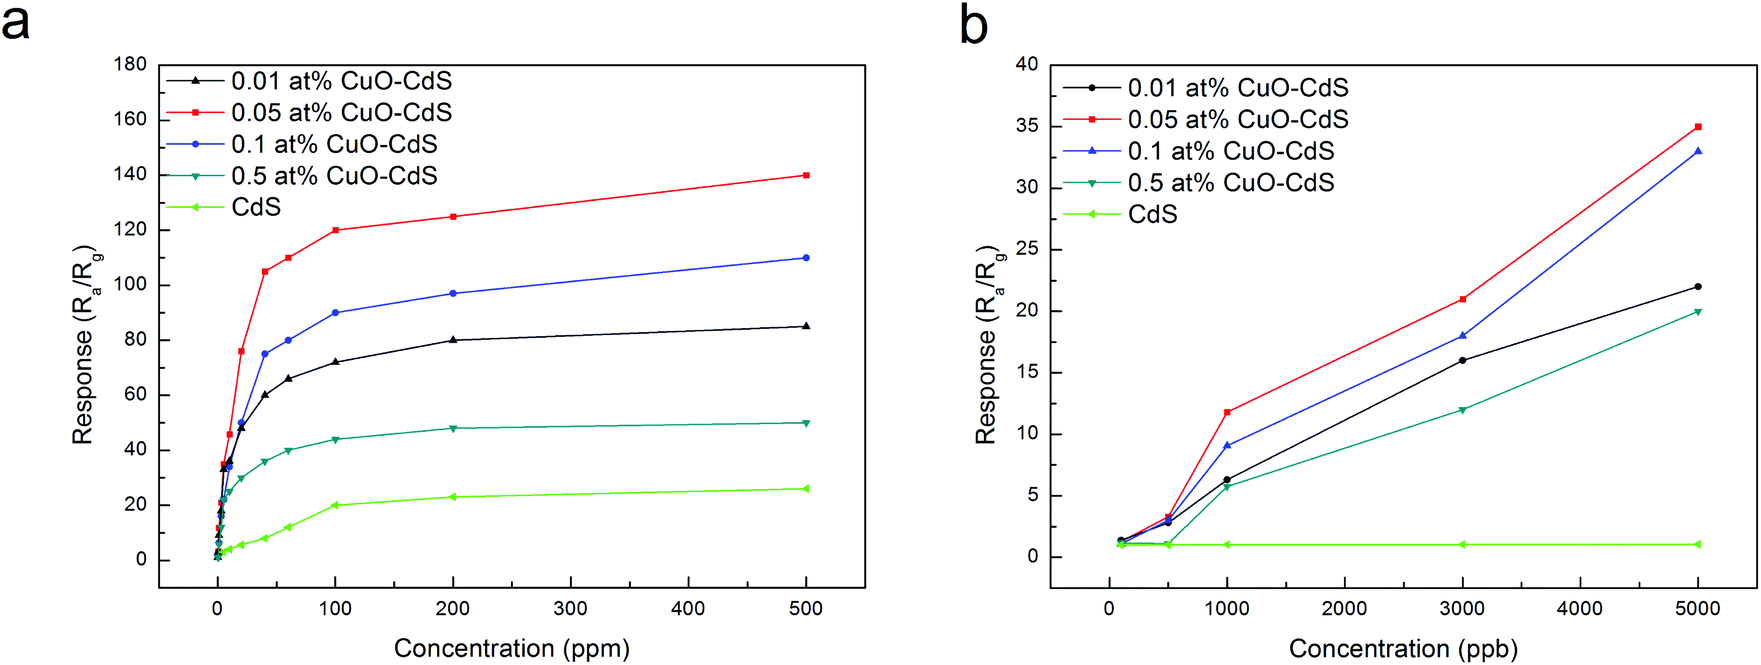
Fig. 8 presents the responses of all sensors varying with different concentrations of ethanol from 100 ppb to 500 ppm. Fig. 8(a) indicates that with increasing ethanol concentration, the responses of sensors increased rapidly, and then reached a stable (maximal) value. Besides, the samples of CuO–CdS composites were more sensitive to a low concentration of ethanol compared with pristine CdS nanowires; and to the same concentration of ethanol, CuO–CdS nanocomposites showed significantly higher responses. In the range of 100 ppb to 5 ppm, the pristine CdS nanowires had almost no gas-sensing performance; other samples presented linear performance, which was important for gas quantitative analysis (Fig. 8(b)). Therefore, the CuO–CdS nanocomposites exhibited excellent properties for the detection of a low concentration of ethanol gas.
 | ||
| Fig. 8 Curves of responses of the sensors based on pure CdS and CuO–CdS versus ethanol concentration at optimum operating temperature. | ||
The real-time detection is critical for a gas sensor. Therefore, the response–recovery time is also an important parameter. The response–recovery time properties of the samples are shown in Fig. 9. Fig. 9(a) shows the responses of the sensors based on 0.01 at% CuO–CdS, 0.05 at% CuO–CdS, 0.1 at% CuO–CdS, and 0.5 at% CuO–CdS in 100 ppb, 500 ppb, 1 ppm, 3 ppm, and 5 ppm of ethanol. The responses increased with the increase of ethanol concentration. Fig. 9(b–f) demonstrate the transient responses of all the sensors. The pure CdS-based sensor was tested at 230 °C in 10 ppm of ethanol, and other sensors were tested at 182 °C in 3 ppm ethanol. The results indicated that both the response time and recovery time of the pure CdS-based sensor were less than 1 s, which were short as predicted. The response times of the sensors based on 0.01 at% CuO–CdS, 0.05 at% CuO–CdS, 0.1 at% CuO–CdS, and 0.5 at% CuO–CdS were about 1 s, less than 1 s, 1 s, and 2 s; and, their recovery times were 3 s, 2 s, 1 s, and 9 s, respectively. These data suggest that all the sensors commonly have a fast response and recovery speed. However, compared with the sensor based on pure CdS, the response–recovery time of those based on CuO–CdS nanocompounds was a little longer. Possible mechanisms will be explained in the later part.
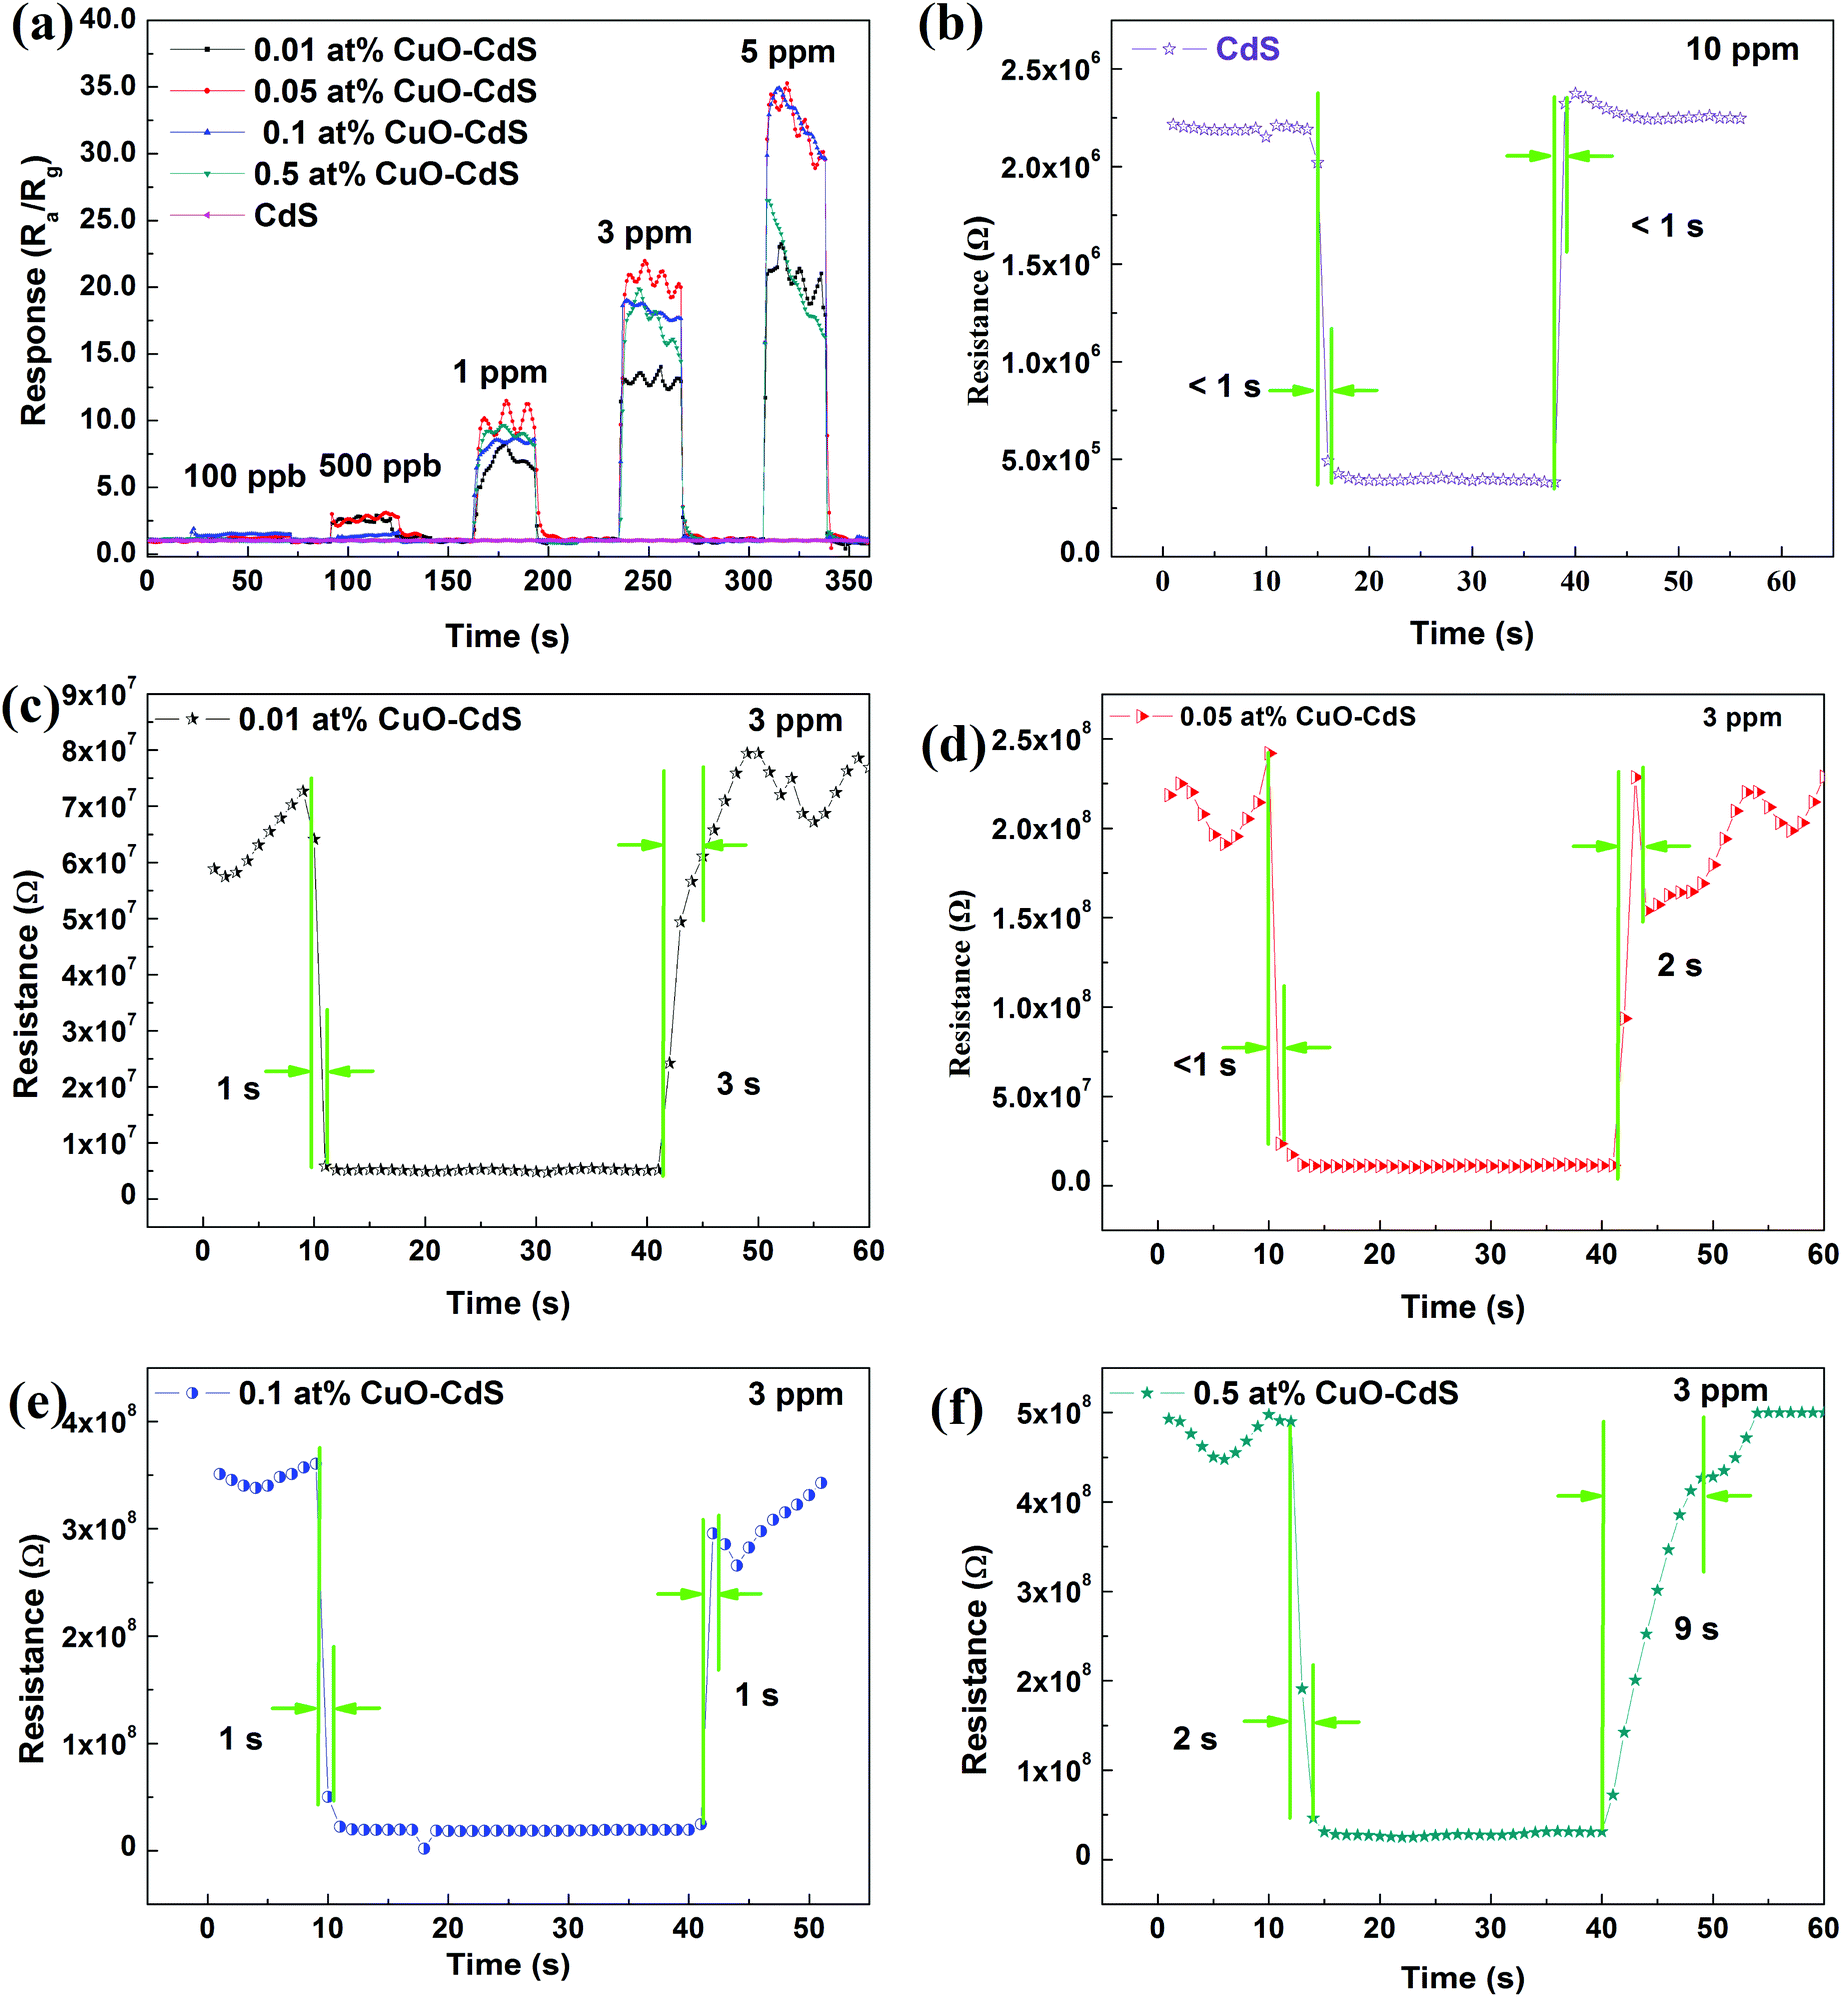 | ||
| Fig. 9 (a) Dynamic response curves of the sensors versus different concentrations of ethanol (from 100 ppb to 5 ppm). Dynamic resistance curves of the (b) CdS and (c)-(f) CuO–CdS based sensors versus 10 and 3 ppm ethanol. | ||
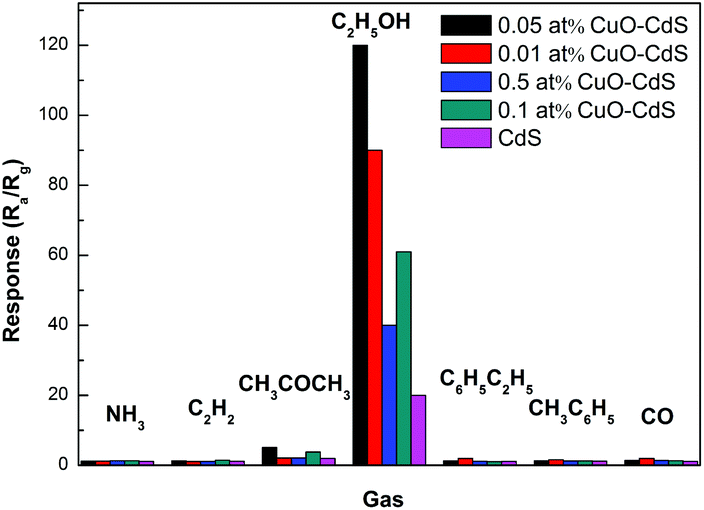
Selectivity is another important parameter for distinguishing different poisonous gases. The selectivity properties of the sensors based on 0.01 at% CuO–CdS, 0.05 at% CuO–CdS, 0.1 at% CuO–CdS, 0.5 at% CuO–CdS and pure CdS were tested at 182 °C and 230 °C, respectively. The response of the sensors in 100 ppm different gases including ammonia (NH3), acetylene (C2H2), acetone (C2H6O), ethanol (C2H5OH), xylene (C6H5C2H6), methylbenzene (CH3C6H5), and carbon monoxide (CO) has been tested (Fig. 10). The results showed that the sensors based on 0.05 at% CuO–CdS, 0.01 at% CuO–CdS, 0.1 at% CuO–CdS, 0.5 at% CuO–CdS and pure CdS possessed higher responses in ethanol than in any other gases, and the corresponding values were 120, 82, 61, 40 and 20, respectively. Consequently, the modification of the CdS nanowire with CuO nanoparticles significantly improved the selectivity towards ethanol. It may be determined by the following factors: on the one hand, CuO nanoparticles on the surface of CdS nanowires act as a catalytically active site for lowering the activation energy of the reaction between ethanol and chemisorbed oxygen species;25 on the other hand, according to the previous studies, CuO based sensors possess good selectivity in ethanol.17 In addition, the responses of CuO/CdS composite based sensors in 100 ppm ethanol, methanol and isopropanol as a function of temperature are shown in Fig. S6.† It can be clearly observed that the response of CuO/CdS based sensors in ethanol is 115, which is almost 3 times larger than in methanol (37.5) and 5 times larger than in isopropanol (22.3).
 | ||
| Fig. 10 Responses of the pure CdS and CuO–CdS based sensors in various test gases (100 ppm). | ||
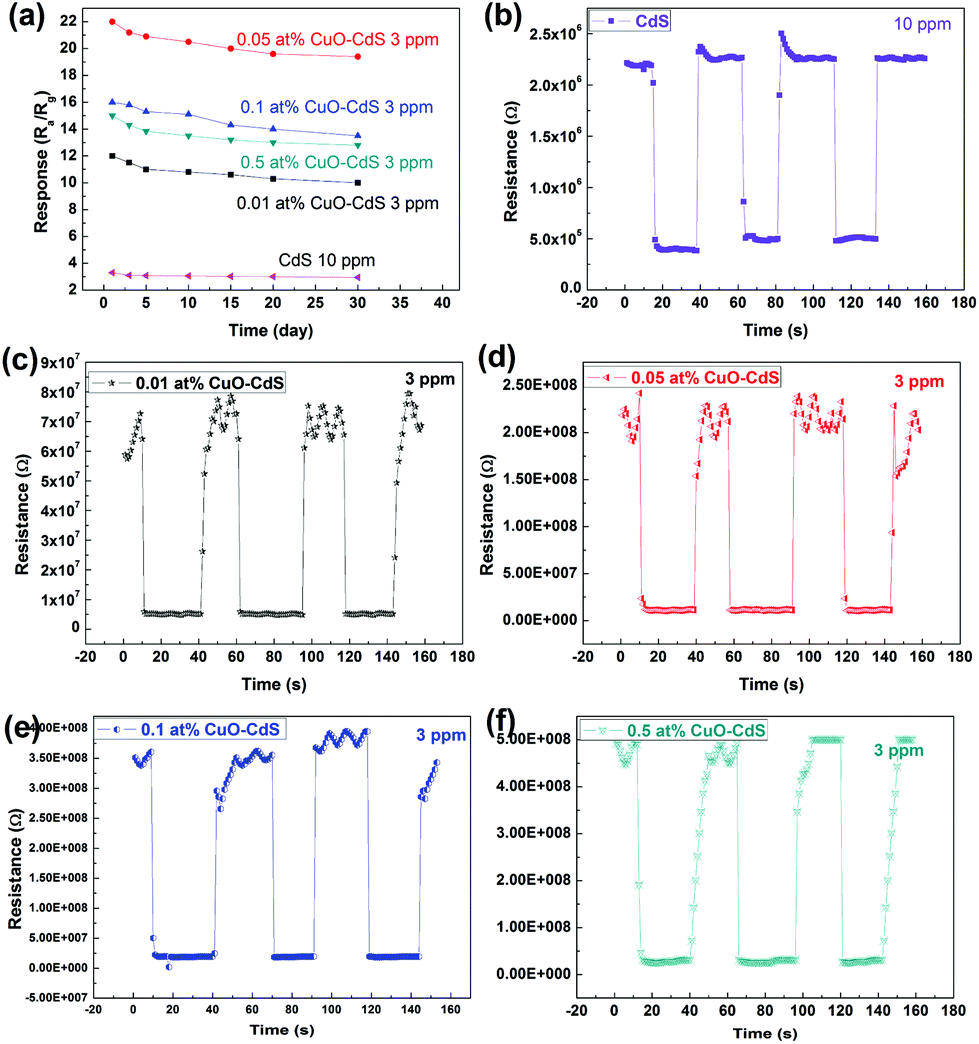
Long-term stability of the CdS sensor in 10 ppm ethanol and CuO–CdS based sensors in 3 ppm ethanol within 30 days are shown in Fig. 11(a). Responses of all the sensors gradually decrease and tend to be stable. For CuO–CdS based sensors, the changes in response values were small and they retained high sensitivity to ethanol within 30 days indicating their good stability. The response and recovery properties of the pure CdS based sensor in 10 ppm ethanol and CuO–CdS in 10 ppm ethanol and the CuO–CdS based sensor in 3 ppm ethanol were tested consecutively three times to investigate their repeatability, as shown in Fig. 11(b–f). During the test, as can be seen, the resistance values of the pure CdS and CuO–CdS based sensors in air change a little and also in the presence of ethanol, i.e. the response values are stable. Also, the response and recovery times of each sensor are very short. These indicate that the pure CdS and CuO–CdS based sensors have good repeatability.
 | ||
| Fig. 11 (a) Stability and (b–f) reproducibility of the pure CdS and CuO–CdS based sensors. | ||
The performances of the ethanol sensors in the previous literature are summarized in Table 1.17,26–29 So far, a large amount of semiconducting metal oxides have been utilized to detect ethanol, including CuO nanoleaves, ZnO/NiO composites, Cu–Fe2O3 microcubes, Fe2O3 nanoporous networks, and ZnO/SnO2 spheres. Our CuO/CdS based sensor has a high response of approximately 120 in 100 ppm ethanol at 180 °C. Thus, the equilibrium consideration, including the response, operating temperature and the response/recovery speed makes the 0.5 at% CuO/CdS nanowire based gas sensors competitive when compared with most ethanol sensors.
| Sensing material | Ethanol | Temp. (°C) | Response | T res. (s) | T recov. (s) | Ref. |
|---|---|---|---|---|---|---|
| CuO nanoleaves | 10 ppm | 260 | 1.38 | 23 | 11.6 | 17 |
| ZnO/NiO | 50 ppm | 400 | 37 | 2.1 | 4.1 | 25 |
| Cu–Fe2O3 microcubes | 100 ppm | 225 | 20 | 26 | ||
| Fe2O3 nanoporous network | 100 ppm | 200 | 35 | 4 | 179 | 27 |
| ZnO/SnO2 spheres | 30 ppm | 210 | 35 | 6 | 120 | 28 |
| Our work: | ||||||
| CdS | 100 ppm | 180 | 20 | ∼1 | ∼1 | |
| CuO/CdS | 100 ppm | 180 | 120 | ∼1 | 2 | |
Possible gas sensing mechanism
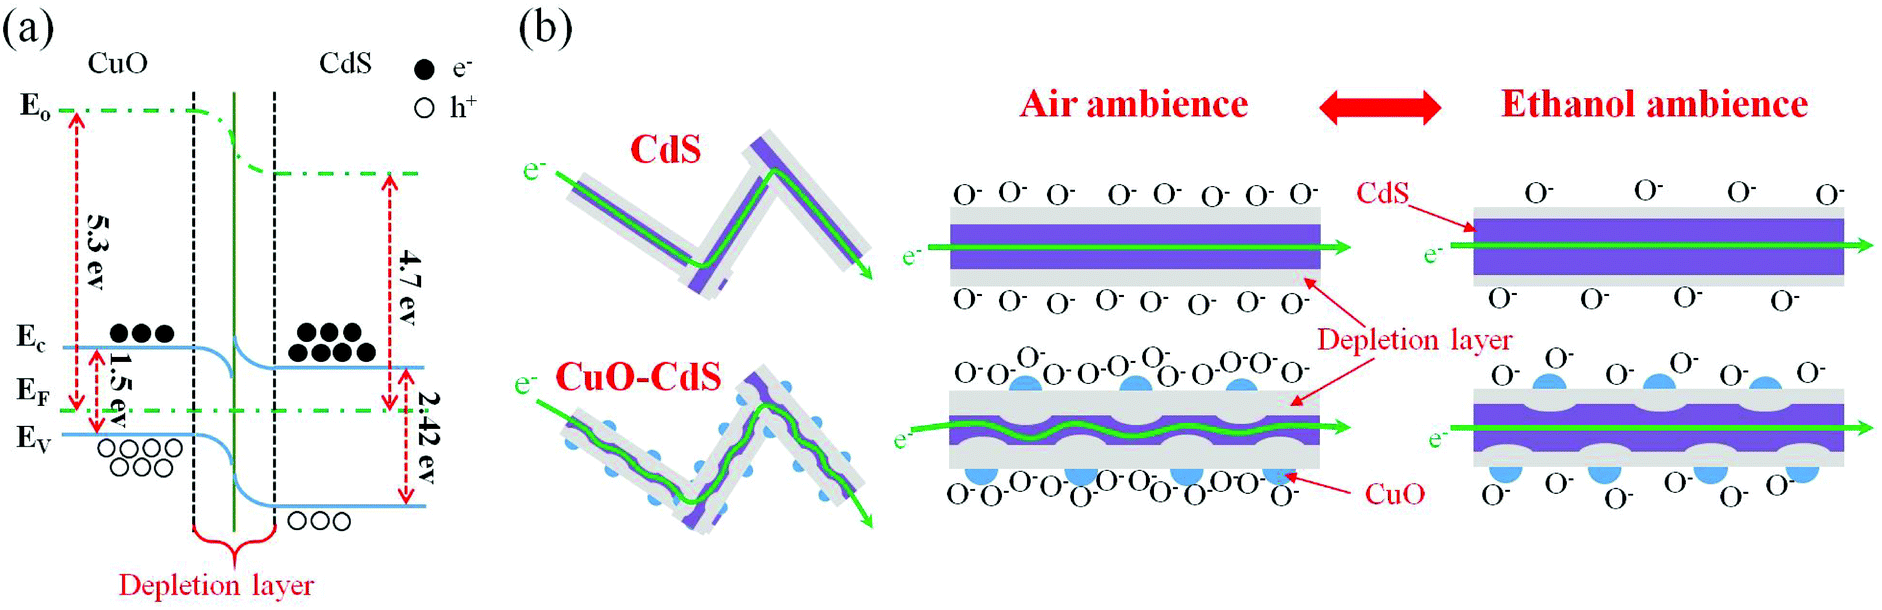
The gas-sensing mechanism is closely connected with the adsorption oxygen of the surface because the sensitive properties are based on the resistance change of the sensing material. When the sensing film is exposed to the atmosphere, oxygen would be adsorbed on the surface and electrons near the material surface would be captured by oxygen. For the n-type semiconductor CdS, oxygen was adsorbed on the CdS surface, forming oxygen ions (O−, O2−, and O2−) after trapping electrons.30 Owing to CdS lacking electrons, the conducting path is narrowed and the depletion layer is widened, and CdS in air, therefore, initially presents a high impedance state. Upon exposure to reducing gas such as ethanol, these reducing gas molecules would react with the surface-adsorbed oxygen, releasing electrons to CdS, then decreasing its resistance under the target atmosphere.The CuO–CdS nanocomposites exhibited excellent properties owing to the formation of a p–n junction. As shown in Fig. 12(a), when the two types of materials came into contact with each other (n-type CdS and p-type CuO), the energy band bent at the interface due to different band gaps and work functions.31,32 Additionally, the formation of the p–n junction would increase the barrier height, making electron transition difficult. As a result, the resistances of CuO–CdS nanocompounds are larger than that of the pure CdS sample in air. When the sensing film was exposed to an ethanol atmosphere, ethanol would react with surface-adsorbed oxygen ions, making the depletion layer thicker. Thus, the formation of the p–n junction was the significant factor that enhanced the properties of the sensors. However, when the surface was decorated with excess CuO nanoparticles, the CuO nanoparticles cover the surface of pristine CdS, which leads to a decrease in the active area of CdS and weakens the gas response. In addition, the heavy coating will cause more electrons to be transferred between CuO nanoparticles rather than between p–n junctions, impairing the gas sensing properties.
 | ||
| Fig. 12 The illustration of the ethanol sensing mechanism: (a) A schematic model for the p-type CuO/n-type CdS heterojunction based sensors when exposed to ethanol gas, (b) reaction occurred on the surface of CdS and CuO–CdS nanocomposites. | ||
The second reason is that more surface-absorbed oxygen ions would exist on the interface of CdS and CuO. As shown in Fig. 12, when CdS and CuO came into contact with each other, they would join together to form the p–n junction at the interface because of different band gaps and work functions. Therefore, the barrier can be formed such that the transition of electrons is prevented. As a result, electrons cannot jump to CdS, but accumulate on the surface of CuO. Then, more and more oxygen molecules are adsorbed at the interface, grabbing electrons from CuO and forming chemical-adsorbed oxygen ions. This process is beneficial for the reaction between ethanol and chemically-adsorbed oxygen ions on the surface of composites. When the sensor is exposed to the low concentration ethanol atmosphere, oxygen ions adsorbed at the interface could react with ethanol molecules more easily, compared with the pure one. Therefore, the CuO–CdS nanocompounds were superior for the detection of low concentration ethanol.
Furthermore, sensors based on the two components mixed together are more sensitive than those based on the single component alone, suggesting a synergistic effect between the two components.33 On the one hand, CdS catalyses the breakdown of ethanol extremely effectively. A combination of CdS and CuO would effectively dehydrogenate ethanol and subsequently catalyse the breakdown of ethanol. This explanation might not apply to all composite gas sensors. Only when the catalytic actions of the components complement each other, the performance of gas sensors will be enhanced. CuO can work as an efficient catalyst for oxidative dehydrogenation of ethanol within air. Besides, it can detect the low concentration of aldehydes. In the present study, when the low concentration of ethanol is explored, the sensors based on pure CdS nanowires show a tiny response, whereas the sensors based on the CuO–CdS nanocomposites catalyse the reaction (1) and induce reaction (2) to improve the responses. However, compared with reaction (1), reaction (2) is weaker in some degree. Taken together, the response–recovery time of some of the CuO–CdS samples is a little longer than that of pure CdS.
| C2H5OH(gas) + O−(ads) → CH3CHO + H2O + e− | (1) |
| CH3CHO(gas) + 5O−(ads) → 2CO2 + 3H2O + 5e− | (2) |
In general, there are many advantages that a p-type CuO grows on the surface of n-type CdS to achieve an excellent performance in ethanol detection. Therefore, CuO–CdS nanocomposites are promising in the field of gas sensors.
Conclusions
In the current study, we have successfully synthesized CuO–CdS (p–n heterojunction) nanocomposites. The suitable CuO nanoparticles grown on the surface of CdS nanowires contributed to the enhanced performance of the sensors. Furthermore, the operating temperature of the sensors based on the CuO–CdS compounds decreased from 230 °C to 182 °C, and their responses were improved by 6 times. In addition, the ultrafast response–recovery time was obtained. And the detection limit was 100 ppb. These findings indicate that the CuO–CdS (p–n heterojunction) nanocomposite material is a very promising candidate material to improve the performance of gas sensors.Conflicts of interest
There are no conflicts of interest to declare.Acknowledgements
The authors are grateful to the National Natural Science Foundation of China (Grant No. 61874048, 11574110, 11874348, U1831113), the Project of Science and Technology Plan of Jilin Province (Grant No. 20180414020GH), and the Project of Jilin Provincial Development and Reform Commission (2018C040-2) for the support of this work.Notes and references
- R. Godbole, V. Godbole and S. Bhagwat, Mater. Sci. Semicond. Process., 2017, 63, 212–219 CrossRef CAS.
- J. Li, R. D. Hodges, R. Gutierrez-Osuna, G. Luckey, J. Crowell, S. S. Schiffman and H. T. Nagle, IEEE Sens. J., 2016, 16, 409–417 Search PubMed.
- J. Ye and G. Huang, International Conference on Innovative Optical Health Science, 2017.
- J. Shin, Y. Hong, M. Wu, Y. Jang, J. S. Kim, B.-G. Park, C. S. Hwang and J.-H. Lee, Electron Devices Meeting (IEDM), 2016 IEEE International, 2016.
- I. Kim and W. Choi, Int. J. Nanotechnol., 2017, 14, 155–165 CrossRef CAS.
- D. Kumar, P. Chaturvedi, P. Saho, P. Jha, A. Chouksey, M. Lal, J. Rawat, R. Tandon and P. Chaudhury, Sens. Actuators, B, 2017, 240, 1134–1140 CrossRef CAS.
- O. Lupan, V. Postica, N. Wolff, O. Polonskyi, V. Duppel, V. Kaidas, E. Lazari, N. Ababii, F. Faupel and L. Kienle, Small, 2017, 13 Search PubMed.
- A. Mane and A. Moholkar, Appl. Surf. Sci., 2017, 405, 427–440 CrossRef CAS.
- K. Fan, J. Guo, L. Cha, Q. Chen and J. Ma, J. Alloys Compd., 2017, 698, 336–340 CrossRef CAS.
- L. Zhang, R. Dong, Z. Zhu and S. Wang, Sens. Actuators, B, 2017, 245, 112–121 CrossRef CAS.
- X. Jian, G. Rao, Z. Jiang, L. Yin, S. Liu, X. Xiao, W. Tian, N. Mahmood, Z. Tan and F. Kuang, Inorg. Chem. Front., 2017, 4, 978–985 RSC.
- L. Ma, H. Fan, H. Tian, J. Fang and X. Qian, Sens. Actuators, B, 2016, 222, 508–516 CrossRef CAS.
- Z. Wang, C. Zhao, T. Han, Y. Zhang, S. Liu, T. Fei, G. Lu and T. Zhang, Sens. Actuators, B, 2017, 242, 269–279 CrossRef CAS.
- X. Jian, S. Liu, Y. Gao, W. Zhang, W. He, A. Mahmood, C. M. Subramaniyam, X. Wang, N. Mahmood and S. X. Dou, ACS Appl. Mater. Interfaces, 2017, 9, 18872–18882 CrossRef CAS.
- X. Jian, X. Xiao, L. Deng, W. Tian, X. Wang, N. Mahmood and S. Dou, ACS Appl. Mater. Interfaces, 2018, 10, 9369–9378 CrossRef CAS PubMed.
- S. Mridha and D. Basak, Semicond. Sci. Technol., 2006, 21, 928 CrossRef CAS.
- Y. Cao, S. Liu, X. Jian, G. Zhu, L. Yin, L. Zhang, B. Wu, Y. Wei, T. Chen, Y. Gao, H. Tang, C. Wang, W. He and W. Zhang, RSC Adv., 2015, 5, 34788–34794 RSC.
- D. P. Volanti, A. A. Felix, M. O. Orlandi, G. Whitfield, D. J. Yang, E. Longo, H. L. Tuller and J. A. Varela, Adv. Funct. Mater., 2013, 23, 1759–1766 CrossRef CAS.
- J. Deng, L. Wang, Z. Lou and T. Zhang, J. Mater. Chem. A, 2014, 2, 9030–9034 RSC.
- C. Li, C. Feng, F. Qu, J. Liu, L. Zhu, Y. Lin, Y. Wang, F. Li, J. Zhou and S. Ruan, Sens. Actuators, B, 2015, 207, 90–96 CrossRef CAS.
- P. Khiew, N. Huang, S. Radiman and M. S. Ahmad, Mater. Lett., 2004, 58, 516–521 CrossRef CAS.
- M. Thambidurai, N. Murugan, N. Muthukumarasamy, S. Agilan, S. Vasantha and R. Balasundaraprabhu, J. Mater. Sci. Technol., 2010, 26, 193–199 CrossRef CAS.
- H. Wang, P. Fang, Z. Chen and S. Wang, Appl. Surf. Sci., 2007, 253, 8495–8499 CrossRef CAS.
- W. Yuanda, T. Maosong, H. Xiuli, Z. Yushu and D. Guorui, Sens. Actuators, B, 2001, 79, 187–191 CrossRef CAS.
- X. Zhou, S. Lee, Z. Xu and J. Yoon, Chem. Rev., 2015, 115, 7944–8000 CrossRef CAS.
- X. Deng, L. Zhang, J. Guo, Q. Chen and J. Ma, Mater. Res. Bull., 2017, 90, 170–174 CrossRef CAS.
- P. Sun, C. Wang, X. Zhou, P. Cheng, K. Shimanoe, G. Lu and N. Yamazoe, Sens. Actuators, B, 2014, 193, 616–622 CrossRef CAS.
- N. T. A. Thu, N. D. Cuong, L. C. Nguyen, D. Q. Khieu, P. C. Nam, N. V. Toan, C. M. Hung and N. V. Hieu, Sens. Actuators, B, 2018, 255, 3275–3283 CrossRef.
- J. Liu, T. Wang, B. Wang, P. Sun, Q. Yang, X. Liang, H. Song and G. Lu, Sens. Actuators, B, 2017, 245, 551–559 CrossRef CAS.
- C. Wang, X. Cheng, X. Zhou, P. Sun, X. Hu, K. Shimanoe, G. Lu and N. Yamazoe, ACS Appl. Mater. Interfaces, 2014, 6, 12031–12037 CrossRef CAS PubMed.
- D. Ju, H. Xu, Z. Qiu, J. Guo, J. Zhang and B. Cao, Sens. Actuators, B, 2014, 200, 288–296 CrossRef CAS.
- Z. Qu, Y. Fu, B. Yu, P. Deng, L. Xing and X. Xue, Sens. Actuators, B, 2016, 222, 78–86 CrossRef CAS.
- C. Wang, L. Yin, L. Zhang, D. Xiang and R. Gao, Sensors, 2010, 10, 2088–2106 CrossRef CAS PubMed.
Footnotes |
| † Electronic supplementary information (ESI) available. See DOI: 10.1039/c8qi00951a |
| ‡ These authors contributed equally to this work. |
| This journal is © the Partner Organisations 2019 |