Successive near-room-temperature dielectric phase transitions in a lead-free hybrid perovskite-like compound†
Jing
Zhang
a,
Shiguo
Han
a,
Xitao
Liu
 a,
Chengmin
Ji
a,
Kewen
Tao
a,
Muhammad Adnan
Asghar
b,
Junhua
Luo
a,
Chengmin
Ji
a,
Kewen
Tao
a,
Muhammad Adnan
Asghar
b,
Junhua
Luo
 *a and
Zhihua
Sun
 *a
*a
aState Key Laboratory of Structural Chemistry, Fujian Institute of Research on the Structure of Matter, Chinese Academy of Sciences, Fuzhou 350002, China. E-mail: jhluo@fjirsm.ac.cn; sunzhihua@fjirsm.ac.cn
bDepartment of Chemistry, University of Education, Lahore, Pakistan
First published on 19th November 2018
Abstract
Solid–solid phase transition materials have attracted increasing attention because of their variety of applications in optoelectronic devices, data storage, and ferroelectric field-effect transistors. Hybrid organic–inorganic perovskite materials combine the characteristics of organic and inorganic components and thus might be promising candidates to obtain phase-transition materials. Here, we report a lead-free organic–inorganic hybrid (hexamethyleneimine)2BiBr5 (1), which displays successive phase transitions at 268 K, 304 K and 311 K upon heating; these phase transitions are induced by the distorted configurational change in organic cations and slight reorientational displacement of [BiBr5]n2− polyanionic zigzag chains. In addition, the UV/Vis optical spectrum indicates that 1 has an indirect bandgap of 2.70 eV. Furthermore, computational analyses disclose that the inorganic perovskite-like building blocks of 1 contribute significantly to its semiconducting properties. This study offers a pathway to explore new lead-free organic–inorganic hybrids with phase transition.
Introduction
Solid–solid phase transition materials have attracted increasing attention because of their variety of applications in optoelectronic devices, data storage, ferroelectric field-effect transistors, etc.1 To construct temperature-related phase-transition materials, one of the most prominent strategies is to introduce dynamic molecular moieties such as highly flexible organic amines. The flexible organic moieties provide more opportunities to reorient within the lattice and thus induce phase transition, which leads to anomalies in dielectric, elastic, thermal, and other properties.3 Structurally, the organic–inorganic perovskite hybrids combine the characteristics of organic and inorganic components. For instance, the organic counterparts offer structural diversity and dynamic behavior,2 whereas the inorganic components contribute to semiconducting behavior and optical properties.4 In this context, the organic–inorganic hybrid phase transition materials have been investigated extensively in the last decades. Recently, cyclic organic moieties with a flexible structure have attracted the attention of researchers, and numerous organic–inorganic perovskites have been reported. For example, in (hexamethyleneimine)PbBr3,5 phase transition was induced by the disorder of flexible hexamethyleneiminium cation. Moreover, [1-methylpiperidinium]-PbI3![[thin space (1/6-em)]](https://www.rsc.org/images/entities/char_2009.gif) 6 and bis(cyclohexylaminium)-tetrabromo lead7 display order–disorder phase transition and semiconducting property, which benefit from reorientation of flexible organic moieties and inorganic parts. It is suggested that the flexible organic moieties might be promising candidates to obtain phase transition materials.
6 and bis(cyclohexylaminium)-tetrabromo lead7 display order–disorder phase transition and semiconducting property, which benefit from reorientation of flexible organic moieties and inorganic parts. It is suggested that the flexible organic moieties might be promising candidates to obtain phase transition materials.
Currently, numerous organometallic halide perovskites have been successfully synthesized, which contain small organic amine cations (CH3NH3+ and NH![[double bond, length as m-dash]](https://www.rsc.org/images/entities/char_e001.gif) CHNH3+), inorganic metal cations (Sn2+, Pb2+ and Cd2+) and halide anions (Cl−, I− and Br−).8 We have also reported many Pb-based halide perovskites with ferroelectric phase transitions such as bis(cyclohexylaminium) tetrabromo lead,9 (C4H9NH3)2(CH3NH3)2Pb3Br10,10 (C4H9NH3)2(NH2CHNH2)Pb2Br7,11 and (C4H9NH3)2CsPb2Br7.12 In all these lead-based hybrid materials, the order–disorder changes in organic cations make great contribution to their phase transitions. However, the toxicity of lead is still a possible obstacle for further applications because the maximum value of Pb2+ is strictly stipulated (such as smaller than 0.15 μg L−1 in air and 15 μg L−1 in water).13 In this context, it is extremely urgent to explore new lead-free perovskite materials.
CHNH3+), inorganic metal cations (Sn2+, Pb2+ and Cd2+) and halide anions (Cl−, I− and Br−).8 We have also reported many Pb-based halide perovskites with ferroelectric phase transitions such as bis(cyclohexylaminium) tetrabromo lead,9 (C4H9NH3)2(CH3NH3)2Pb3Br10,10 (C4H9NH3)2(NH2CHNH2)Pb2Br7,11 and (C4H9NH3)2CsPb2Br7.12 In all these lead-based hybrid materials, the order–disorder changes in organic cations make great contribution to their phase transitions. However, the toxicity of lead is still a possible obstacle for further applications because the maximum value of Pb2+ is strictly stipulated (such as smaller than 0.15 μg L−1 in air and 15 μg L−1 in water).13 In this context, it is extremely urgent to explore new lead-free perovskite materials.
Here, we have reported a lead-free organic–inorganic hybrid, (hexamethyleneimine)2BiBr5 (1), which consists of a one-dimensional (1D) corner-sharing octahedral anionic framework. DSC measurement suggests that there are three successive phase transitions at 264, 303 and 310 K. Dielectric measurements indicate that the dielectric constants for 1 display abrupt changes in the vicinity of its phase transition temperatures, corresponding well with the DSC trace. From the structural analysis, we infer that the phase transitions of 1 result from the configuration changes of organic cations along with the reorientation of [BiBr5]n2− polyanionic zigzag chains. Besides, the UV/Vis optical spectrum indicates the feature of indirect band gap for 1 (with the Eg value of ∼2.70 eV). Moreover, the computational analyses of its band structure reveal that the inorganic framework makes a great contribution to its semiconducting properties. We believe that our study might provide a potential pathway to design new lead-free organic–inorganic hybrids with phase transition.
Experimental
Synthesis
At room temperature, 1 was easily synthesized by the reaction of hexamethyleneimine and bismuth trioxide (Bi2O3) (molar ratio 2![[thin space (1/6-em)]](https://www.rsc.org/images/entities/char_2009.gif) :
:![[thin space (1/6-em)]](https://www.rsc.org/images/entities/char_2009.gif) 1) in hydrobromic acid. Using the slow evaporation of the aqueous solution method, we obtained yellow needle-like crystals at room temperature. Powder X-ray diffraction (PXRD) confirmed the phase purity, which was performed on a Miniflex 600 powder X-ray diffractometer (Fig. S1†).
1) in hydrobromic acid. Using the slow evaporation of the aqueous solution method, we obtained yellow needle-like crystals at room temperature. Powder X-ray diffraction (PXRD) confirmed the phase purity, which was performed on a Miniflex 600 powder X-ray diffractometer (Fig. S1†).
Thermal measurements
Differential scanning calorimetry (DSC) data were recorded by a Netzsch DSC 200 F3 calorimeter with the heating/cooling rates of 15, 10 and 5 K min−1. The thermogravimetric analysis data were obtained by using Mettler Toledo TGA/SDTA 851e.Dielectric measurements
The complex permittivity of powder sample was performed on a Tonghui TH2828A analyzer in the temperature range of 240–345 K, and the complex dielectric permittivity ε (ε = ε′ − iε′′) was performed at different frequencies (300 kHz, 500 kHz and 1000 kHz).Single-crystal X-ray crystallography
The single-crystal X-ray data of 1 were collected at 100 K, 285 K and 330 K (Table S1†). We managed all the crystal data using the Crystalclear software package (Rigaku, 2005). The direct method was utilized to solve the crystal structures of 1. Then, the crystal structures were refined by the full-matrix least-squares refinements on F2 with the SHELXLTL software package. We anisotropically refined the non-hydrogen atoms according to all the reflections with I > 2σ(I). Moreover, all hydrogen atoms were obtained geometrically.Calculations of band structure
Using the single-crystal structural data of 1, we calculated its frontier orbitals, band structure and the density of states by the total-energy coder CASTEP package. We utilized the norm-conserving pseudopotential to describe the interactions between the ionic cores and electrons and treated the orbital electrons of Bi (5d106s26p3), Br (4s26p5), C (2s22p2), N (2s22p3) and H (1s1) as valence electrons. The convergent criteria and other parameters were also considered as the default values of CASTEP code.Results and discussion
Thermal properties
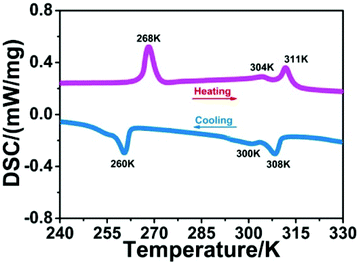
Phase transition behaviors of 1 were first studied by using DSC measurements. As shown in Fig. 1, during the heating and cooling cycles, three couples of thermal peaks were clearly observed at 260/268 K, 300/304 K and 308/311 K. This result suggests that 1 displays reversible phase transitions around Tc1 = 268 K, Tc2 = 304 K and Tc3 = 311 K in the heating mode. Besides, thermal hysteresis for phase transitions of 1 was also confirmed (6, 4 and 3 K), which suggests the first-order character of its phase transitions (Fig. S2†). In addition, compound 1 shows thermal stability at 600 K (Fig. S3†), and its Tc values are different from the decomposition temperature. Such high thermal stability and wide temperature interval of 1 might be favorable for its potential device application.14Single crystal structure analysis
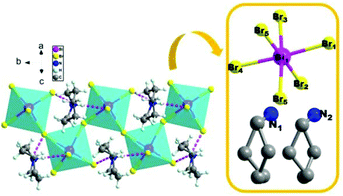
To reveal the microscopic origin of phase transitions in 1, its crystal structures were determined at 100 K (LTP), 285 K (ITP) and 330 K (HTP). At LTP, 1 belongs to the monoclinic crystal system with the space group of P21/n (point group C2h). The cell parameters are a = 12.93, b = 7.81, c = 21.11 Å, β = 90.78° and V = 2132.15 Å3 (Table S1†). As shown in Fig. 2, compound 1 is composed of hexamethyleneiminium cation and one-dimensional [BiBr5]n2− polyanionic zigzag chains. For the corner-sharing BiBr6 octahedra, the central Bi atoms are coordinated by six bromines. There are two types of Br atoms in one octahedron, which are defined as two bridging and four terminal Br ligands, respectively. It is observed that the octahedron of anions is slightly distorted, which is verified by the bond lengths. For example, the bond lengths for Bi–Br1, Bi–Br2, Bi–Br4 and Bi–Br5 are 2.88, 2.76, 2.83 and 2.96 Å, respectively. Besides, it is noticed that the organic cations are placed in free cavities, which are formed by anionic chains. The organic cations and [BiBr5]n2− are bonded through weak hydrogen bonds (N–H⋯Br), for which the donor–acceptor distances are in the range of 2.53–2.94 Å.At ITP and HTP, crystal structures of 1 still crystallize in the monoclinic space group P21/n, and the crystal packing also features the characteristics of 1D corner-sharing [BiBr5]n2− infinite anionic chains (Fig. 3a and b). Although there is no significant change in the cell parameters (Table S1†), the molecular conformation of organic cations displays an evident change. As shown in Fig. 3c, the degree of distortion of the cations at ITP is quite different from that at HTP. For example, the angles of C7–C8–C9 (HTP), C12–C11–C10 (ITP) and C7–C8–C9 (LTP) are 150.0°, 129.3° and 115.61°, respectively. For the inorganic part, the bond distances of Bi–Br range from 2.69 Å to 3.12 Å in HTP and ITP, which exhibit some changes in comparison with the values in LTP (from 2.72 Å to 3.06 Å, Tables S2–S4†). As a result, it is deduced that the phase transitions of 1 are determined by the distorted change in molecular configurations and the slight reorientational displacement of [BiBr5]n2− polyanionic zigzag chains.
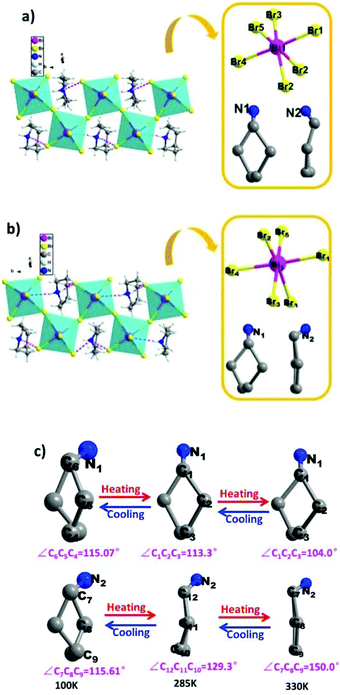 | ||
| Fig. 3 Crystal structures and asymmetry unit of compound 1 labelled by the atomic numbering scheme at (a) ITP and (b) HTP; (c) the cations of hexamethyleneimine at LTP, ITP and HTP. | ||
Dielectric studies of 1
At the vicinity of Tc, the abrupt changes in bulk physical properties can be generally observed, for which the value of variation is closely related to the structural changes.15,16 Here, the dielectric properties of compound 1 were studied at the temperature range of 240–345 K under different frequencies of 300, 500 and 1000 kHz. As shown in Fig. 4, two peak-like anomalies of the real part (ε′) of complex dielectric permittivities were observed at around 268 K and 311 K, corresponding well to the DSC results. Moreover, there is a small step-like change in the vicinity of 300 K, which should be related to the phase transition at Tc2. To the best of our knowledge, this successive dielectric response of 1 is very similar to that of some other phase transition materials such as N-isopropylbenzyl-ammonium dichloroacetate and betainium chlorodifluoroacetate.17,18 Besides, the imaginary parts (ε′′) of complex dielectric permittivities also display a very similar tendency (Fig. S4, ESI†). In this aspect, such dielectric behaviors strongly confirm the phase transition characteristics of 1.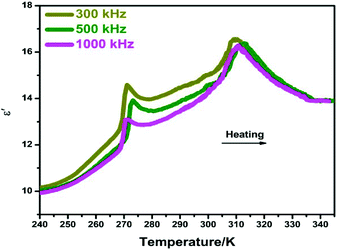 | ||
| Fig. 4 Temperature dependence of the real part (ε′) of the complex permittivity for 1 measured at different frequencies. | ||
Semiconducting properties of compound 1
To explore the possible semiconducting properties of 1, we conducted UV–vis diffuse-reflectance spectroscopy on a PerkinElmer Lambda 950 UV–vis–IR spectrophotometer. Generally speaking, there are two types of bandgaps (Eg) for semiconductor materials: direct and indirect bandgaps. Here, the classic indirect bandgap semiconductor of TiO2 was used for comparison. As depicted in Fig. 5, the absorption spectrum of 1 resembles that of anatase TiO2, suggesting the indirect band-gap feature for 1. Moreover, its absorption edge is estimated to be ∼460 nm. As a result, the band gap (Eg) of compound 1 is calculated to be about 2.70 eV by the variant of the Tauc equation: [hνF(R∞)]1/n = A(hν − Eg), where h is the Planck's constant, ν is frequency of vibration, F(R∞) is the Kubelka–Munk function and A is the proportional constant.19–21 There are two values for n: 1/2 (indirect band gap) or 2 (direct band gap). The bandgap of 1 falls in the range of other Bi-base hybrid compounds such as [NH2(CH2CH3)2]3BiBr6 (∼2.81 eV),22 (MOV)2[Bi2Cl10] (∼2.00 eV),23 and (MV)[BiBr5].24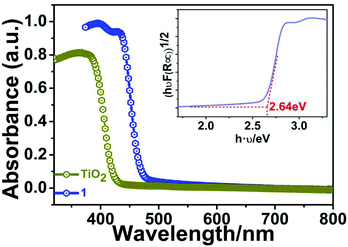 | ||
| Fig. 5 UV/Vis absorption spectra of compound 1. The inset displays the Tauc plot deduced from the optical spectrum. | ||
Computational analyses
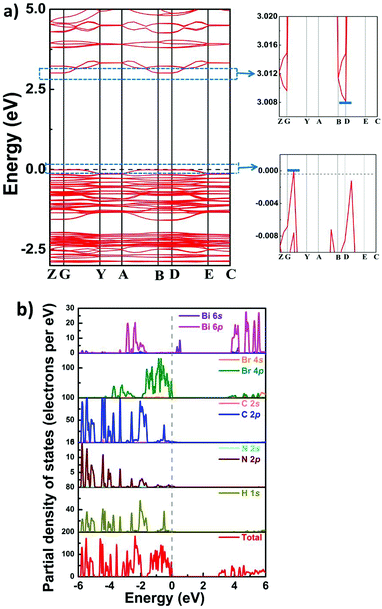
Furthermore, we used the DFT (density functional theory) method to calculate the energy gap and band structure of 1, which would be helpful for analyzing the electronic mechanism of semiconducting properties. As depicted in Fig. 6, around the G point, the maximum value of the valence band (VB) is observed, whereas the minimum value of the conduction band (CB) is situated at the D point. This result suggests indirect bandgap characteristics for 1, which coincides with its UV–vis absorption spectrum. Moreover, the value of the theoretical bandgap of compound 1 is calculated to be ∼3.01 eV, and this value is slightly larger than the experimental result (∼2.7 eV). From the partial density of states (PDOS) of compound 1, it is clearly observed that H-1s, C-2p and N-2p states are overlapped from −6 to 6 eV, indicating strong interactions of C–H and N–H bonds. In the location of the Fermi level, the peaks of Br s/p and Bi s/p are observed, which should be closely related to the CB minimum and the VB maximum of 1. It can be deduced that the VB band and the CB band originate from Br 4s/p and Bi 6s/p, respectively. Therefore, it is proposed that inorganic perovskite-like building blocks make dominant contribution to the band structure of 1.Conclusions
We have reported a lead-free organic–inorganic hybrid, (hexamethyleneimine)2BiBr5 (1), which undergoes three successive phase transitions in the vicinity of room temperature, as verified by DSC and dielectric measurements. The structural analyses indicate that its phase transitions are caused by the distortions in molecular configurations and slight reorientational displacement of [BiBr5]n2− polyanionic zigzag chains. Besides, 1 also exhibits indirect bandgap feature with the Eg value of 2.70 eV. Theoretical analysis of the electronic structure reveals that the inorganic framework makes a great contribution to its band structure. It is believed that this result might shed light on the exploration of new lead-free organic–inorganic hybrids with phase transition.Conflicts of interest
There are no conflicts to declare.Acknowledgements
This work was financially supported by the National Natural Science Foundation of China (21622108, 21875251, 21525104, 21833010, 21601188, 51502290, and 51502288), the Strategic Priority Research Program of the Chinese Academy of Sciences (XDB20010200).Notes and references
- (a) M. Wuttig and N. Yamada, Nat. Mater., 2007, 6, 824–832 CrossRef CAS PubMed; (b) M. Salinga and M. Wuttig, Science, 2011, 332, 543–544 CrossRef CAS PubMed; (c) H. M. Zheng, J. B. Rivest, T. A. Miller, B. Sadtler, A. Lindenberg, M. F. Toney, L.-W. Wang, C. Kisielowski and A. P. Alivisatos, Science, 2011, 333, 206–209 CrossRef CAS PubMed.
- (a) K. Kinbara and T. Aida, Chem. Rev., 2005, 105, 1377–1400 CrossRef CAS PubMed; (b) D. A. Leigh, J. K. Y. Wong, F. Dehez and F. Zerbetto, Nature, 2003, 424, 174–179 CrossRef CAS PubMed.
- (a) T. Akutagawa, H. Koshinaka, D. Sato, S. Takeda, S. Noro, H. Takahashi, R. Kumai, Y. Tokura and T. Nakamura, Nat. Mater., 2009, 8, 342–347 CrossRef CAS PubMed; (b) W. Zhang and R. Xiong, Chem. Rev., 2012, 112, 1163–1195 CrossRef CAS PubMed; (c) Z. Sun, T. Chen, J. Luo and M. Hong, Angew. Chem., Int. Ed., 2012, 51, 3871–3876 CrossRef CAS PubMed.
- (a) Y. Takahashi, R. Obara, K. Nakagawa, M. Nakano, J. Tokita and T. Inabe, Chem. Mater., 2007, 19, 6312–6316 CrossRef CAS; (b) I. Chung, J. Song, J. Im, J. Androulakis, C. D. Malliakas, H. Li, A. J. Freeman, J. T. Kenney and M. G. Kanatzidis, J. Am. Chem. Soc., 2012, 134, 8579–8587 CrossRef CAS PubMed; (c) J. Zhang, S. Han, X. Liu, Z. Wu, C. Ji, Z. Sun and J. Luo, Chem. Commun., 2018, 54, 5614–5617 RSC.
- J. Zhang, X. Liu, X. Li, S. Han, K. Tao, Y. Wang, C. Ji, Z. Sun and J. Luo, Chem. – Asian J., 2018, 13, 982–988 CrossRef CAS PubMed.
- A. Zeb, Z. Sun, A. Khan, S. Zhang, T. Khan, M. A. Asghar and J. Luo, Inorg. Chem. Front., 2018, 5, 897–902 RSC.
- Z. Sun, X. Liu, T. Khan, C. Ji, M. A. Asghar, S. Zhao, L. Li, M. Hong and J. Luo, Angew. Chem., Int. Ed., 2016, 128, 6655–6660 CrossRef.
- (a) B. Saparov and D. B. Mitzi, Chem. Rev., 2016, 116, 4558–4596 CrossRef CAS PubMed; (b) M. M. Lee, J. Teuscher, T. Miyasaka, T. N. Murakami and H. J. Snaith, Science, 2012, 338, 643–647 CrossRef CAS PubMed; (c) G. Yang and H. Zhong, Chin. Chem. Lett., 2016, 27, 1124–1130 CrossRef CAS; (d) L. Cheng, Y. Cao, R. Ge, Y. Wei, N. Wang, J. Wang and W. Huang, Chin. Chem. Lett., 2017, 28, 29–31 CrossRef CAS; (e) H.-S. Kim, C.-R. Lee, J.-H. Im, K.-B. Lee, T. Moehl, A. Marchioro, S.-J. Moon, R. Humphry-Baker, J.-H. Yum, J. E. Moser, M. Gr-tzel and N.-G. Park, Sci. Rep., 2012, 2, 591 CrossRef PubMed.
- Z. Sun, X. Liu, T. Khan, C. Ji, M. A. Asghar, S. Zhao, L. Li, M. Hong and J. Luo, Angew. Chem., Int. Ed., 2016, 128, 6655–6660 CrossRef.
- L. Li, Z. Sun, P. Wang, W. Hu, S. Wang, C. Ji, M. Hong and J. Luo, Angew. Chem., Int. Ed., 2017, 56, 12150–12154 CrossRef CAS PubMed.
- L. Li, X. Shang, S. Wang, N. Dong, C. Ji, X. Chen, S. Zhao, J. Wang, Z. Sun, M. Hong and J. Luo, J. Am. Chem. Soc., 2018, 140, 6806–6809 CrossRef CAS PubMed.
- Z. Wu, C. Ji, L. Li, J. Kong, Z. Sun, S. Zhao, S. Wang, M. Hong and J. Luo, Angew. Chem., Int. Ed., 2018, 130, 8272–8275 CrossRef.
- B. Hailegnaw, S. Kirmayer, E. Edri, G. Hodes and D. Cahen, J. Phys. Chem. Lett., 2015, 6, 1543–1547 CrossRef CAS PubMed.
- (a) S. Zeng, Z. Sun, C. Ji, S. Zhang, C. Song and J. Luo, CrystEngComm, 2016, 18, 3606–3611 RSC; (b) K. Tao, Z. Wu, S. Han, J. Zhang, C. Ji, Y. Wang, W. Zhang, J. Luo and Z. Sun, J. Mater. Chem. C, 2018, 6, 4150–4155 RSC.
- P. Shi, Q. Ye, Q. Li, H. Wang, D. Fu, Y. Zhang and R. Xiong, Chem. Mater., 2014, 26, 6042–6049 CrossRef CAS.
- G. Mei and W. Liao, J. Mater. Chem. C, 2015, 3, 8535–8541 RSC.
- C. Ji, Z. Sun, S. Zhang, T. Chen, P. Zhou, Y. Tang, S. Zhao and J. Luo, J. Mater. Chem. C, 2014, 2, 6134–6139 RSC.
- Z. Sun, S. Zhang, C. Ji, T. Chen and J. Luo, J. Mater. Chem. C, 2014, 2, 10337–10342 RSC.
- J. Tauc, R. Grigorov and A. Vancu, Phys. Status Solidi B, 1966, 15, 627–637 CrossRef CAS.
- G. Kortum, W. Braun and G. Herzog, Angew. Chem., Int. Ed. Engl., 1963, 75, 653–661 Search PubMed.
- W.-Q. Liao, Y. Zhang, C.-L. Hu, J.-G. Mao, H.-Y. Ye, P.-F. Li, S. D. Huang and R.-G. Xiong, Nat. Commun., 2015, 6, 7338 CrossRef PubMed.
- X. Zheng, Y. Liu, G. Liu, J. Liu, X. Ye, Q. Han, C. Ge and X. Tao, Chem. Mater., 2016, 28, 4421–4431 CrossRef CAS.
- N. Leblanc, M. Allain, N. Mercier and L. Sanguinet, Cryst. Growth Des., 2011, 11, 2064–2069 CrossRef CAS.
- N. Leblanc, N. Mercier, M. Allain, O. Toma, P. Auban-Senzier and C. Pasquier, J. Solid State Chem., 2012, 195, 140–148 CrossRef CAS.
Footnote |
| † Electronic supplementary information (ESI) available. CCDC 1818903 (100 K), 1842454 (285 K) and 1842453 (330 K). For ESI and crystallographic data in CIF or other electronic format see DOI: 10.1039/c8qi01097h |
| This journal is © the Partner Organisations 2019 |

