
The long and the short of polymer grafting†
Lukas
Michalek‡
 a,
Kai
Mundsinger‡
a,
Christopher
Barner-Kowollik
*ab and
Leonie
Barner
*ac
a,
Kai
Mundsinger‡
a,
Christopher
Barner-Kowollik
*ab and
Leonie
Barner
*ac
aSchool of Chemistry, Physics and Mechanical Engineering, Institute for Future Environments, Queensland University of Technology (QUT), 2 George Street, QLD 4000, Brisbane, Australia. E-mail: leonie.barner@qut.edu.au; christopher.barnerkowollik@qut.edu.au; Web: http://www.macroarc.org
bMacromolecular Architectures, Institut für Technische Chemie und Polymerchemie (ITCP), Karlsruhe Institute of Technology (KIT), Engesserstrasse 18, 76128 Karlsruhe, Germany. E-mail: christopher.barner-kowollik@kit.edu
cInstitut für Biologische Grenzflächen (IBG), Karlsruhe Institute of Technology (KIT), Hermann-von-Helmholtz-Platz 1, 76344 Eggenstein-Leopoldshafen, Germany
First published on 16th November 2018
Abstract
We demonstrate that grafting a distribution of polymer chains onto an interface critically affects the shape of the distribution, with shorter chains being preferentially attached. This distortion effect is herein quantified for the first time, exploiting a quartz crystal microbalance – underpinned by single-molecule force spectroscopy – on the example of grafted poly(methyl methacrylate) (PMMA) chain distributions of different molar mass. ‘Grafting-to’ of different ratios of number average molecular weight of PMMA distributions unambiguously establishes the preferred surface grafting of shorter polymers, which can be correlated to their smaller radius of gyration. Our findings allow to establish a preferential grafting factor, k, which allows to predict the molar mass distribution of polymers on the surfaces compared to the initial distribution in solution. Our findings not only have serious consequences for functional polymer interface design, yet also for the commonly employed methods of grafting density estimation.
Polymers covalently attached to surfaces can exhibit different confirmations, primarily depending on the distance amongst tethering sites described by the grafting density σ.1 For densely grafted polymers, also referred to as ‘polymer brushes’,2 the interactions between the individual polymer chains are influencing essential surface properties including wettability,3 adhesion,4 tribological behaviour5 and biocompatibility.6 For surface functionalization, two main methods can be employed, i.e. the ‘grafting-to’ and the ‘grafting-from’ approach. The latter method is generally suggested to lead to higher grafting densities as polymers are grown in situ from the surface in a process driven by monomer diffusion.7 Thus, surface induced reversible deactivation radical polymerization (RDRP) techniques can yield dense polymer brushes.8 Nevertheless, the ‘grafting-from’ method suffers from lack of information about the degree of polymerisation (DP) and molar mass distribution (MMD) of the grafted polymer. In the ‘grafting-to’ approach, pre-fabricated polymers with suitable end-groups are tethered onto a surface.9 A critical advantage of the ‘grafting-to’ approach is that the bulk polymers can be characterized post-synthesis, prior to their surface attachment.10 Assuming the properties determined in solution, the DP and MMD, accurately reflect the properties of the surface-tethered polymers, ‘grafting-to’ provides comprehensive knowledge about the functionalized surface.1 However, this general assumption has never been experimentally tested and is questionable, as the preferential attachment of shorter over longer polymer chains appears possible due to diffusion, probability and geometrical effects.11
In the current study, we scrutinize this hypothesis by conducting quartz crystal microbalance (QCM) measurements of ‘grafting-to’ experiments and corroborate the results by atomic force microscopy (AFM) based single-molecule force spectroscopy (SMFS). QCM measurements enable the investigation of surface mass uptake by recording the frequency change of an oscillating piezo-electric quartz crystal induced by a mass change in the crystal's mass (attachment of polymer chains). These measurements can be performed with high precision, even in liquid environments.12 Most of the conducted QCM studies on polymer systems investigated grafting kinetics13 or conformational changes in the polymer brush14 with additional dissipation energy recording. The current work solely focuses on the overall mass uptake resulting from ‘grafting-to’ of end-functionalised poly(methyl methacrylate) PMMA chains on a silicon dioxide (SiO2) coated QCM sensor. The mass uptake Δm on a QCM sensor for rigid thin films in vacuum and air can be calculated by the measured change of resonance frequency Δf using the Sauerbrey equation [eqn (1)],15
 | (1) |
A reversible addition fragmentation chain transfer (RAFT) polymerization agent (CTA) functionalized with a silyl ether (refer to the ESI†CTA1)17 was employed to synthesize polymers P1 to P5via RAFT polymerization (ESI†P1–P5).18 The hydrolysis sensitive end group allowed tethering of the polymers to SiO2 coated QCM sensors under mild conditions. The attachment takes place via the R-group of the CTA, ensuring (almost) all chains carry the silane function. RAFT was employed to establish control over the molar mass and MMD as well as a high end group fidelity, rendering the need for post-functionalization obsolete. For the current study, polymers with five different number average molar masses Mn were synthesized (P1: Mn = 8240 g mol−1, P2: Mn = 48![[thin space (1/6-em)]](https://www.rsc.org/images/entities/char_2009.gif) 000 g mol−1, P3: Mn = 106000 g mol−1, P4: Mn = 133900 g mol−1 and P5: Mn = 216100 g mol−1, the MMD are depicted in Fig. 1A).
000 g mol−1, P3: Mn = 106000 g mol−1, P4: Mn = 133900 g mol−1 and P5: Mn = 216100 g mol−1, the MMD are depicted in Fig. 1A).
 | ||
| Fig. 1 (A) Normalised weight MMD of P1 (black), P2 (red), P3 (blue), P4 (green) and P5 (grey). (B) Time dependent grafting density σ of samples P1–P5 calculated by normalising the mass uptake. Mass uptake Δm was determined from Δf for n = 9 via [eqn (1)]. The small non-linearity in the black curve is due a gas bubble that formed during the experiment. A plateau in the grafting density was reached after 60 min and no change was subsequently observed. (C) Grafting density σ in dependency of the number averaged molecular weight Mn plotted in a double logarithmic graph and fitted to a power law. The exponent of the power law (slope in double logarithmic graph) can be related to the solvent interaction parameter n* (for PMMA in toluene at 50 °C).19 | ||
The polymer samples were dissolved in toluene and introduced into a QSense QCM flow cell with a flow rate of 15 μl min−1. The flow cell temperature was controlled to 50 °C and flushed with pure toluene to record a stable baseline. The frequency change associated with grafting of the polymer distributions onto the QCM sensor was recorded for all overtones n = 1, 3, 5, 7, 9, 11 and 13. However, the fundamental frequency (n = 1) was not taken into account for further evaluation, due to the insufficient energy trapping. Subsequent calculation of the absolute mass change Δm was performed according to eqn (1). Further normalization of the mass change by the respective number average molecular weight Mn of each polymer resulted in the grafting density σ = Δm/Mn. The resulting time dependent grafting density σ for each polymer sample (P1–P5) at an overtone number of n = 9 is shown in Fig. 1B. Before comparing the different grafting densities of P1 to P5, it is important to note that for our system and conditions the surface saturation results in one single plateau (regime) after approximately one hour. This is in contrast to literature results, which suggest the existence of up to four different regimes in the grafting kinetics.20 Such single regime kinetics occur at high temperatures and concentrations, when the energy barrier is sufficiently small to directly form a densely grafted layer in one step, as also observed in other studies.13b
The quantitative comparison of the grafting densities for polymer samples P1 to P5 sizes is depicted in Fig. 1C. The grafting densities estimated from overtones 3 to 13 (after 5000 s) were averaged and plotted vs. the number average molar mass Mn. The calculated data was subsequently fitted to a power-law. Thus, the slope represents the scaling behaviour ν of the grafting density as a function of the number averaged molar mass Mn. In a recent publication, we demonstrated that the grafting density σ for the ‘grafting-to’ approach is likely related to the radius of gyration Rg,19
 | (2) |
400 g mol−1.
To elucidate the bias towards lower molar mass chains during ‘grafting-to’, defined mixtures of polymers were immobilized on QCM sensors. By comparison of the molar ratio of the polymer samples in solution with the ratio of the polymers on the surface, we establish and quantify this bias. The aforementioned mixtures were prepared from polymers P1 (Mn = 8240 g mol−1) and P3 (Mn = 106000 g mol−1) as their MMDs do not overlap (Fig. 1A). The ratios chosen for the mixtures are R1 = 1:0 (P1![[thin space (1/6-em)]](https://www.rsc.org/images/entities/b_char_2009.gif) :P3), R2 = 1:1, R3 = 1:4, R4 = 1:9 and R5 = 0:1 (in molar equivalents). The evaluation of the ratios R2 to R4 is not as trivial as for the individual polymer solutions, where the frequency change (or mass uptake) was simply normalized by their number averaged molar mass in solution Msoln. If the frequency change is normalized by a hypothetical average molar mass calculated according to the employed ratios from the solution, the results show disparate ratios of short to long polymers on the surface compared to the solution. Fig. 2A shows the progress of the normalized frequency of the mixed samples. The black (R1) and grey (R5) curve represent the lower and upper limit for the normalized frequency changes for all other ratios as they represent the grafting of solely short and long chains, respectively. R3 (blue) and R4 (green) exceed these boundaries, indicating that the Mn in solution does not reflect the average molar mass of the grafted polymer. Instead, the Mn on the surface (Msurn) is substantially lower than in solution, which clearly demonstrates that shorter chains are preferentially grafted.
:P3), R2 = 1:1, R3 = 1:4, R4 = 1:9 and R5 = 0:1 (in molar equivalents). The evaluation of the ratios R2 to R4 is not as trivial as for the individual polymer solutions, where the frequency change (or mass uptake) was simply normalized by their number averaged molar mass in solution Msoln. If the frequency change is normalized by a hypothetical average molar mass calculated according to the employed ratios from the solution, the results show disparate ratios of short to long polymers on the surface compared to the solution. Fig. 2A shows the progress of the normalized frequency of the mixed samples. The black (R1) and grey (R5) curve represent the lower and upper limit for the normalized frequency changes for all other ratios as they represent the grafting of solely short and long chains, respectively. R3 (blue) and R4 (green) exceed these boundaries, indicating that the Mn in solution does not reflect the average molar mass of the grafted polymer. Instead, the Mn on the surface (Msurn) is substantially lower than in solution, which clearly demonstrates that shorter chains are preferentially grafted.
 | ||
| Fig. 2 (A) Time dependent frequency change for polymer mixtures R1 to R5 normalized by their average molar mass in solution MSoln. (B) Time dependent frequency change for R1 to R5 normalized by MSurn to match expected frequency behaviour. | ||
While this finding provides a qualitative description of the size bias in ‘grafting-to’, we also quantitatively establish to which extent shorter chains are preferentially grafted. If the molar mass – or rather the radius of gyration – influences the grafting density as demonstrated above, an equimolar mixture of two polymer samples should ideally result in an averaged grafting density of the individual polymer samples. The same should be true for mixtures of different ratios, i.e. the grafting density of a mixture should be the weighted average based on the molar ratio of its components.
We introduce the value Msurn (Table 1) to describe the molar mass average of the polymers on the surface to establish the expected grafting densities (Fig. 2B). The molar mass averages of the surface attached polymers are well below their known corresponding mass averages in solution (MsolnTable 1). Thus conclusively indicating a preferential attachment of shorter chains. When we compare the ratio of the surface mass average to the mass average in solution obtaining a preferential grafting factor κ = 3.36 ± 0.58, we demonstrate that P1 (Mn = 8240 g mol−1) is grafted preferentially to the surface compared to the P3 (Mn = 106000 g mol−1) sample. Interestingly, the experimentally established preferential grafting factor κ is in excellent agreement with the polymer samples’ ratio of their radii of gyration of 3.32 [eqn (3)], establishing a comprehensive physical explanation for the grafting bias.
 | (3) |
| Sample | Composition [P1:P3] |
Norm. Msoln [g mol−1] | Norm. Msurn [g mol−1] | Preferential grafting factor |
|---|---|---|---|---|
| R1 | 1:0 |
8240 | 8240 | — |
| R2 | 1:1 |
57100 |
17500 |
3.26 ± 0.39 |
| R3 | 1:4 |
86400 |
20200 |
4.29 ± 0.96 |
| R4 | 1:9 |
96200 |
37900 |
2.54 ± 0.38 |
| R5 | 0:1 |
106000 |
106000 |
— |
| Avg.: | 3.36 ± 0.58 |
The short-chain grafting preference, however, is not merely relevant when samples of different molar masses are to be grafted. It is just as important when well-defined narrow disperse polymers are grafted. Even the most sophisticated contemporary polymerization methods yield dispersities far from unity. Thus, polymer chemists effectively always employ mixtures of polymers with different molar masses, in fact even in a fairly narrow MMD, such as P1, only approximately 1.5% of the polymer chains correspond to the Mn of 8240 g mol−1 and the chains within the sample cover a range of molar masses from 3500 g mol−1 to 17400 g mol−1. Based on our current results, we can now quantitatively predict how the MMD is affected upon immobilization onto the substrate, taking the ratios of Rg within a given polymer sample into account. The preferential grafting factor κ expresses by how much the molar mass of interest Mi is preferred or unfavoured over the molar mass average Mn of the sample.
 | (4) |
To predict the grafting behavior of a polymer sample, it is necessary to know the number weighted molar mass distribution MMDn of the sample, which can be obtained by size exclusion chromatography (SEC) employing concentration sensitive detectors (Fig. S3–S7†).
The number and mass weighted distributions of P1, P3 and P5 are depicted in Fig. 3A/B. One important observation in the MMDn is that the majority of chains (62%) for sample P5 (Fig. 3B) is below the Mn, which is not obvious when inspecting the mass weighted distribution.
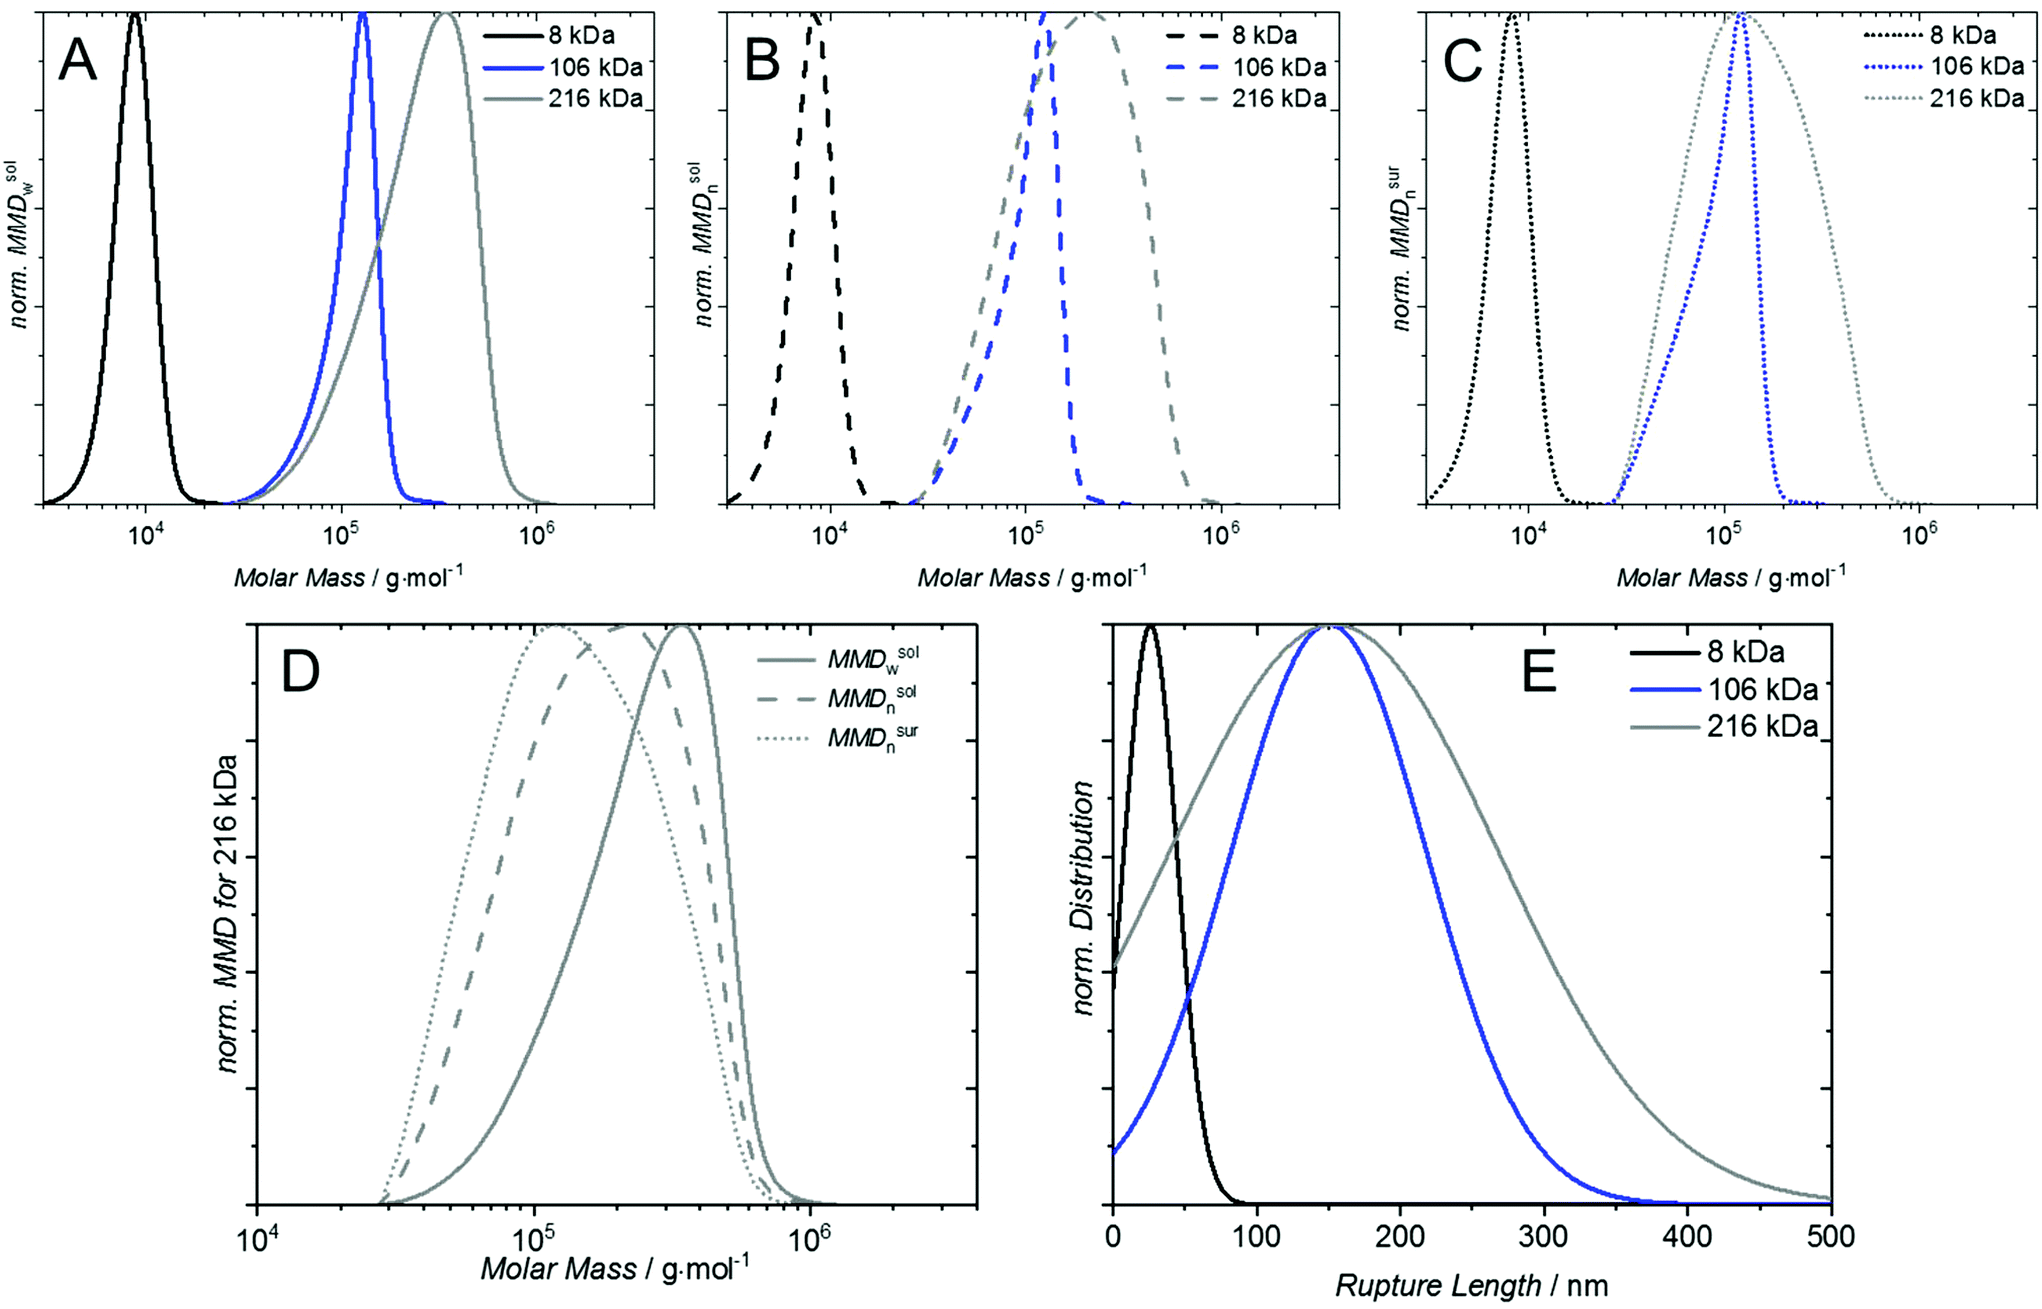 | ||
| Fig. 3 (A) Normalized mass weighted distribution in solution MMDsolw, (B) normalized number weighted distribution in solution MMDsoln and (C) normalized number weighted distribution on surfaces MMDsoln for P1 (black curves), P2 (blue curves) and P3 (grey curves). (D) Shift of the molar mass distributions MMDsolw (solid line), MMDsoln (dashed line) and MMDsurw (dotted line) of P5. (E) Normalized Gaussian distribution of the rupture length determined via SMFS experiments from sample P1, P2 and P3. | ||
To estimate the molar mass distribution on the surface, the MMDn in solution is multiplied with κ, which shifts the distribution further towards lower molar masses (Fig. 3C) – under the provision that each chain in the distribution has a reactive end group. For rather small polymers below 100000 g mol−1 this shift is almost negligible, however for large polymers it is substantial. For P1, for instance, κ is 1.5 at 3500 g mol−1 and 0.7 at 17500 g mol−1 implying that the lower end of the distributions is approximately twice as likely to be grafted as its upper end. For P5, κ is 2.6 at 28000 g mol−1 and 0.4 at 1240000 g mol−1, implying the lower end is more than six times probable to be grafted than the upper end of the distribution. ‘Grafting-to’ with high molar mass samples therefore requires special attention to address the mismatch of the SEC derived molar mass distribution with the actually grafted chain distribution (see Fig. 3D shift of solid to dotted line). To confirm the prediction of preferential surface grafting of shorter polymer chains, AFM based SMFS measurements were conducted. The normalized Gaussian distributions of the recorded rupture length lR are depicted in Fig. 3E for sample P1 (lR = 26 ± 3 nm), P3 (lR = 150 ± 9 nm) and P5 (lR = 154 ± 15 nm). The expected shift from different peak maxima in solution (see Fig. 3A) to the same peak maximum on a surface of P3 and P5 (see Fig. 3C) is confirmed by the same average rupture length. A detailed description of these experiments can be found in the ESI.†
In summary, we demonstrate and quantify to which extent a polymer distribution is distorted when grafted from solution onto a surface. We furthermore evidence that this distortion can be quantitatively related to the radius of gyration, thereby providing a physical explanation for the phenomenon. These results will critically affect methods for the determination of the grafting density that rely on information of the number average molecular weight of the grafted polymers, including the ‘dry thickness’ method or ‘gravimetric measurements’.18 We suggest a simple, yet quantitative measure, κ, to predict the likelihood of certain polymer masses within a sample to be grafted. The preferential grafting factor κ allows for the prediction of the grafted distribution, effectively enabling quantitative access to grafted chain size distribution.
Conflicts of interest
The authors declare no conflict of interests.Acknowledgements
L. B. and C. B.-K. acknowledge funding from the Australian Research Council (ARC) in the form of a Linkage project funding K. M.'s PhD studies. C. B.-K. acknowledges generous funding in the context of an ARC Laureate Fellowship as well as continued key support by the Queensland University of Technology (QUT). L. B. is grateful for continued support by the Institute of Future Environments (IFE). Some of the data reported in the current study were obtained at the Central Analytical Research Facility (CARF) operated by the IFE. This work was performed in part at the Queensland node of the Australian National Fabrication Facility (ANFF), a company established under the National Collaborative Research Infrastructure Strategy to provide nano- and microfabrication facilities for Australia's researchers.References
- B. Zhao and W. J. Brittain, Prog. Polym. Sci., 2000, 25, 677–710 CrossRef CAS.
- F. Zhou and W. T. S. Huck, Phys. Chem. Chem. Phys., 2006, 8, 3815–3823 RSC.
- K. Matyjaszewski, Prog. Polym. Sci., 2005, 30, 858–875 CrossRef CAS.
- Y. Akiyama, A. Kikuchi, M. Yamato and T. Okano, Langmuir, 2004, 20, 5506–5511 CrossRef CAS.
- M. Singh, P. Ilg, R. Espinosa-Marzal, N. Spencer and M. Kröger, Polymers, 2016, 8, 254 CrossRef.
- S. Guo, Q. Zhang, D. Wang, L. Wang, F. Lin, P. Wilson and D. M. Haddleton, Polym. Chem., 2017, 8, 6570–6580 RSC.
- H.-A. Klok and J. Genzer, ACS Macro Lett., 2015, 4, 636–639 CrossRef CAS.
- (a) J. Glasing, J. Bouchard, P. G. Jessop, P. Champagne and M. F. Cunningham, Polym. Chem., 2017, 8, 6000–6012 RSC; (b) C. Kang, R. Crockett and N. D. Spencer, Polym. Chem., 2016, 7, 302–309 RSC; (c) M. Enayati and A. Abbaspourrad, Polym. Chem., 2017, 8, 7457–7468 RSC.
- I. Luzinov, D. Julthongpiput, H. Malz, J. Pionteck and V. V. Tsukruk, Macromolecules, 2000, 33, 1043–1048 CrossRef CAS.
- M. Kim, S. Schmitt, J. Choi, J. Krutty and P. Gopalan, Polymers, 2015, 7, 1346 CrossRef CAS.
- H. Lizhong and N. Bernd, Biotechnol. Prog., 2003, 19, 544–548 CrossRef PubMed.
- (a) J. Auge, P. Hauptmann, J. Hartmann, S. Rösler and R. Lucklum, Sens. Actuators, B, 1995, 24, 43–48 CrossRef CAS; (b) H. Y. Yoo, S. Bruckenstein and E. Pater, Russ. J. Electrochem., 2017, 53, 1160–1164 CrossRef CAS; (c) F. Höök, B. Kasemo, T. Nylander, C. Fant, K. Sott and H. Elwing, Anal. Chem., 2001, 73, 5796–5804 CrossRef.
- (a) H. Tanoue, N. L. Yamada, K. Ito and H. Yokoyama, Langmuir, 2017, 33, 5166–5172 CrossRef CAS PubMed; (b) X. Sha, X. Xu, K. Sohlberg, P. J. Loll and L. S. Penn, RSC Adv., 2014, 4, 42122–42128 RSC; (c) S. E. Moya, A. A. Brown, O. Azzaroni and W. T. S. Huck, Macromol. Rapid Commun., 2005, 26, 1117–1121 CrossRef CAS; (d) L. S. Penn, H. Huang, M. D. Sindkhedkar, S. E. Rankin, K. Chittenden, R. P. Quirk, R. T. Mathers and Y. Lee, Macromolecules, 2002, 35, 7054–7066 CrossRef CAS; (e) G. Liu, L. Yan, X. Chen and G. Zhang, Polymer, 2006, 47, 3157–3163 CrossRef CAS; (f) F. Höök, J. Vörös, M. Rodahl, R. Kurrat, P. Böni, J. J. Ramsden, M. Textor, N. D. Spencer, P. Tengvall, J. Gold and B. Kasemo, Colloids Surf., B, 2002, 24, 155–170 CrossRef.
- (a) Z. Guangzhao and W. Chi, Macromol. Rapid Commun., 2009, 30, 328–335 CrossRef; (b) R. Ortiz, S. Olsen and E. Thormann, Langmuir, 2018, 34, 4455–4464 CrossRef CAS.
- G. Sauerbrey, Z. Phys., 1959, 155, 206–222 CrossRef CAS.
- M. V. Voinova, M. Rodahl, M. Jonson and B. Kasemo, Phys. Scr., 1999, 59, 391 CrossRef CAS.
- K. A. Gunay, N. Schuwer and H.-A. Klok, Polym. Chem., 2012, 3, 2186–2192 RSC.
- G. Moad, Y. K. Chong, A. Postma, E. Rizzardo and S. H. Thang, Polymer, 2005, 46, 8458–8468 CrossRef CAS.
- L. Michalek, L. Barner and C. Barner-Kowollik, Adv. Mater., 2018, 30, 1706321 CrossRef.
- S. Zhang, T. Vi, K. Luo and J. T. Koberstein, Macromolecules, 2016, 49, 5461–5474 CrossRef CAS.
- (a) L. D. Unsworth, H. Sheardown and J. L. Brash, Langmuir, 2008, 24, 1924–1929 CrossRef CAS; (b) V. Zoulalian, S. Zürcher, S. Tosatti, M. Textor, S. Monge and J.-J. Robin, Langmuir, 2010, 26, 74–82 CrossRef CAS.
Footnotes |
| † Electronic supplementary information (ESI) available. See DOI: 10.1039/c8py01470a |
| ‡ These authors contributed equally to this work. |
| This journal is © The Royal Society of Chemistry 2019 |