
Water-soluble copper(I) complexes bearing 2,2′-bicinchoninic acid dipotassium salt with red-light absorption and repeatable colour change upon freezing operation†
Yuma
Saito
,
Michihiro
Nishikawa
 * and
Taro
Tsubomura
*
* and
Taro
Tsubomura
*
Department of Materials and Life Science, Seikei University, 3-3-1 Kichijoji-kitamachi, Musashino-shi, Tokyo, 180-8633, Japan. E-mail: tsubomura@st.seikei.ac.jp; Fax: +81-422-37-3871; Tel: +81-422-37-3752
First published on 14th November 2018
Abstract
We newly synthesized a copper(I) complex bearing a 2,2′-bicinchoninic acid dipotassium salt (biq(COOK)2) ligand and characterized the complex by elemental analysis, NMR and UV-vis spectroscopy, and electrochemistry with the help of comparative compounds. The complex in water shows intense absorption in the red light region due to metal to ligand charge transfer. The wavelength value at the absorption maximum of the charge transfer, λabs_max, is 556 nm, and the value of the molar extinction coefficient, ε, at the shoulder of the absorption at 670 nm is 1 × 10³ M−1 cm−1. The water solution is purple, and the frozen one is green. The colour change is repeatable. The colour change is not observed when DMSO and ethanol are used. The UV-vis spectra related to absorption using an integrated sphere of the water solution and a frozen one show the repeatable colour change.
Introduction
Water-soluble metal complexes bearing π-conjugated organic ligands with efficient red-light absorption are important for light-energy conversion.1 Organic-solvent-soluble copper(I) complexes attract attention for photosensitizers; one of the advantages is that copper is an abundant metal.2,3 Bis(diimine)copper(I) complexes have also been well-studied;4–7 to date, one of the typical chelating diimine ligands, 2,9-dimethyl-1,10-phenanthroline (dmp) and its derivatives has been shown to form complexes which have been characterized by several measurements such as single X-ray structural and spectroscopic analysis.4–7 The complex is known to exhibit intense visible light absorption due to metal to ligand charge transfer (MLCT) transition.4 An increase in red-light absorption of [Cu(biq)2]BF4 (biq = 2,2′-biquinoline) compared to that of [Cu(dmp)2]BF4 (dmp = 2,9-dimethyl-1,10-phenanthroline) has been reported.5,6 The structure and luminescence properties of [Cu(dmp)2]Cl have been reported.7 The copper(I) complex favours a four coordinate tetrahedral geometry.4 The redox potential of the bis(diimine)copper(I) complex bearing dmp is more positive than that bearing 1,10-phenanthroline.4f The introduction of the methyl groups destabilizes the copper(II) state, which favours different geometries such as trigonal bipyramidal and square planar.4f A bis(diimine)copper(I) complex using 2,2′-bicinchoninic acid (biq(COOH)2) with the organic protonated triethylamine cation was synthesized, and data were investigated using an organic solvent.8 The complex was used to study its application for the development of dye-sensitized solar cells.8 Water-soluble copper(I) complexes bearing 2,9-dimethyl-4,7-bis(sulfonatophenyl)-1,10-phenanthroline,9 pyridylimine,10 and 2,9-dimethyl-4,7-bis(sulfonatophenyl)1,10-phenanthroline,11 have been reported. Several mentions related to biq(COOH)2, copper(I) complexes, and water were described in the literature.12–14 A method for the determination of total reducing capacity by using the absorption spectrum of Cu(II) and Cu(I) in the presence of biq(COOH)2 in a buffered solution has been reported.14 Additionally, 2,2′-bicinchoninic acid has been used as a probe for copper(I) ions in biological molecules.15 For example, copper(I) ions in protein are analyzed by this ligand through ligand substitution reactions.15 However, reports of intense red-light absorption in water based on copper(I) complexes are very rare. Additionally, demonstration of chemical stabilities in water has not been reported yet.Frozen water, ice, is one of the recent topics of interest in chemistry.16–18 Colour changes exhibited by freezing aqueous organic molecules such as aggregates17 and pH indicators18 have also been examined, and the colour change upon freezing is examined by UV-vis absorption spectroscopy using an integrated sphere.17 Repeatable colour changes in frozen water using metal complexes are promising for indicators of ice, utilization of ice in chemistry, and other functional materials. However, to the best of our knowledge, the effects of freezing operations of solutions, especially water, on copper(I) complexes from the viewpoint of qualitative analysis of colour as well as quantitative analysis using UV-vis absorption spectroscopy have been rarely reported. Demonstration of repeatable colour changes during freezing operation is very rare as well.
We have studied the emission and redox properties of copper(I) complexes bearing diimine ligands.19–22 In this manuscript, we provide detailed information about chemical stabilities by employment of the copper(I) complex, 1, bearing 2,2′-bicinchoninic acid dipotassium salt (biq(COOK)2) (Scheme 1); the elemental analysis, NMR, infrared (IR), and ultraviolet-visible (UV-vis) spectroscopy, and electrochemistry increase the validity that the powder is the coordination salt of the bis(diimine)copper(I) complex, K3[Cu(biq(COO)2)2], which is a new compound. We also employed comparative powders prepared from 2,2′-bicinchoninic acid disodium salt (biq(COONa)2), biq(COOH)2, and biq to examine 1 made of biq(COOK)2 (Scheme 1); we note that bis(diimine)copper(I) complexes using biq(COOH)214 and biq5 are known compounds. Additionally, we demonstrated drastic repeatable colour changes in water during freezing and melting operations using 1.
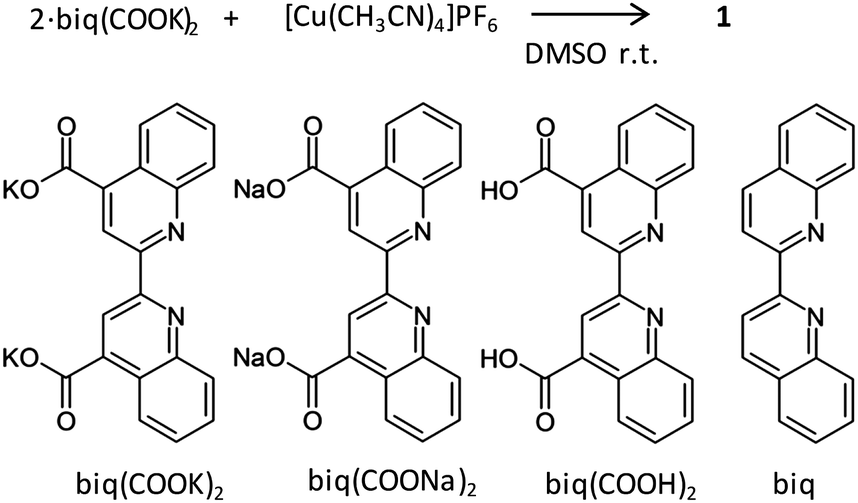 | ||
| Scheme 1 Procedure for preparation of 1. (bottom) Chemical structures of diimine ligands, biq(COOK)2, biq(COONa)2, biq(COOH)2, and biq. | ||
Results and discussion
Synthesis and characterization
We prepared a purple solid of new compound, 1, by a reaction of two equiv. of the free ligand, biq(COOK)2, and one equiv. of [Cu(CH3CN)4]PF6 in dimethylsulfoxide (DMSO) at room temperature (Scheme 1). The elemental analysis, and 1H NMR, and 13C NMR spectroscopy of 1 enhance the validity that the chemical formula is K3[Cu(biq(COO)2)2]·4H2O (Table S1 and Fig. S1, S2 in the ESI†). One set of 1H NMR signals of 1 in D2O at room temperature can be assigned to the diimine moiety of the bis(diimine)copper(I) complex (Fig. S1, ESI†). The 10 signals of 13C NMR of 1 in D2O support the assignment (Fig. S2, ESI†). In order to examine 1, we prepared a powder of the complex (2) by employing biq(COONa)2, and the 1H NMR signals in D2O were very similar to those of 1 (Fig. S2, ESI†). The chemical shifts of all signals of 1 and 2 are within 0.02 ppm, indicating that the chemical conditions of protons of the ligands are independent of the type of hard alkali metal cation, Na+ and K+. One of the possible explanations is that the distance between the protons of the diimine moiety and the cation is very large resulting in negligible interaction between the cation and the diimine moieties. Both powders are soluble in water and form a purple coloured solution. We also prepared powders of complexes 3 and 4 by employing, biq(COOH)2, and biq, and the 1H NMR signals of these powders in acetone-d6 were considerably similar to those of 1 (Fig. S4 and S5, ESI†). The solubility of 1 and 2 in water is much enhanced compared to 3 and 4. The infrared (IR) spectrum of the KBr pellets of 1 shows negligible signal of the PF6 ion which often shows a strong peak in the range from 830 to 870 cm−1 (Fig. S6, ESI†). The strong IR peak at 1600 cm−1, where the carboxylate group is often observed, of 1 is observed, indicating that the powder of 1 contains COOK groups, and COOH group is negligible in 1; these results are consistent with the result of the comparative powder, 3 (Fig. S7, ESI†).The transmission UV-vis absorption spectrum of 1 in ethanol at room temperature under air is displayed in Fig. S8 (ESI†). The shape of the absorption spectrum of 1 in ethanol is similar to that of typical bis(diimine)copper(I) complexes in organic solvent.4 Moreover, the value of the wavelength of the absorption maximum, λabs_max, is 556 nm, which is very similar to those of [Cu(biq)2]+ derivatives.6 The absorption is due to MLCT transition, because intense visible light absorption of many of the bis(diimine)copper(I) complexes is often attributed to MLCT.4–6 The shapes of the absorption spectra of 3 and 4 in an organic solvent are similar (Fig. S9, ESI†) to that of 1. Therefore, this result evidences that the main species in the ethanol solution of 1 is the bis(diimine)copper(I) complex.
Photophysics, electrochemical properties, and chemical stabilities in water are investigated. The absorption spectrum of 1 in water is similar to that in ethanol, indicating that the main chemical species in water is the bis(diimine)copper(I) complex (Fig. 1a and Fig. S9, ESI†). Intense absorption in the red light region was observed; the values of molar extinction coefficient, ε, are 6 × 10³ M−1 cm−1 at λabs_max = 560 nm, and 1 × 10³ M−1 cm−1 at the shoulder at 670 nm. Because the energy of MLCT absorption is sufficiently in the range of red light absorption, high efficiency of the red light absorption is achieved; details are discussed in the calculation section. In the case of an organic solvent, the efficiency of the absorptions in the red light region of [Cu(dmp)2]+ and [Cu(dpp)2]+ (dpp = 2,9-diphenyl-1,10-phenanthroline) are known to be much less than that of [Cu(biq)2]+ which is similar to that of the absorption of aqueous 1.5b,6
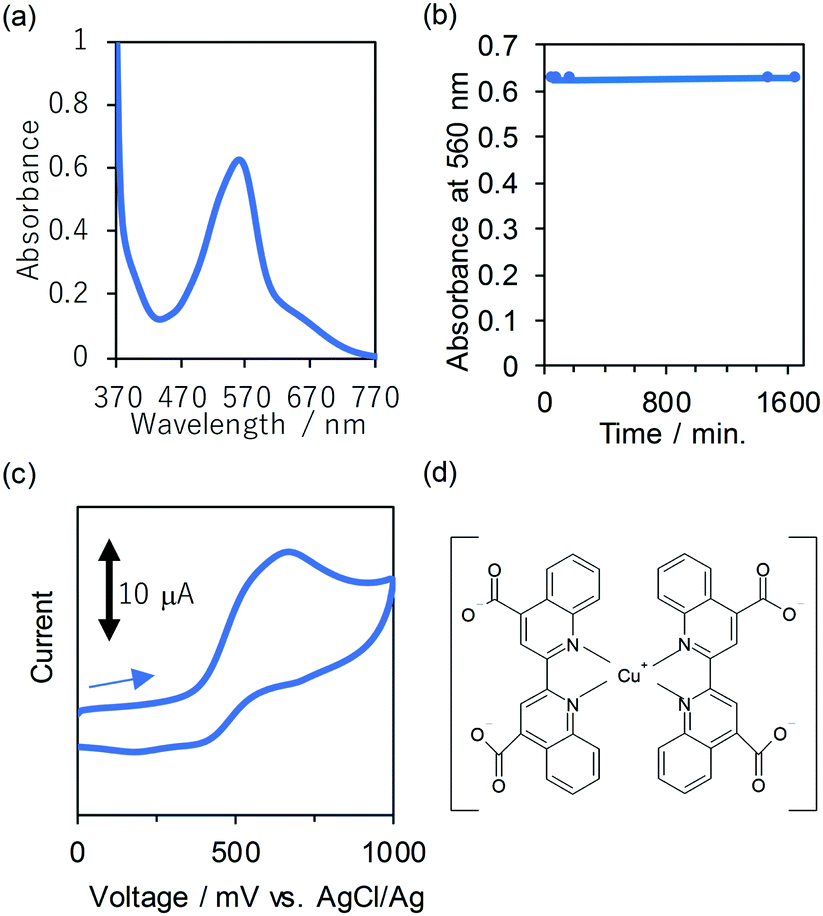 | ||
| Fig. 1 (a) Transmission UV-vis absorption spectrum of aqueous 1 at room temperature under air. (b) Changes in the absorbance at 560 nm immediately after dissolving 1 in water (0 min) and after different time intervals (30 min, 60 min, 90 min, 180 min, 1480 min and 1660 min) at room temperature under ambient conditions. Dots indicate the data points. Some of the transmission absorption spectra are displayed in Fig. S10 (ESI†). (c) Cyclic voltammogram of 1 in 0.1 M water–KCl solution at a scan rate of 100 mV s−1. (d) Proposed chemical structure of 1 with the bis(diimine)copper(I) complex. Potassium counter cations are omitted for clarity. | ||
The high stability in water under air at room temperature was shown from the result that the spectrum of 1 in water remains constant at room temperature under the ambient conditions (Fig. 1b and Fig. S10, ESI†). The time course of the changes in the absorbance at 560 nm is negligible (Fig. 1b). The oxidation of the copper(I) complex is known to cause drastic decrease of the absorption.2c,4 Indeed, the chemical oxidation of the solution of 1 by the strong oxidizing agent, (NH4)2(Ce(NO3)6), causes drastic decrease of the absorption in the visible light region (Fig. S11, ESI†). Therefore, the chemical degradation of the aqueous 1 due to oxidation is negligible. The shape of the spectrum of the powder of 2 in water is almost identical to that of 1, suggesting that both 1 and 2 are soluble in water (Fig. S9, ESI†). The value of λabs_max of the powder of 2 in water is 560 nm which is the same as that of 1 in water considering experimental error, and this result provides further supporting evidence. The negligible difference also supports the negligible interaction between the hard alkali metal cation, K+ or Na+, and the aromatic moieties which plays a key role in the absorption in the visible light region. Consequently, the proposed chemical structure of 1 is shown in Fig. 1d, considering the results of NMR, IR, and comparative study of UV-vis spectroscopy.
The shapes of the spectra in a buffer solution of 1 using carbonate solution (pH = 10.01) and phthalate solution (pH = 4.01) 20 min after dissolving the solution are very similar to that in pure water (Fig. S12 and S13, ESI†). The negligible difference in the absorption spectra after dissolving the solution between the buffered solution and pure water shows that the present copper(I) complex is sufficiently stable in the buffered solution under the experimental conditions. The spectrum at 20 min after dissolving the sample in carbonate solution (pH = 10.01) is very similar to that at 60 min; this trend is also observed by using phthalate solution. Therefore, both pH changes and salt effects in water under air are very small within several minutes, supporting the stability of the present Cu(I) complex.
The cyclic voltammogram in 0.1 M water–KCl solution at room temperature under an argon atmosphere is shown in Fig. 1c. The oxidation wave is observed at Epa = 0.7 V (anodic peak potential, vs. AgCl/Ag). Since the value of redox potential of a strong oxidizing agent, (NH4)2(Ce(NO3)6), is larger than that of 1, the oxidation reaction of 1 by (NH4)2(Ce(NO3)6) is thermodynamically favourable. Therefore, the result supports the absorption decrease of 1 due to oxidation in the presence of a strong oxidizing agent, (NH4)2(Ce(NO3)6). The oxidation waves of bis(diimine)copper(I) complexes5c,8 are often known to be observed around this region; for example [Cu(biq)2]+ 0.88 vs. SCE in CH3CN.5c Therefore, the results could support that the powder of 1 contains bis(diimine)copper(I) complex species. As the bulky biquinoline ligand sufficiently destabilizes the oxidized species such as the copper(II) state, which favours a square planar geometry, the redox potential of the powder of 1 is high, leading to high stability under air.
By using the proposed chemical structure, we performed DFT calculation of the bis(diimine)copper(I) complex of 1. The geometry of the copper(I) ion bearing four nitrogen atoms in two chelating biqCOO− ligands is observed after singlet-optimization (Fig. 2). Kohn–Sham orbitals of HOMO and HOMO−1, which are similar to that of the HOMO, are mainly located at the copper atom (Fig. 2). The orbitals significantly consist of carboxylate groups. On the other hand, the LUMO is mainly located at the extended aromatic group containing nitrogen atoms on the biqCOO− diimine moieties (Fig. 2); the nature of the orbital of LUMO+1 is similar to the LUMO. The TD-DFT calculation for the lowest energy of the singlet calculated using the singlet-optimized structure with the large oscillator strength is as follows: the calculated wavelength, λ = 607 nm, the oscillator strength, f = 0.1915, the important components with two largest values HOMO−1 → LUMO+1 0.488, and HOMO → LUMO 0.481 (Table S1, ESI†). The transition corresponds to MLCT from the copper to the diimine moieties. The experimental absorption maximum, 560 nm in water, is sufficiently similar to that of the calculated one. The nature of the transitions is typical for the well-known bis(diimine)copper(I) complexes using the 1,10-phenanthroline derivatives.4 The TD-DFT calculation using the plausible chemical structure is consistent with the experimental intense visible light absorption. The results also support the plausible chemical structure (Table 1).
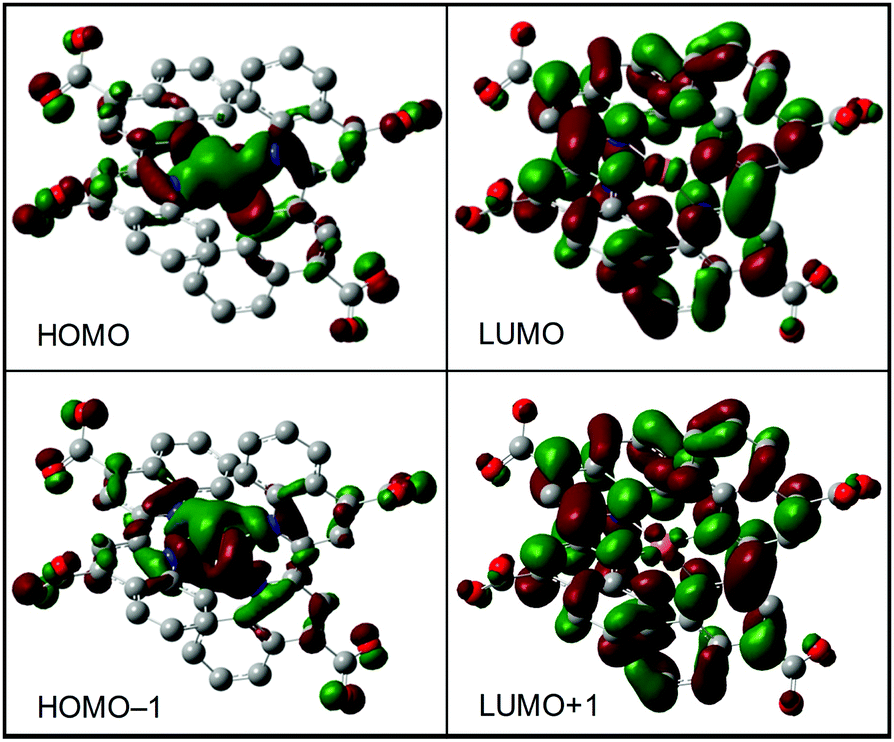 | ||
| Fig. 2 Kohn–Sham orbitals of the HOMO (left) and LUMO (right) of the singlet-optimized structure using the proposed chemical structure displayed in Fig. 1d. | ||
| λ/nm | f | Components | Coefficients |
|---|---|---|---|
| 694 | 0.0000 | HOMO−1 → LUMO+1 | −0.467 |
| HOMO → LUMO | 0.474 | ||
| 663 | 0.0000 | HOMO−1 → LUMO | 0.495 |
| HOMO → LUMO+1 | −0.492 | ||
| 607 | 0.1915 | HOMO−1 → LUMO+1 | 0.488 |
| HOMO → LUMO | 0.481 | ||
Repeatable colour change upon water freezing–melting
There are possibilities that 1 can be converted into different green-coloured materials which can easily be restored into the initial state in water (Fig. 3a and b). The colour of the aqueous 1 is purple. After freezing the solution, the colour of the formed ice is pale green. After heating the ice, the solution turns purple again. The colour changes are totally repeatable by these operations. The photograph in the movie upon freezing operations also indicates that the green-coloured materials are formed uniformly upon the operation (Fig. 3b). The time course of the photographs of 1 in water upon the freezing operation shows that the purple-coloured solution in water and the green-coloured materials in ice coexist in ice-water (Fig. 3b). The purple water solution of 1 at room temperature was directly put into a normal freezer, and the solution was kept from several hours to several days. This slow cooling operation was found to form the green-coloured ice. The fast cooling operation of the purple solution of 1 in a cooling bath using dry ice and acetone was found to form the green-coloured ice immediately. The results are similar to that by slow cooling in normal freezers. The transmission absorption spectra of the water solution of the initial state and after 7 times operations were very similar (Fig. S14, ESI†). The results suggest that unrepeatable reaction is very small upon these operations. | ||
| Fig. 3 (a) Conceptual diagram for the repeatable colour change upon freezing operation using the photographs of the water solution of 1 in water (left) and ice (right). (b) Time course of the photographs in a movie upon the freezing operations of 1 in water starting from left top to middle top, right top, left bottom, middle bottom, and right bottom. (c–f) UV-vis spectra related to absorption using an integrated sphere of 1 in liquid water (c), frozen water (d), liquid DMSO (e), and frozen DMSO (f). | ||
The colour change is observed using degassed water by argon bubbling (Table 2). The results indicate that the effects of the presence of dissolved dioxygen molecules on the colour change are very small. Since dioxygen molecules often lead to diminishing of the absorbance through the chemical reaction of the copper(I) complex, the evidence is important that the colour change is caused by the special environment of frozen water. Additionally, the colour change proceeds by using D2O, suggesting that the effects of the difference in hydrogen and heavy hydrogen atoms are also very small. In contrast, the colour change is negligible in the freezing operation of dimethylsulfoxide and ethanol (Table 2). The results indicate that the effects of the uniqueness of frozen water are much larger than those of general factors of freezing operation, such as increment of rigidity of the medium. Therefore, these results indicate that both the freezing operation and water are very important for the repeatable colour change. The colour change is negligible using the [Cu(dmp)2]Cl7 complex, suggesting that 1 is different from other copper(I) complexes. The results indicate that the effects of features of the present complex, such as the biquinoline moiety, carboxylate groups, and others, are much larger than those of the metal centre and character of the bis(diimine)copper(I) complex.
| Solvent | Solution | Frozen solution | Colour change upon freezing |
|---|---|---|---|
| H2O | Purple | Green | Yes |
| Degassed H2O | Purple | Green | Yes |
| D2O | Purple | Green | Yes |
| DMSO | Purple | Purple | Negligible |
| Ethanol | Purple | Purple | Negligible |
H2O/ethanol 1![[thin space (1/6-em)]](https://www.rsc.org/images/entities/char_2009.gif) :1 :1 |
Purple | Purple | Negligible |
UV-vis spectra related to absorption using an integrated sphere (Fig. 3c) are sufficiently similar to the transmission UV-vis absorption spectrum (Fig. 2a). The spectrum of the green frozen water solution of 1 (Fig. 3d and Fig. S15, ESI†) is largely different from that in purple liquid water solution of 1 (Fig. 3c and Fig. S15, ESI†). The spectrum of the green frozen water shows a vague peak at around 650 nm, and vague increment at around 400 nm shows large relative absorptivity of red and blue light compared to green light (Fig. 3d). The spectrum of the green frozen solution reflects the colour of the frozen solution (Fig. 3d). The results agree with our naked eye observation and photograph as well. One of the possible explanations is that the direct irradiation of this sample increases the ratio of the absorption compared to other factors related to light, therefore, the spectrum using an integrated sphere shows relative absorptivity. The spectrum in a liquid DMSO solution of 1 is very similar to that in frozen DMSO solution, indicating that alignment of DMSO molecules did not affect the colour of the material (Fig. 3e and f). The spectrum of the liquid H2O solution of 1 (Fig. 3c) is similar to that of DMSO (Fig. 3e), and the spectrum of the frozen water solution of 1 (Fig. 3d) is very different from that of frozen DMSO (Fig. 3f), indicating that alignment of water is very important for the colour change. The spectra of 1 in liquid H2O at 10−4 M, frozen H2O at 10−4 M, liquid H2O at 10−3 M, and frozen H2O at 10−3 M are displayed in Fig. S15 (ESI†). The changes in the spectra upon freezing operation are similar to those in Fig. 3, indicating that the concentration of the solution of the complex in a range from 10−4 M to 10−3 M did not affect the essence of the repeatable colour change upon freezing–melting operation. The spectroscopic changes upon freezing operation in carbonate pH standard solution (pH 10.01) which consists of water (99 wt%), Na2CO3 (0.3 wt%), and NaHCO3 (Fig. S16a and b, ESI†) are very similar to those in pure water (Fig. 3c and d). The spectroscopic changes upon freezing–melting operation in tetraborate pH standard solution (pH = 9.18) which consists of water and sodium tetraborate decahydrate (Fig. S16c and d, ESI†) are also similar to those in pure water (Fig. 3c and d). The colour change proceeds not only in pure water but also in buffered solution, indicating that the phenomenon seems to occur in water even in the presence of these inorganic salts mentioned above.
One or several factors including collaborative effects of concentration increment, structural changes, and chemical reactions could be the reason for the colour change. The experimental evidence of the reason are as follows: (i) changes in temperature did not affect the colour change, (ii) dissolved dioxygen did not affect the colour change, (iii) changes in rigidness did not affect the colour change, considering the result of organic solvents, (iv) the typical water-soluble bis(dmp)copper(I) complex did not induce the colour change, and (v) the colour change is observed even by using D2O. The freezing operation can induce several changes such as temperature in part, concentration of the dissolved dioxygen, rigidness of the medium, chemical reactivity, and others, and most of them can be excluded from these experimental results. Therefore, one of the reasons why the repeatable colour change upon the freezing operation proceeds can be explained by one or several factors including their collaborative effects such as (i) concentration increment which induces aggregation of the bis(diimine)copper(I) complexes, (ii) structural changes related to the dihedral angles of the two ligand planes, and (iii) chemical reactions such as ligand substitution reactions. The three factors are described as follows: (i) One of the possible factors for the repeatable colour change is the increment of the solute concentration in partial space by freezing operation. The aggregation of the present copper(I) complex upon freezing can cause drastic changes in the MLCT absorption, because the intermolecular interactions can induce changes in the electronic states of the molecule. Indeed, colour change caused by aggregation of organic molecules by freezing operation of water has been reported.17 Up to three orders of magnitude increase in concentration even upon fast freezing operation has been mentioned.17 (ii) Another possible factor is that the large difference in the environment between the fluid water and ice, where the alignment of the solvent molecule is more special compare to those of other organic molecules, induces structural changes related to the dihedral angles of the two ligand planes of the present complex cation. Indeed, dihedral angles between the two phenanthroline planes of bis(diimine)copper(I) complexes are widely different, [Cu(dmp)2]ClO4 (82°), [Cu(dmp)2]NO3 (67.7°), and [Cu(phen)2]ClO4 (49.7°) (phen = 1,10-phenanthroline) based on crystal structures.7 Their absorption spectra in the solid state are significantly different. Additionally, the absorption of one of the bis(diimine)copper(I) complexes, [Cu(phen)2]ClO4, which is 17–24 × 103 cm−1, has been found to be significantly red-shifted from that of [Cu(dmp)2]ClO4 15–20 × 103 cm−1. Due to the large red-shift, the colour of the green-coloured frozen solution can be possibly explained by structural change in copper(I) states. Moreover, the reported crystal structure of the bis(diimine)copper(I) complex using biq(COOH)2, which can be represented as the methanol solvate of (Et3NH)[Cu(biq(COOH)2)biq(COO)] considering the cif file in this manuscript, shows the four-coordinated tetrahedral geometry of the complex cation. The dihedral angle between the two planes using two nitrogen atoms and one copper atom is approximately 80°. The shape of the absorption spectrum of the reported complex, the bis(diimine)copper(I) complex using biq(COOH)2, in organic solvent mentioned above is similar to that of 1 in organic solvent, indicating that the coordination structure of 1 may be similar to that described in the literature. Therefore, the structural change, which is often discussed in the bis(diimine)copper(I) complex, may be applicable for explanation of the repeatable colour change caused by freezing operation. (iii) One of the possible factors categorized in others is that unique abilities of the ice environment cause repeatable colour change, because chemical reaction is often accompanied by colour change. Indeed, it has been reported that chemical reactions in ice are often very different from those in water and other environments.17 For example, ligand substitution reactions between the biquinoline ligand and oxygen atoms due to water and others can explain the colour change, because the colour of the copper(I) complex bearing one biq ligand is diminished compared to the bis(diimine)copper(I) complex;5a,6 the ligand substitution reaction is sufficiently fast in the case of the copper(I) state.23
Conclusions
In conclusion, the introduction of the carboxylate groups enables us to study the bis(diimine)copper(I) complex in water and ice. We prepared a powder of 1 by the reaction of the tetrakis(acetonitrile)copper(I) complex and the 2,2′-bicinchoninic acid dipotassium salt, biq(COOK)2. The elemental analysis, NMR, IR, and UV-vis spectra, and electrochemistry increase the validity that 1 is the coordination salt of the bis(diimine)copper(I) complex, and K3[Cu(biq(COO)2)2]. The intense absorption in the red-light region in water of the bis(diimine)copper(I) complex is advantageous. The reliability of the apparatus for the relative absorptivity of frozen water was demonstrated using this bis(diimine)copper(I) complex. The repeatable colour changes from purple to green were demonstrated upon the freezing operation using the water solution of 1. The powder of the present complex is promising for ice indicators, which can be useful for studies related to ice such as the storage of biological molecules and development of special chemical reactions.Experimental Section
Materials and methods
2,2′-Bicinchoninic acid dipotassium salt, biq(COOK)2, and 2,2′-biquinoline-4,4′-dicarboxylic acid disodium salt, biq(COONa)2, were purchased from Tokyo Chemical Industry Co., Ltd. Tetrakis(acetonitrile)copper(I) hexafluorophosphate was purchased from Sigma-Aldrich. Other chemicals were used as purchased without further purification. NMR (nuclear magnetic resonance) spectra were recorded on a JEOL Delta 500 spectrometer. The spectra were analyzed by Delta version 5. Transmission UV-vis (ultraviolet-visible light) absorption spectra were recorded on an Agilent 8453 spectrometer. Infrared (IR) spectra were recorded on a JASCO FT/IR-460 plus spectrometer. For the spectra for relative absorptivity of the liquid and the frozen solutions, a monochromated Xe lamp is equipped with a Labsphere integrating sphere (4P-GPS-033-SL), and the light from the apparatus is collected through a quartz fiber and fed into a spectrometer equipped with a cooled CCD sensor (Ocean Optics model QE65000). The relative absorptivity is calculated from −log10(I(λ)/I0(λ)). I(λ) and I0(λ) indicate detected light intensities at each wavelength around the visible light regions of the sample and blank one, respectively. The frozen water of 1 in a glass container was made in a freezer, and the spectrum of the sample was recorded immediately after taking the sample. Homemade apparatus of a xenon lamp was introduced into the integrated sphere, where the blank or sample are present, and the sphere was connected to a detector. The spectra are obtained from the logarithm of the ratio of those of the blank and the sample materials to base 10, and the signals reflect relative absorptivity. First, the spectrum of the purple water solution of 1 using the integrated sphere (Fig. 3c) is similar to that of the transmission UV-vis absorption spectrum (Fig. 2a), and the maximum wavelength of the former, 560 nm, is the same as that of the transmission one. The shape and the maximum wavelength of the spectra are well-known to be characteristic of the sample. Therefore, the measurements using the integrated sphere seem to be valid. The agreement of the results with our naked eye observations and photographs support the reliability of the measurement. Cyclic voltammograms were conducted using an electrochemical analyzer, EC-stat 100 (EC Frontier CO., Ltd), using an electrochemical cell equipped with working (glassy carbon, ϕ = 3 mm), auxiliary (platinum wire), and reference (silver-chloride/silver) electrodes. The solution was bubbled with argon before the measurements.DFT calculation24–27
Calculations were performed using Gaussian 03 W and Gaussian 09 software. TDDFT was used to calculate singlet and triplet excited state energies. The basis sets were as follows: copper 6-311G with Wachters's 4p functions, oxygen and nitrogen 6-31G+*, carbon 6-31G*, and hydrogen 6-31G.Preparation of complex 1
Under an argon atmosphere, 2,2′-bicinchoninic acid dipotassium salt (BCAK2) (475 mg, 1.0 mmol) was added into DMSO (20 mL), followed by the addition of [Cu(MeCN)4]PF6 (188 mg, 0.5 mmol). The reaction mixture was stirred at room temperature for 45 minutes. Acetone (40 mL) was added into the mixture. The purple precipitate was collected by filtration and dried. Purple powder, yield 460 mg (98%). 1H MNR (500 MHz, D2O) δ = 8.82 (s, 4H), 8.18 (d, 4H, J = 8 Hz), 7.79 (d, 4H, J = 9 Hz), 7.55 (t, 4H, J = 8 Hz), 7.31 (t, 4H, J = 8 Hz). Elemental analysis found C, 51.36%; H, 3.09%; N, 5.82%. Calcd for C40H20K3N4O8Cu·4H2O, C, 51.25%, H, 3.01%, N, 5.98%. The experimental values of the elemental analysis are similar to the calculated ones of K3[Cu(biq(COO)2)2]·4H2O and extremely different from the calculated ones of K4[Cu(biq(COO)2)2]PF6, K4[Cu(biq(COO)2)2]PF6·4H2O, and K3[Cu(biq(COO)2)2] (Table S1 in the ESI†).Conflicts of interest
There are no conflicts to declare.Acknowledgements
This work was supported by Grants from the Faculty of Science and Technology, Seikei University.Notes and references
- J. J. Concepcion, J. W. Jurss, M. K. Brennaman, P. G. Hoertz, A. O. T. Patrocinio, N. Y. Murakami Iha, J. L. Templeton and T. J. Meyer, Acc. Chem. Res., 2009, 42, 1954 CrossRef CAS PubMed.
- (a) H. Takeda, K. Ohashi, A. Sekine and O. Ishitani, J. Am. Chem. Soc., 2016, 138, 4354–4357 CrossRef CAS PubMed; (b) B. Bozic-Weber, E. C. Constable, S. O. Fürer, C. E. Housecroft, L. J. Troxler and J. A. Zampese, Chem. Commun., 2013, 49, 7222 RSC; (c) M. Nishikawa, S. Kume and H. Nishihara, J. Am. Chem. Soc., 2012, 134, 10543 CrossRef CAS PubMed.
- N. Armaroli, G. Accorsi, F. Cardinali and A. Listorti, Top. Curr. Chem., 2007, 280, 69 CrossRef CAS.
- (a) D. R. McMillin and K. M. McNett, Chem. Rev., 1998, 98, 1201 CrossRef PubMed; (b) Y. Saygili, M. Söderberg, N. Pellet, F. Giordano, Y. Cao, A. B. Muñoz-García, S. M. Zakeeruddin, N. Vlachopoulos, M. Pavone, G. Boschloo, L. Kavan, J.-E. Moser, M. Grätzel, A. Hagfeldt and M. Freitag, J. Am. Chem. Soc., 2016, 138, 15087 CrossRef CAS PubMed; (c) M. Iwamura, S. Takeuchi and T. Tahara, Acc. Chem. Res., 2015, 48, 782 CrossRef CAS PubMed; (d) M. Ruthkosky, C. A. Kelly, F. N. Castellano and G. J. Meyer, Coord. Chem. Rev., 1998, 171, 309 CrossRef CAS; (e) M. Ruthkosky, F. N. Castellano and G. J. Meyer, Inorg. Chem., 1996, 35, 6406 CrossRef CAS PubMed; (f) M. T. Miller, P. K. Gantzel and T. B. Karpishin, Inorg. Chem., 1998, 37, 2285 CrossRef CAS PubMed.
- (a) S. E. J. Bell and J. J. McGarvey, Chem. Phys. Lett., 1986, 124, 336 CrossRef CAS; (b) U. M. Frei and G. Geier, Inorg. Chem., 1992, 31, 3132–3137 CrossRef CAS; (c) Y. Jahng, J. Hazelrigg, D. Kimball, E. Riesgo, F. Wu and R. P. Thummel, Inorg. Chem., 1997, 36, 5390 CrossRef CAS.
- K. C. Gordon and J. J. McGarvey, Chem. Phys. Lett., 1989, 162, 117 CrossRef CAS.
- (a) K. Shinozaki and Y. Kaizu, Bull. Chem. Soc. Jpn., 1994, 67, 2435 CrossRef CAS; (b) G. Dessy and V. Fares, Cryst. Struct. Commun., 1979, 8, 507 CAS; (c) R. Hamalainen, M. Ahlgren, U. Turpeinen and T. Raikas, Cryst. Struct. Commun., 1979, 8, 75 CAS; (d) P. C. Healy, L. M. Engelhardt, V. A. Patrick and A. H. White, J. Chem. Soc., Dalton Trans., 1985, 2541 RSC.
- K. A. Wills, H. J. Mandujano-Ramírez, G. Merino, D. Mattia, T. Hewat, N. Robertson, G. Oskam, M. D. Jones, S. E. Lewis and P. J. Cameron, RSC Adv., 2013, 3, 23361 RSC.
- S. Mahadevan and M. Palaniandavar, Inorg. Chem., 1998, 37, 693–700 CrossRef CAS.
- J. R. Nitschke, Angew. Chem., Int. Ed., 2004, 43, 3073–3075 CrossRef CAS PubMed.
- J. P. Sauvage and L. X. Chem, et al. , Angew. Chem., Int. Ed., 2012, 51, 12711 CrossRef PubMed.
- K. A. Fransted, N. E. Jackson, R. Zong, M. W. Mara, J. Huang, M. R. Harpham, M. L. Shelby, R. P. Thummel and L. X. Chen, J. Phys. Chem. A, 2014, 118, 10497 CrossRef CAS PubMed.
- R. Chung, A. Vo and J. E. Hein, ACS Catal., 2017, 7, 2505–2510 CrossRef CAS.
- H. R. Manoel and H. D. Moya, Molecules, 2015, 20, 22411–22421 CrossRef CAS PubMed.
- P. Bagchi, M. T. Morgan, J. Bacsa and C. J. Fahrni, J. Am. Chem. Soc., 2013, 135, 18549–18559 CrossRef CAS PubMed.
- (a) A. J. Schwartz and G. H. Pollack, Langmuir, 2017, 33, 5585–5591 CrossRef CAS PubMed; (b) S. Takahashi, M. Harada and T. Okada, Anal. Methods, 2016, 8, 105–110 RSC.
- D. Heger, J. Jirkovsky and P. Klan, J. Phys. Chem. A, 2005, 109, 6702–6709 CrossRef CAS PubMed.
- Y. Orii and M. Morita, J. Biochem., 1977, 81, 163 CrossRef CAS PubMed.
- M. Nishikawa, T. Sano, M. Washimi, K. Takao and T. Tsubomura, Dalton Trans., 2016, 45, 12127–12136 RSC.
- M. Nishikawa, Y. Wakita, T. Nishi, T. Miura and T. Tsubomura, Dalton Trans., 2015, 44, 9170–9181 RSC.
- M. Nishikawa, S. Sawamura, A. Haraguchi, J. Morikubo, K. Takao and T. Tsubomura, Dalton Trans., 2015, 44, 411–418 RSC.
- M. Nishikawa., M. Tsuji and T. Tsubomura, Bull. Chem. Soc. Jpn., 2017, 798–800 CrossRef CAS.
- V. Desvergnes-Breuil, V. Hebbe, C. Dietrich-Buchecker, J.-P. Sauvage and J. Lacour, Inorg. Chem., 2003, 42, 255–257 CrossRef CAS PubMed.
- M. J. Frisch, G. W. Trucks, H. B. Schlegel, G. E. Scuseria, M. A. Robb, J. R. Cheeseman, J. A. Montgomery, Jr., T. Vreven, K. N. Kudin, J. C. Burant, J. M. Millam, S. S. Lyengar, J. Tomasi, V. Barone, B. Mennucci, M. Cossi, G. Scalmani, N. Rega, G. A. Petersson, H. Nakatsuji, M. Hada, M. Ehara, K. Toyota, R. Fukuda, J. Hasegawa, M. Ishida, T. Nakajima, Y. Honda, O. Kitao, H. Nakai, M. Klene, X. Li, J. E. Knox, H. P. Hratchian, J. B. Cross, V. Bakken, C. Adamo, J. Jaramillo, R. Gomperts, R. E. Stratman, O. Yazyev, A. J. Austin, R. Cammi, C. Pomelli, J. W. Ochterski, P. Y. Ayala, K. Morokuma, G. A. Voth, P. Salvador, J. J. Dannenberg, V. G. Zakrzewski, S. Dapprich, A. D. Daniels, M. C. Strain, O. Farkas, D. K. Malick, A. D. Rabuck, K. Raghavachari, J. B. Foresman, J. V. Ortiz, Q. Cui, A. G. Baboul, S. Clifford, J. Cioslowski, B. B. Stefanov, G. Liu, A. Liashenko, P. Piskorz, I. Komaromi, R. L. Martin, D. J. Fox, T. Keith, M. A. Al-Laham, C. Y. Peng, A. Nanayakkara, M. Challacombe, P. M. W. Gill, B. Johnson, W. Chen, M. W. Wong, C. Gonzalez and J. A. Pople, Gaussian 03, Revision C.02, Gaussian, Inc., Wallingford CT, 2004 Search PubMed.
- A. J. H. Wachters, Chem. Phys. Rev., 1970, 52, 1033–1036 CAS.
- A. D. Becke, Chem. Phys., 1992, 96, 2155–2160 CAS.
- A. D. Becke, Chem. Phys., 1993, 98, 5648–5652 CAS.
Footnote |
| † Electronic supplementary information (ESI) available. See DOI: 10.1039/c8nj05147j |
| This journal is © The Royal Society of Chemistry and the Centre National de la Recherche Scientifique 2019 |