A flexible self-poled piezoelectric nanogenerator based on a rGO–Ag/PVDF nanocomposite†
Manojit
Pusty
 ,
Lichchhavi
Sinha
 and
Parasharam M.
Shirage
 *
*
Discipline of Metallurgy Engineering and Materials Science, Indian Institute of Technology Indore, Simrol, Indore 453552, India. E-mail: paras.shirage@gmail.com; pmshirage@iiti.ac.in; Tel: +91-787-5222-331
First published on 20th November 2018
Abstract
Here we demonstrate the mechanical energy harvesting performance of a poly(vinylidene-fluoride) (PVDF) device which is loaded with reduced graphene oxide–silver nanoparticles (rGO–Ag). The current results show that the addition of rGO–Ag enhances the polar beta and gamma piezoelectric phases in PVDF, which is capable of generating a greater piezoelectric output, thereby eliminating the requirement of any external poling process. X-ray diffraction (XRD) and Fourier transform infra-red spectroscopy (FT-IR) characterizations were employed for the identification and quantification of the piezoelectric polar phases of the nanocomposite films. Raman spectroscopy confirmed the interactions between rGO–Ag and PVDF. Polarization vs. electric field (P–E) loop testing was performed and it was found that on the application of an external electric field of 148 kV cm−1 the nanocomposite showed an energy density value of ∼0.26 J cm−1, which indicates its potential for energy storage applications. The fabricated energy harvesting device, a piezoelectric nanogenerator (PNG), could charge up capacitors and light up to 20 commercial blue light-emitting diodes. The PNG was tested to harvest biomechanical energy from pulsing mechanical energy by fixing it to fingers on the human palm. The PNG was also fixed to flip-flops in order to demonstrate its footwear connected energy harvesting application. The PNG showed a peak output open circuit voltage of ∼18 V and a short circuit current of ∼1.05 μA, with a peak power density of 28 W m−3 across a 1 MΩ resistor. The PNG shows a moderate efficiency of 0.65%.
Introduction
The crisis due to global warming that originated from the usage of fossil fuels has led to the quest for renewable energy sources such as solar energy, wind energy, hydel energy, and nuclear energy. However, they require considerable economic investment as well as distribution and storage infrastructures. Mechanical energy is an ideal alternative which is omnipresent and abundant in the environment that can show the way for self-powered technology to replace traditional batteries which are not mechanically flexible and also require charge replenishment. As per the literature, mechanical energy harvesting can also be used for the generation of other green sources of energy and efficient waste management. In this context Ren et al. using mechanical energy harvesting have shown hydrogen production by water splitting,1 electromagnetic-triboelectric hybrid nanogeneration,2 and self-powering application from waste rubber powder.3 Formerly several piezoelectric materials like ZnO, BaTiO3, PZT, ZnSnO3, GaN and BiFeO3 were used to develop energy harvesting devices.4–9 Although they show higher efficiency, they are costly, lethal, brittle, and are also unfriendly to nature. Piezoelectric polymers like poly(vinylidene fluoride) (PVDF) are suitable to overcome these limitations as they are environmentally stable, biocompatible, strongly sensitive to external force, and have high energy conversion efficiency. Piezoelectric polymers develop an electric polarization on the application of mechanical stress, which can harvest mechanical energy from tappings and vibrations present in the ambient environment.10,11 PVDF with its repeating molecular unit (–CH2–/–CF2–) is a ferroelectric polymer which shows the strongest piezoelectric and pyroelectric activity among the well-known polymers.12 The electromechanical properties of PVDF depend upon the crystalline structure, chain conformation, and dipole orientation within the crystalline regions towards the applied processing conditions and post-treatment methods. PVDF exhibits five different polymorphs viz. α-phase, β-phase, γ-phase, δ-phase and ε-phase. Among all the polar phases the β-phase content shows higher piezoelectric, pyroelectric and ferroelectric properties and is more desirable for energy harvesting purposes.13 Thus it is necessary to enhance the content of the crystalline phases in PVDF which in turn enhances the piezoelectricity so that it can be used to harvest mechanical energy efficiently. However, the conversion of β-phase to α-phase is associated with an energy barrier.14 Hence, special techniques are necessary to overcome the energy barrier for the nucleation of a greater fraction of polar β-phase which includes processing techniques like mechanical stretching and electrical poling at high electric fields, and melt crystallization at high pressure or at very high cooling rates, which are costly and are associated with electrical breakdown.15,16Recently graphene nanosheets owing to their superior electrical, thermal, mechanical and optical properties were reported to be incorporated as a filler in PVDF.17,18 However, the poor compatibility between non-polar graphene and polar PVDF prevents the formation of a homogenous composite. Hence, surface functionalization of graphene is necessary for its homogenous dispersion in PVDF. Also, the dielectric loss becomes significant when conducting graphene is incorporated into PVDF. This leads to enhancement in leakage current, which can decrease the lifetime of the composite due to poor heat dissipation factors. To overcome these problems associated with using graphene within the composite, performing oxidative functionalization of graphene to form graphene oxide (GO) is an alternative route. The oxygen containing functional groups in GO interact with the polymer chains in PVDF and enhance the dispersibility. But the incorporation of GO into PVDF deteriorates the electrical and mechanical properties of the polymer composite. Hence, an alternative route is to reduce GO to rGO, where the later shows partially graphene like properties, with enhanced dispersion in the polymer.19,20 It has been reported that Fe-rGO, Al-rGO, and Ce3+/graphene are highly effective in enhancing the piezoelectric polar phases in PVDF.21–23 The enhancement in the piezoelectric polar phases is related to the electrostatic interactions between the positive and negative charge centers of metal ions and negative charge clouds in rGO, respectively. It was reported by Bhavanasi et al. that a bilayer film of PVDF-TrFE and graphene oxide exhibits superior energy harvesting performance owing to the electrostatic contribution from graphene oxide as compared to a single layer of PVDF-TrFE film.24 In another interesting research work it was found by Sinha et al. that by the incorporation of a graphene-silver nanocomposite (GAg) into PVDF, energy conversion efficiencies of 15% and 46.6% in dark conditions and illuminated conditions, respectively, are observed owing to plasmonic behavior of GAg.25 Despite the high energy conversion efficiency, the fabrication and study of a wearable/attachable piezoelectric nanogenerator was not attempted by incorporating Ag NPs and rGO into PVDF. Ag NPs are simple to synthesize and were previously found to enhance the dielectric properties when they formed a composite with PVDF.26 All of these factors make rGO–Ag an interesting material to be incorporated into PVDF for mechanical energy harvesting.
In this work, we present a conveyable, flexible, lightweight, low-cost (and also lead-free) rGO–Ag/PVDF nanocomposite material synthesized by a solution casting process, which is attached to aluminium tapes with conducting adhesives. The rGO–Ag/PVDF nanocomposite is synthesized by adding different weight percentages (0.1, 0.5, 1.0, and 2.0) of rGO–Ag in PVDF, for subsequent material characterizations and its qualitative comparison. Furthermore, the device is encapsulated by polydimethylsiloxane (PDMS) which makes it environmentally safe, and mechanically strong and stable. We have named the energy harvesting device as a piezoelectric nanogenerator (PNG). Similar fabrication techniques for piezoelectric nanogenerators are found to be reported in recent publications.27,28 The performance of the PNG was investigated by carrying out voltage and current characterizations (both unrectified as well as rectified) and by calculating the power density and energy conversion efficiency. The PNG could light 20 commercial blue light-emitting diodes (LEDs) simultaneously (which are arranged to take the shape of the letters IITI, which is an abbreviation of Indian Institute of Technology Indore) by human palm impulse imparting. Also, the PNG can be used to develop flexible piezoelectric energy harvesting devices like piezoelectric shoes, floors, walkways, tires, etc. that use vertical compression as the input.
Experimental section
Materials
Graphite powder was purchased from SD Fine Chemicals Limited, India. Sulphuric acid (H2SO4), sodium nitrate (NaNO3), hydrogen peroxide (H2O2) and N,N-dimethyl formamide (DMF) were purchased from Merck, India. Potassium permanganate (KMnO4) was purchased from Rankem, India. Polydimethylsiloxane (PDMS) (Sylgard 184) was purchased from Dow Corning Corporation, USA. Conducting aluminium adhesive tapes were purchased from 3 M, USA (Scheme 1).Synthesis of graphene oxide
Graphene oxide was synthesized by a modified Hummer's method as mentioned below:29,301 g of graphite powder, 1 g sodium nitrate and 50 mL of sulphuric acid were stirred together in a round bottom flask in an ice bath for 30 minutes. After that 6 g potassium permanganate was slowly added to it at 0 °C and stirred. After 30 minutes the round bottom flask was transferred to a water bath maintained at 40 °C. It was then stirred. After 1 hour, 100 mL of de-ionized (DI) water was added and the temperature of the water bath was raised to 95 °C. After another 30 minutes the solution was diluted by 200 mL DI water. 1 hour later hydrogen peroxide was added. The color of the solution changed from brown to yellow. The final solution was filtered using filter paper. The filtrate was dispersed in water and subsequently, the solution was centrifuged to separate out lighter GO particles. The lighter GO particles were again centrifuged. This time the supernatant was discarded and the colloidal precipitate was collected and dispersed in DI water. Finally, this solution was ultrasonicated to obtain completely exfoliated graphene oxide.
Synthesis of reduced graphene oxide–silver (rGO–Ag) nanocomposite
To prepare the rGO–Ag nanocomposite, 1.3 ml of GO suspension (1.35 mg ml−1) was added to 98.7 ml of DI water. To this, 36 mg of silver nitrate (AgNO3) was added and the solution was heated at 95 °C. After 1 hour, 40 mg sodium citrate was added and the solution was heated for another 1 hour. The solution was filtered and washed by a centrifugation method 3–4 times.31Fabrication of the PNG
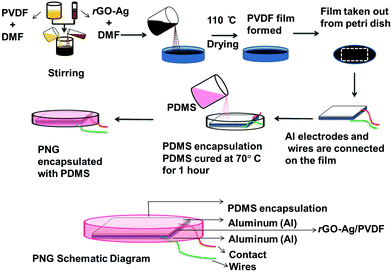
To dissolve PVDF in DMF, 100 mg of PVDF was added to 10 ml DMF. The mixture was stirred with a magnetic stirrer at room temperature. After the PVDF dissolved completely in DMF a thick transparent suspension was formed. A 1 mg ml−1 solution of rGO–Ag in DMF was prepared followed by ultrasonication. Then 1 ml of rGO–Ag/DMF suspension was added to it. The mixture was ultrasonicated for 3 hours. The mixture was transferred to a Petri dish of 10 cm diameter and placed in an electric furnace at 110 °C for 24 hours in order to remove DMF completely.32 Similarly, other loadings (0.1, 0.5 and 2.0) of rGO–Ag/PVDF nanocomposite films were synthesized. 5.5 × 4 cm slices of the rGO–Ag/PVDF film were made for device fabrication. Aluminium adhesive foil tapes of 5 × 2.6 cm were pasted to the nanocomposite films. Copper wires were connected between the nanocomposite and the aluminium foil tape. Furthermore, for encapsulation, the device was placed in a Petri dish, into which 10 grams of PDMS (with 10![[thin space (1/6-em)]](https://www.rsc.org/images/entities/char_2009.gif) :
:![[thin space (1/6-em)]](https://www.rsc.org/images/entities/char_2009.gif) 1 elastomer to curing agent) was poured, and placed in an electric furnace at 70 °C until the PDMS hardened. The PDMS encapsulation was necessary to protect the PNG from getting damaged by repeated mechanical excitations and to make it water and dust proof.
1 elastomer to curing agent) was poured, and placed in an electric furnace at 70 °C until the PDMS hardened. The PDMS encapsulation was necessary to protect the PNG from getting damaged by repeated mechanical excitations and to make it water and dust proof.
Results and discussion
The deconvoluted XRD spectrum of pure PVDF is shown in Fig. 1(a). The diffraction peaks at 17.7°, 18.2° and at 19.9° correspond to (100), (020) and (110) planes of α crystalline polymorphs of PVDF. Fig. 1(b) shows the XRD spectrum of 0.1 rGO–Ag/PVDF nanocomposite where the α (020) peak at 18.2° disappears; however, the α (100) peak at 17.7° and (110) peak at 19.9° appear.14Fig. 1(c) shows the XRD spectrum of 0.5 rGO–Ag/PVDF nanocomposite where the α phase diffraction peaks disappear; instead peaks at 18.6° and 20.2° appear which belong to γ(110) and β(200/110) crystalline piezoelectric phases, respectively. This reveals that the addition of 0.5 weight percentage of rGO–Ag not only prevents the formation of α crystalline piezoelectric polymorphs but also favors the formation of polar piezoelectric polymorphs. Fig. 1(d) shows the enhancement of the intensities of the peaks belonging to γ (110) and β (200/110), in 1.0 rGO–Ag/PVDF nanocomposite. However, the intensities of the peaks belonging to γ (110) at 18.6° and β (200/110) at 20.2° fall a notch below in 2.0 rGO–Ag/PVDF as shown in Fig. 1(e). The significance of these observations is that rGO–Ag is responsible for the nucleation and the stabilization of the polar β and γ piezoelectric polymorphs in PVDF. The maximum enhancement of the γ (110) and β (200/110) peaks takes place in 1.0 rGO–Ag/PVDF. The reason behind this phenomenon is the interaction between the PVDF polymer chains and rGO–Ag in the rGO–Ag/PVDF nanocomposite. However, the intensity of the peaks belonging to the piezoelectric polar phases falls in 2.0 rGO–Ag/PVDF nanocomposite which may be attributed to the agglomeration of rGO–Ag thus leading to insufficient interaction with the PVDF chains. The formation of conductive pathways within the rGO–Ag/PVDF nanocomposite may also be responsible for the reduction in the nucleation of polar piezoelectric phases. It is noteworthy here that the combined presence of the piezoelectric β- and γ-phases appears solely because of the addition of rGO–Ag, and not because of any external mechanical or electrical treatment applied to the rGO–Ag/PVDF nanocomposite films. The degree of crystallinity (χCt) of the rGO–Ag/PVDF nanocomposites was found from the following equation: | (1) |
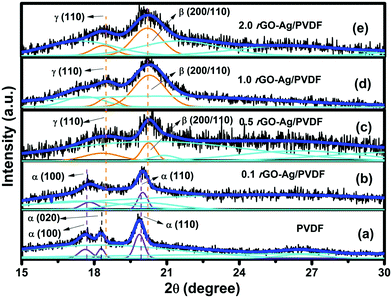 | ||
| Fig. 1 X-ray diffraction patterns of (a) pure PVDF, and (b) 0.1 rGO–Ag/PVDF, (c) 0.5 rGO–Ag/PVDF, (d) 1.0 rGO–Ag/PVDF, and (e) 2.0 rGO–Ag/PVDF nanocomposites. | ||
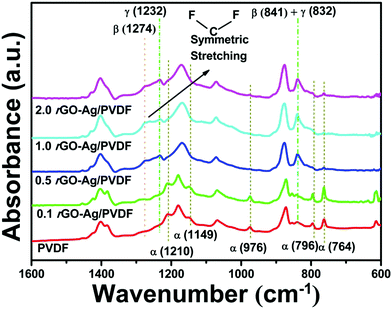
Infrared (IR) spectroscopy is a very important tool to find out the transformation of phases in rGO–Ag/PVDF nanocomposites. Fig. 2 displays the FT-IR spectra of rGO–Ag/PVDF nanocomposite films with different rGO–Ag loadings. The common peaks associated with the non-polar α-phase for pure PVDF are observed at 764, 796, 976, 1149, and 1210 cm−1. For the polar β-phase, the absorption band is located at 1274 and at 841 cm−1. In the case of γ-phase the corresponding peaks are located at 832, and 1232 cm−1.22,33 However, identification of phase separation between the polar piezoelectric phases is not easy due to the common TTT conformation which leads to their peak superimposition. The deconvoluted spectrum between 800–900 cm−1 of 1.0 rGO–Ag/PVDF nanocomposite is shown in ESI† Fig. S2a, which demonstrates the existence of the γ-phase and β-phase peaks at 832 cm−1 and 841 cm−1, respectively, both existing nearby. ESI† Fig. S2b shows the FT-IR spectra between 4000 cm−1 and 2500 cm−1. The two fundamental vibrational bands belonging to νas(–CH2–) and νs(–CH2–) are shifted with the increasing amount of rGO–Ag. The deconvoluted FT-IR spectra between 4000 cm−1 and 2500 cm−1 of PVDF, 0.1 rGO–Ag/PVDF, 0.5 rGO–Ag/PVDF, and 2.0 rGO–Ag/PVDF nanocomposites are shown in ESI† Fig. S3(a, b, c and d), respectively.
The α-phase peaks appear near 764 cm−1, 796 cm−1, 976 cm−1, 1149 cm−1, and 1210 cm−1, respectively, in the 0.1 rGO–Ag/PVDF nanocomposite, as shown in Fig. 2. Due to this reason the γ-phase is not stabilized properly at lower filler concentrations. The intensity of the γ-phase peak increases gradually as the rGO–Ag filler loading in PVDF increases. This is reflected in 0.5 rGO–Ag/PVDF nanocomposite. This indicates that with the addition of 0.5 weight percentage rGO–Ag, the formation of the electroactive γ-phase as well as the β-phase takes place by reducing the α-phase content. Gradually, the polar β- and γ-phases become more stabilized and the peak belonging to the α-phase disappears in 1.0 rGO–Ag/PVDF. It is found from the FT-IR analysis that the complete suppression of the α-phase takes place at 0.5 weight percent loading of the rGO–Ag nanocomposite. It is noteworthy that the 1274 cm−1 characteristic absorption peak of the β-phase diminishes in 2.0 rGO–Ag/PVDF nanocomposite. It needs to be mentioned here that in order to carry out the FT-IR analysis of all the spectra, normalization was done about the 1070 cm−1 peak because it is linearly dependent on the thickness of the PVDF nanocomposite films and is independent of the formation of piezoelectric polymorphs.34
F(β,γ), which is the relative proportion of both β- and γ-phase crystallization, was found to be 70% in 1.0 rGO–Ag/PVDF nanocomposite, where F(β) is 38% and F(γ) is 32%. Eqn (S4), (S5) and (S6) in the ESI† were used to find the values of F(β,γ), F(β), and F(γ), respectively. The variation of the relative proportion obtained from the above calculations is shown in ESI† Fig. S4. The increase in the content of polar electroactive β-phase associated with the addition of 1 weight percentage rGO–Ag in the nanocomposite accounts for the detection of the enhanced output voltage, which is to be discussed later. It needs to be mentioned that this output is greater than that reported previously with similar device fabrication techniques.35,36
The variation of the damping coefficient with the addition of rGO–Ag is shown in ESI† Fig. S5, which was calculated by using the shifting of the νas(–CH2–) and νs(–CH2–) vibrational bands as shown in Fig. S6 and by using eqn (S7), as provided in the ESI.† The dichroic ratio which is also another means to quantitatively analyze the crystal structures present in the nanocomposite films is shown in Fig. S7(a–c) in the ESI.†
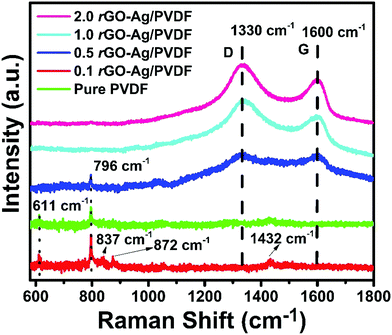
Fig. 3 displays the Raman spectrum of pure PVDF with prominent peaks at 611 cm−1 and 796 cm−1. Both the peaks are attributed to α-phase or TGTḠ chain conformation.37,38 The peak at 611 cm−1 is attributed to CF2 vibrations. The TGTḠ chain conformation is a trans conformation. The trans conformations are attributed to the strain induced due to swelling in the amorphous regions. Both these peaks are absent in 1.0 rGO–Ag/PVDF and 2.0 rGO–Ag/PVDF nanocomposites. This significantly emphasizes the advent of crystalline phases in the PVDF with the high level of incorporation of rGO–Ag by weight percentage, in it. The diffused bands present between 1075 cm−1 and 1095 cm−1 are attributed to α-phase.39 The peaks at 837 cm−1, 872 cm−1 and 1432 cm−1 in pure PVDF are attributed to CH2 rocking vibrations, CC symmetric stretching and CH2 scissoring vibrations, respectively. The small peaks at 837 cm−1, 872 cm−1 and 1432 cm−1 are suppressed in all the rGO–Ag/PVDF nanocomposites.40 This indicates the interactions between rGO–Ag and PVDF chains. The Raman spectra of rGO–Ag become prominent in the case of 0.5, 1.0 and 2.0 rGO–Ag/PVDF nanocomposites. The peaks at 1130 cm−1 and 1600 cm−1 are attributed to D and G bands of rGO, respectively. The D band is assigned to disorder in the graphitic structure. The D band originates from the breathing mode of the κ-point photons of A1g symmetry; whereas, the G band is attributed to the in-plane displacement of carbon atoms in hexagonal carbon sheets. The G band arises due to first order scattering of the E2g phonon of sp2 hybridization of carbon atoms.41
The morphological characterizations of the rGO–Ag and rGO–Ag/PVDF nanocomposite films are provided in the ESI.† Fig. S9(a and b) (ESI†) show the SEM and HRTEM images of rGO–Ag, respectively. Fig. S9(c) shows the SEM image of the 1.0 rGO–Ag/PVDF nanocomposite, whereas Fig. S10 (ESI†) shows the EDS spectra of rGO–Ag. The XRD spectra of the GO and rGO–Ag are shown in ESI† Fig. S11. The XPS characterizations of the GO and rGO–Ag are shown in ESI† Fig. S12(a–c).
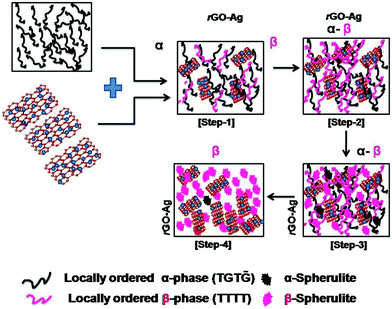
Scheme 2 illustrates the stepwise formation of the β-phase from the α-phase due to the interaction between the PVDF polymer chains and rGO–Ag filler, which is electrostatic in nature. The transformation of β-phase from α-phase occurs in steps. In the first step locally ordered β-phase starts to nucleate from the α-phase which is associated with the simultaneous formation of locally ordered α-phase. As time passes the second step is initiated where more β-phase crystals start forming from the α-phase crystals. The piezoelectric properties are enhanced in the third step where the aggregation of locally ordered β-phase takes place and spherulite type structures are formed. With the passage of more time, in the final step the complete transformation of the locally ordered β-phase to spherulite type structures takes place.20,21
Scheme 3 shows the schematic illustration of the formation mechanism of the piezoelectric polar phases. The π-electrons of the graphene in the rGO–Ag are attracted to the –CH2– dipoles of PVDF. Similarly, the –CF2– dipoles of PVDF are repelled by the π-electrons of the graphene present in the rGO–Ag. Other-way round, the positively charged Ag ions are attracted by the –CF2– dipoles of PVDF whereas the Ag ions repel the –CH2– dipoles. Also, the F and H atoms interact with the oxygen-containing functional groups present in the graphene. The attraction and repulsion between the dipoles present in the PVDF and the various units of rGO–Ag is the key behind the formation mechanism of the nucleation of the piezoelectric polar phases in PVDF after the addition of rGO–Ag.
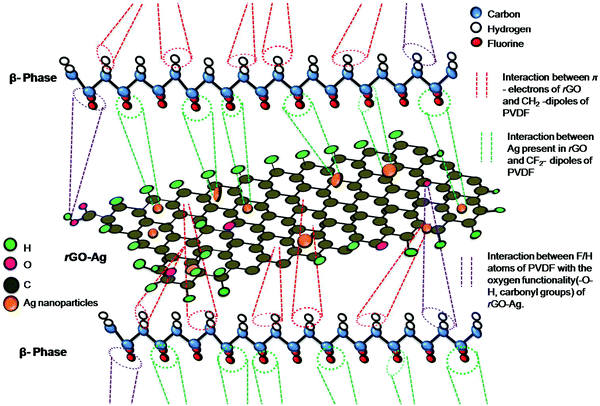 | ||
| Scheme 3 Schematic illustration of the interaction of the β-phase of PVDF with rGO–Ag nanocomposite, to form the piezoelectric polar phases. | ||
The polarization-electric field (P–E) loop characterization was done to study ferroelectric properties of the rGO–Ag/PVDF nanocomposite films, which is shown in Fig. 4(a). Ferroelectric properties are completely dependent on the electroactive phases of the PVDF polymer. The ferroelectric domains are randomly oriented within the polymer matrix. The ferroelectric domains are composed of molecular dipoles which contribute to the piezoelectricity. The molecular dipoles are formed by the interaction of the filler nanomaterial with the PVDF monomers. The change in the P–E hysteresis curve along with the variation of filler loading indicates the fact that rGO–Ag leads to the variation of charge contained within the nanocomposite. The charge storage capability of the nanocomposite is indicated by the formation of the loop with a definite area. The loop forms due to the existence of phase separation between voltage and charge. The phase separation is a consequence of the energy dissipation of the nanocomposite. The polarization gradually increases with the increase of the applied electric field. This indicates that the molecular dipoles are aligned in the direction of the applied electric field. A maximum polarization value of 0.738 μC cm−2 was obtained in the 1.0 rGO–Ag/PVDF nanocomposite film at an applied electric field of 148 kV cm−1. The remnant polarization in the 1.0 rGO–Ag/PVDF nanocomposite film was found to be 0.160 μC cm−2, whereas in pure PVDF the value found was 0.012 μC cm−2. The change in the remnant polarization may be attributed to charge accumulation of molecular dipoles, which are formed by the interactions between PVDF chains and the oxygen-containing functional groups in rGO–Ag nanocomposite.
The released energy density (UR) from the different rGO–Ag/PVDF nanocomposites is shown in Fig. 4(b). The maximum released energy density in rGO–Ag/PVDF nanocomposite is 0.26 J cm−3, whereas in the case of pure PVDF the value is 0.232 J cm−3. The released energy density at any electric field is calculated by the integration of the area (the shaded region with blue stripes) between the P–E loop and the electric field coordinate as shown in Fig. S13 (ESI†). The energy loss (UL) is calculated by integrating the area enclosed by the P–E loop. The algebraic addition of the released energy density and the energy loss density gives the total energy density (UT) in the rGO–Ag/PVDF nanocomposite films. The ratio of the released energy density (UR) and total energy density (UT) gives the energy efficiency of the rGO–Ag/PVDF nanocomposite films, which is shown in Fig. 4(c). The changes in the polarization properties may be attributed to the strong interactions between rGO–Ag and PVDF. The rGO–Ag/PVDF nanocomposites can be used for charge storage materials with enhanced capacity due to their high charge retention property.
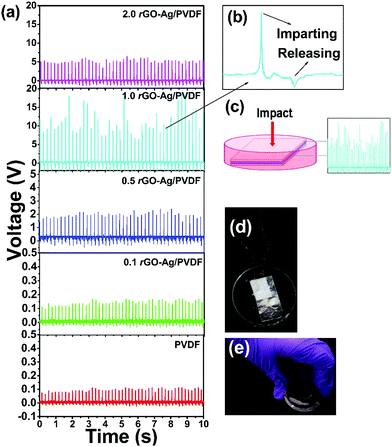
In order to find out the efficacy of the rGO–Ag/PVDF nanocomposite films to harvest mechanical energy, an electrode-composite-electrode (ECE) stack was fabricated where an aluminium foil with conducting adhesive was used as an electrode. The ECE stack was encapsulated with PDMS coating. Human palm impulse was imparted on all the rGO–Ag/PVDF nanocomposite films, having different filler loadings. None of the PVDF nanocomposite films were electrically poled. The rGO–Ag/PVDF nanocomposite films showed enhancement in the formation of the piezoelectric polar phases with the increase in filler loading, hence it was expected that it would also show greater piezo-response. The 1.0 rGO–Ag/PVDF nanocomposite showed the highest value open circuit voltage of 18 V owing to the greater stabilization of piezoelectric polar crystalline phases. The open circuit voltage obtained from that of pure PVDF was 0.1 V. The open circuit voltage detected from all the nanocomposites with different filler loadings of rGO–Ag is shown in Fig. 5(a). The external pressure creates a change in the crystal structure of the PVDF based film instantaneously, which creates the formation of a piezoelectric potential throughout the PVDF nanocomposite. The piezo-response increases with the increase of the addition of filler material, compared to virgin PVDF. However, the energy harvesting performance falls in the case of 2.0 rGO–Ag/PVDF nanocomposite. The decrease in the piezoelectric voltage output at higher filler loading maybe because of leakage of charges through conducting rGO networks through the polymer nanocomposite between the two electrodes.
The generated open circuit voltage shows positive and negative amplitudes, which is a consequence of the complete cycle of imparting and releasing human hand impact on the piezoelectric energy harvesting device. Fig. 5(b) indicates that the positive amplitude and the negative amplitude are a consequence of the imparting and releasing of the hand impulse, respectively. The positive half cycle of the generated voltage is greater because it depends on the magnitude of the impulse whereas the negative half cycle depends on the elasticity of the material due to which it returns back to its original shape.21
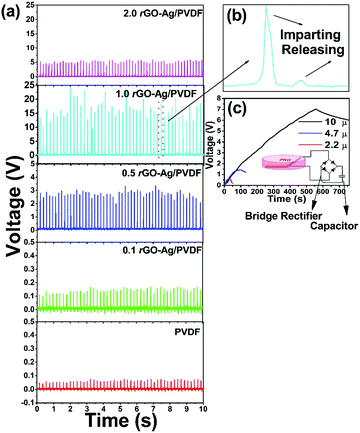
The rectified voltage signal from the rGO–Ag/PVDF based nanocomposite films is shown in Fig. 6(a). The 1.0 rGO–Ag/PVDF nanocomposite showed the highest value of output with a peak rectified output voltage as high as 24 V. The pure PVDF nanocomposite film generated an output voltage of 0.1 V. A bridge rectifier was used to rectify the open circuit voltage from the PVDF based energy harvesting device. Rectification allows the generation of a higher magnitude of voltage because the full wave bridge rectifier prevents voltage degradation due to the different resistances present in the piezoelectric nanocomposite films and also eliminates self-cancellation of voltages due to polarity mismatch.42Fig. 6(b) shows the magnified view of a single cycle of the rectified open circuit voltage. The appearance of a small peak at the positive quadrant is a result of the overall rectification of the piezoelectric output signal. To demonstrate that the PNG is a potential candidate to recharge batteries, capacitors were charged by imparting a hand impulse on the PNG. The capacitor charging performance of the PNG is shown in Fig. 6(c). Three different capacitances of 2.2, 4.7 and 10 μf were connected to the output of a bridge rectifier, under the condition of imparting a constant hand impulse on the PNG. The voltage rises exponentially and attains a steady state after some time.
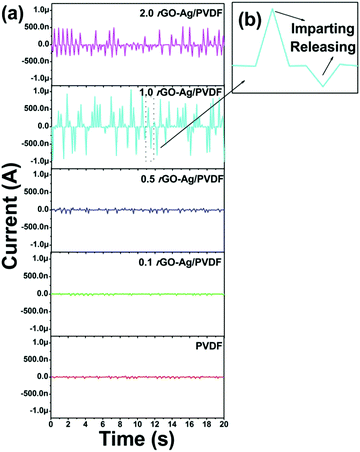
Fig. 7(a) shows the short-circuit current generated by the PNG upon imparting a continuous hand impulse. It was found that as the amount of rGO–Ag content increases the short circuit current also increases. In the case of the pure PVDF based nanocomposite film the short circuit current reached ≈0.03 μA, whereas the maximum current from the 1.0 rGO–Ag/PVDF nanocomposite reached ≈1.05 μA. The short circuit current reduced in the case of 2.0 rGO–Ag/PVDF nanocomposite. This may be attributed to the leakage of charges via conducting graphene pathways through the PVDF matrix. Fig. 7(b) shows the magnified image of a single cycle of the short-circuit current generated by the rGO–Ag/PVDF based nanocomposite. The rectified short-circuit responses of all the polymer nanocomposites are shown in ESI† Fig. S14.
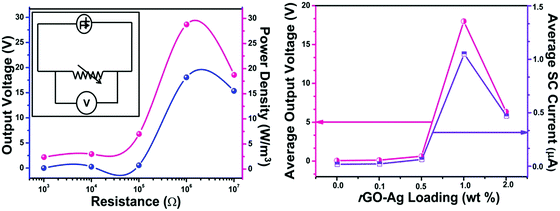
To find out the maximum power transferred by the PNG, the device was connected across various resistances (1k, 10k, 100k, 1 M, and 10 M) and simultaneously the voltage drop across it was measured, which is shown in Fig. 8(a). A maximum voltage of 18 V was detected across 1 MΩ resistance. The maximum power density was found out to be 28 W m−3. The reason behind this phenomenon can be attributed to the maximum power transfer theorem according to which maximum external power is drawn from a source of electrical energy with a finite internal resistance when the resistance of the load is equal to the resistance of the source, as seen from the output terminals of the source. The following formula was used to calculate the maximum power density:
 | (2) |
The theoretical current can be estimated from
 | (3) |
The Young's modulus of 1.0 rGO–Ag/PVDF nanocomposite is calculated using the stress vs. strain curve, which is shown in ESI† Fig. S15. The magnitude of the pressure imparted on the PNG is calculated by using eqn (S8)–(S10) provided in the ESI.† The PNG showed an efficiency of 0.65% which is better than that in at least one reported literature.44 The efficiency was calculated by first finding out the input energy (Win) provided to the PNG while charging the 10 μf capacitor during one cycle using eqn (S11) (ESI†). After that the total input energy (Ein) provided to the PNG is calculated by eqn (S12) (ESI†). The output energy (Eout) which is the total energy stored by the 10 μF capacitor is calculated using eqn (S13) (ESI†). Finally the efficiency is calculated by finding out the ratio between Eout and Ein using eqn (S14) (ESI†).
A schematic illustration of the working mechanism of the PNG is shown in Scheme 4. When the top of the PNG is excited with hand tapping, the vertical polarization of electrical charges ensues within the nanocomposite, which is nothing but the generation of piezo-potential, which is depicted in Scheme 4(a). Similarly, piezo-potential develops across the electrodes when fingers of the palm to which the PNG was affixed are flexed, as shown in Scheme 4(b). Fewer charges are produced on the nanocomposite with bending action. This is because compression/relaxation force acts only along the axis around which the PNG flexes. This causes a charge imbalance within both the electrodes and in order to neutralize this effect, charges start flowing through the external circuit. This leads to the flow of piezoelectric current in the external circuit. When the compressive excitation ceases the piezo-potential vanishes and again a charge imbalance is created on the electrodes. In order to neutralize this effect, charges flow through the external circuit but now in the opposite direction.45 This explains the presence of the positive and negative half cycles in the piezoelectric output response.
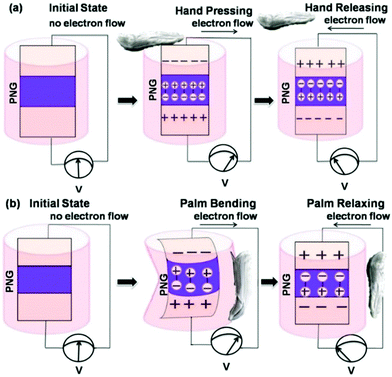 | ||
| Scheme 4 Schematic illustration of the working mechanism of the PNG under (a) human palm tappings and (b) bendings. | ||
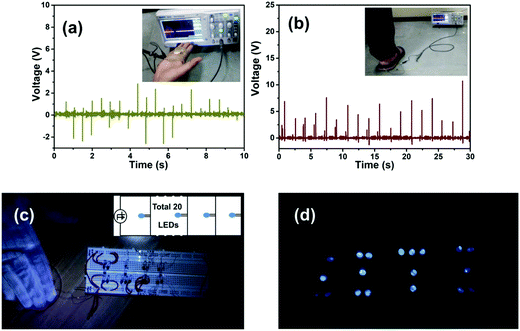
In order to harvest biomechanical energy, the PNG was attached to a human palm on the fingers. The output voltage generated is shown in Fig. 9(a) under continuous finger opening and closing action. The PNG was also affixed to a foot wearable flip-flop/slipper and the output voltage was recorded by wearing and simulating foot-stepping/walking action, which is shown in Fig. 9(b). The video for the above-mentioned applications is provided in the ESI.† Table S1 provided in the ESI,† shows that the present work exhibits output performance comparable to that of other piezoelectric nanogenerators. The PNG was connected in parallel connection on a breadboard to 20 commercial blue light emitting diodes (LEDs), without connecting any rectifier in between, which is shown in Fig. 9(c). The figure given in the inset shows the circuit diagram of the connections following which the LEDs were connected to a breadboard. Under constant hand impulse imparting action on the PNG, the LEDs start flickering light which is shown in Fig. 9(d). The video for the above application is given in the ESI. This indicates that the PNG shown in this work can be used for the development of clean energy based lighting solutions for the future.
To examine the long-term usage we tested the PNG with a mechanically operated piezoelectric excitation source consecutively for three hours, which is shown in Fig. 10. We used the mechanically operated piezoelectric excitation source because it is not possible to provide constant stress imparting and release by a human hand for hours. The output voltage is less in this case as the magnitude of the stress provided by the mechanically operated excitation source is less compared to human hand impulse. The good durability of the PNG indicates its robust capability for body wearable applications for long-term usage. The good durability of the PNG is attributed to the PDMS encapsulation of the nanocomposite films.
 | ||
| Fig. 10 Durability of the PNG when tested with a mechanically operated piezoelectric excitation source consecutively for three hours. | ||
Conclusions
This work demonstrates the successful synthesis of rGO–Ag/PVDF based nanocomposites via a solution casting method. Different weight percent loading of rGO–Ag was added to the PVDF. The nanocomposite films were encapsulated by PDMS to fabricate a piezoelectric nanogenerator (PNG). XRD and FT-IR spectroscopy studies were conducted on the nanocomposite films displaying the nucleation of piezoelectric polar phases. rGO–Ag propagates the nucleation of crystalline piezoelectric β- (mainly) and γ-phases instead of the intrinsic non-polar α-phase. A P–E loop test showed the energy storage capability of the nanocomposite films. The PNG showed a peak open circuit voltage of ∼18 V and a short circuit current of ∼1.05 μA. A peak power density of ∼28 W m−3 was shown by the PNG when connected across a 1 MΩ resistor. The PNG showed an efficiency of 0.65%. The biomechanical energy harvesting performance of the PNG is shown by attaching it to a human palm, followed by continuous finger flexing. Also, to show body/apparel/foot-wear attachable applications of the PNG it was affixed to flip-flops/slippers and the output voltage response was recorded with human foot tapping excitations. The PNG could light 20 commercial blue light emitting diodes simultaneously under imparting repeated human palm impulses and could charge a 10 μF capacitor to 7 V in ∼550 s. The PNG showed a good durability indicating its long term usage.Conflicts of interest
The authors declare no competing financial interests.Acknowledgements
This work was supported by the Department of Science and Technology (SERB-DST), India by awarding a prestigious ‘Ramanujan Fellowship’ (SR/S2/RJN-121/2012), CSIR research grant no. 03(1349)/16/EMR-II to PMS and CSIR-SRF Fellowship 09/1022(0046)/2018-EMR-I to MP. PMS is thankful to Prof. Pradeep Mathur, Director, IIT Indore, for encouraging research and providing the necessary facilities. The help received from SIC, IIT Indore is also acknowledged. The authors acknowledge DST FIST (SR/FST/PSI-225/2016) in Physics. We also acknowledge the support received from Dr V. Raghavendra Reddy, Scientist, UGC-DAE Consortium for Scientific Research, Indore towards carrying out the P–E loop test experiment.References
- X. Ren, H. Fan, C. Wang, J. Ma, H. Lia, M. Zhang, S. Lei and W. Wang, Nano Energy, 2018, 50, 562–570 CrossRef CAS.
- X. Ren, H. Fan, C. Wang, J. Ma, S. Lei, Y. Zhao, H. Li and N. Zhao, Nano Energy, 2017, 35, 233–241 CrossRef CAS.
- X. Ren, H. Fan, J. Ma, C. Wang, Y. Zhao and S. Lei, ACS Sustainable Chem. Eng., 2017, 5, 1957–1964 CrossRef CAS.
- B. Saravanakumar, R. Mohan, K. Thiyagarajan and S. J. Kim, RSC Adv., 2013, 3, 16646–16656 RSC.
- Z. H. Lin, Y. Yang, J. M. Wu, Y. Liu, F. Zhang and Z. L. Wang, J. Phys. Chem. Lett., 2012, 3, 3599–3604 CrossRef CAS PubMed.
- K. I. Park, C. K. Jeong, J. Ryu, G. T. Hwang and K. J. Lee, Adv. Energy Mater., 2013, 3, 1539–1544 CrossRef CAS.
- M. M. Alam, S. K. Ghosh, A. Sultana and D. Mandal, Nanotechnology, 2015, 26, 165403 CrossRef PubMed.
- C. T. Huang, J. Song, W. F. Lee, Y. Ding, Z. Gao, Y. Hao, L. J. Chen and Z. L. Wang, J. Am. Chem. Soc., 2010, 132, 4766–4771 CrossRef CAS PubMed.
- X. Ren, H. Fan, Y. Zhao and Z. Liu, ACS Appl. Mater. Interfaces, 2016, 8, 26190–26197 CrossRef CAS PubMed.
- K. Y. Lee, M. K. Gupta and S. W. Kim, Nano Energy, 2015, 14, 139–160 CrossRef CAS.
- L. Persano, A. Camposeo and D. Pisignano, Prog. Polym. Sci., 2015, 43, 48–95 CrossRef CAS.
- A. J. Lovinger, Science, 1983, 220, 1115–1121 CrossRef CAS PubMed.
- P. Martins, A. C. Lopes and S. L. Mendez, Prog. Polym. Sci., 2014, 39, 683 CrossRef CAS.
- W. Wang, H. Fan and Y. Ye, Polymer, 2010, 51, 3575–3581 CrossRef CAS.
- D. Song, D. Yang and Z. Feng, J. Mater. Sci., 1990, 25, 57–64 CrossRef CAS.
- M. M. Tao, F. Liu, B. R. Ma and L. X. Xue, Desalination, 2013, 316, 137–145 CrossRef CAS.
- T. Kuilla, S. Bhadra, D. Yao, N. Hoon Kim, S. Bose and J. H. Lee, Prog. Polym. Sci., 2010, 35, 1350–1375 CrossRef CAS.
- H. Kim, A. A. Abdala and C. W. Macosko, Macromolecules, 2010, 43, 6515–6530 CrossRef CAS.
- D. Wang, Y. Bao, J. W. Zha, J. Zhao, Z. M. Dang and G. H. Hu, ACS Appl. Mater. Interfaces, 2012, 4, 6273–6279 CrossRef CAS PubMed.
- M. Pusty, A. Sharma, L. Sinha, A. Chaudhary and P. Shirage, ChemistrySelect, 2017, 2(9), 2774–2782 CrossRef.
- S. K. Karan, D. Mandal and B. B. Khatua, Nanoscale, 2015, 7, 10655–10666 RSC.
- S. K. Karan, R. Bera, S. Paria, A. K. Das, S. Maiti, A. Maitra and B. B. Khatua, Adv. Energy Mater., 2016, 6, 1601016 CrossRef.
- S. Garain, S. Jana, T. K. Sinha and D. Mandal, ACS Appl. Mater. Interfaces, 2016, 8, 4532–4540 CrossRef CAS PubMed.
- V. Bhavanasi, V. Kumar, K. Parida, J. Wang and P. S. Lee, ACS Appl. Mater. Interfaces, 2016, 8, 521–529 CrossRef CAS PubMed.
- T. K. Sinha, S. K. Ghosh, R. Maiti, S. Jana, B. Adhikari, D. Mandal and S. K. Ray, ACS Appl. Mater. Interfaces, 2016, 8(24), 14986–14993 CrossRef CAS PubMed.
- G. Chen, X. Wang, J. Lin, W. Yang, H. Li, Y. Wen, L. Li, Z. Jiang and Q. Lei, J. Mater. Chem. C, 2016, 4, 8070–8076 RSC.
- M. M. Alam and D. Mandal, ACS Appl. Mater. Interfaces, 2016, 8, 1555–1558 CrossRef CAS PubMed.
- Y. K. Fuh, J. C. Ye, P. C. Chen, H. C. Ho and Z. M. Huang, ACS Appl. Mater. Interfaces, 2015, 7, 16923–16931 CrossRef CAS PubMed.
- R. Ghosh, A. Midya, S. Santra, S. K. Ray and P. K. Guha, ACS Appl. Mater. Interfaces, 2013, 5(15), 7599–7603 CrossRef CAS PubMed.
- R. Ghosh, M. Pusty and P. K. Guha, IEEE Trans. Nanotechnol., 2016, 15, 268–273 CAS.
- W. S. Jung, M. G. Kang, H. G. Moon, S. H. Baek, S. J. Yoon, Z. L. Wang, S. W. Kim and C. Y. Kang, Sci. Rep., 2015, 5, 9309–9314 CrossRef CAS PubMed.
- P. Martins, J. S. Nunes, G. Hungerford, D. Miranda, A. Ferreira, V. Sencadas and S. L. Méndez, Phys. Lett. A, 2009, 373, 177–180 CrossRef CAS.
- M. Kanik, O. Aktas, H. S. Sen, E. Durgun and M. Bayindir, ACS Nano, 2014, 8, 9311–9323 CrossRef CAS PubMed.
- P. Martins, J. S. Nunes, G. Hungerford, D. Miranda, A. Ferreira, V. Sencadas and S. L. Méndez, Phys. Lett. A, 2009, 373, 177–180 CrossRef CAS.
- Y. Li, J. Z. Xu, L. Zhu, H. Xu, M. W. Pan, G. J. Zhong and Z. M. Li, Polymer, 2014, 55, 4765–4775 CrossRef CAS.
- Y. Li, J. Z. Xu, L. Zhu, G. J. Zhong and Z. M. Li, J. Phys. Chem. B, 2012, 116(51), 14951–14960 CrossRef CAS PubMed.
- M. Casciola, D. Capitani, A. Donnadio, V. Diosono, P. Piaggio and M. Pica, J. Mater. Chem., 2008, 18, 4291–4296 RSC.
- I. S. Elashmawi and L. H. Gaabour, Results Phys., 2015, 5, 105–110 CrossRef.
- P. Singh, H. Borkar, B. P. Singh, V. N. Singh and A. Kumar, AIP Adv., 2014, 4, 087117–087127 CrossRef.
- C. J. L. Constantino, A. E. Job, R. D. Simoes, J. A. Giacometti, V. Zucolotto, Jr., O. N. Oliveira, G. Gozzi and D. L. Chinaglia, Appl. Spectrosc., 2005, 59(3), 275–283 CrossRef CAS PubMed.
- M. Pusty, A. K. Rana, Y. Kumar, V. Sathe, S. Sen and P. Shirage, ChemistrySelect, 2016, 1(14), 4235–4245 CrossRef CAS.
- X. J. Zhang, G. S. Wang, W. Q. Cao, Y. Z. Wei, M. S. Cao and L. Guo, RSC Adv., 2014, 4, 19594–19601 RSC.
- W. S. Jung, M. G. Kang, H. G. Moon, S. H. Baek, S. J. Yoon, Z. L. Wang, S. W. Kim and C. Y. Kang, Sci. Rep., 2015, 5, 9309–9314 CrossRef CAS PubMed.
- Y. Kumar, A. K. Rana, P. Bhojane, M. Pusty, V. Bagwe, S. Sen and P. M. Shirage, Mater. Res. Express, 2015, 2, 105017 CrossRef.
- R. Ding, X. Zhang, G. Chen, H. Wang, R. Kishor, J. Xiao, F. Gao, K. Zeng, X. Chen, X. W. Sun and Y. Zheng, Nano Energy, 2017, 37, 126–135 CrossRef CAS.
Footnote |
| † Electronic supplementary information (ESI) available: Curve deconvolution of XRD, FTIR, Raman spectroscopy, X-ray photoelectron spectroscopy (XPS), electrical characterizations, stress vs. strain curve, and videos of LED lighting by the PNG and biomechanical energy harvesting application of the PNG. See DOI: 10.1039/c8nj04751k |
| This journal is © The Royal Society of Chemistry and the Centre National de la Recherche Scientifique 2019 |

