Regulating peroxidase-like activity of Pd nanocubes through surface inactivation and its application for sulfide detection†
Yi
Wang
 *a,
Pu
Zhang
b,
Lei
Liu
a,
Fei
Xue
c,
Maochang
Liu
*c,
Ling
Li
a and
Wensheng
Fu
*a
aChongqing Key Laboratory of Green Synthesis and Applications, and College of Chemistry, Chongqing Normal University, Chongqing 401331, China. E-mail: ywang@cqnu.edu.cn; fuwensheng@cqnu.edu.cn
bCollege of Pharmacy, Chongqing Medical University, Chongqing 400016, China
cInternational Research Center for Renewable Energy, State Key Laboratory of Multiphase Flow in Power Engineering, Xi’an Jiaotong University, Xi’an, Shanxi 710049, China. E-mail: maochangliu@mail.xjtu.edu.cn
First published on 19th November 2018
Abstract
A new analytical method is described for the colorimetric detection of sulfide. This approach involves the use of Pd nanocubes (PdNCs) as artificial peroxidases that can effectively generate a colored signal by catalyzing the oxidation of peroxidase substrates. In the presence of sulfide, the colored signal is greatly diminished because of the specific and efficient inhibition of the peroxidase-like activity of the PdNCs through their surface inactivation by the formation of PdS. Based on this finding, sulfide assay can be achieved in the 0.125–2.75 μM concentration range with a detection limit of 80 nM. This method shows high selectivity to sulfide besides other ions, and has been applied for the determination of sulfide in spiked real samples. It also features simplicity and rapidness since the assay can be conducted at room temperature, in aqueous solution, and requires only ∼5 min.
Introduction
Peroxidases are a family of enzymes that catalyze the oxidation of certain compounds with peroxides (H2O2 in most cases). They are known to play vital roles in biological systems such as detoxifying H2O2 in human bodies or defending against pathogens in plants.1,2 Unlike natural peroxidases, peroxidase mimics made of nanoscale particles are easy to isolate and purify, and are also more stable under different harsh conditions.3 A wide range of nanomaterials including metal oxides,4,5 noble metals,6 carbon materials,7 metal–organic frameworks,8,9 and hybrid materials10 were reported to show similar peroxidase-like properties over the past decade. Among different nanomaterials, noble metal nanocrystals with anisotropic shapes or enclosed by a specific facet usually show high catalytic efficiencies. For instance, Zheng et al. synthesized 2D Pd-based nanostructures and found that their enzyme-mimic catalytic activities are structure- and composition-dependent.11 Xia et al. prepared a novel structure of Pd–Ir core–shell nanocubes enclosed by {100} facets, which show a catalytic constant (Kcat) as high as 1.9 × 10⁶ s−1.12 In addition, Pt nanocubes and Ru nanoframes were also found to have high enzyme-mimic catalytic efficiencies.13–15 However, most applications of the peroxdiase-like activity of metal nanoparticles for sensing are limited to H2O2 or oxidase substrates (e.g., glucose, xanthine, and uric acid) which can generate H2O2 in the presence of relevant oxidases.16–18 Therefore, design and exploration of new sensing strategies by means of the unique peroxidase-like catalytic activity of noble metal nanostructures is essential for expanding their applications.As a traditional environmental contaminant, sulfide is widely distributed in natural water and wastewater. It is either used as a reactant or generated as a byproduct in petrochemical, leather, and paper industries.19 Excessive exposure to sulfide may cause a series of problems such as dizziness, unconsciousness, irritation in mucous membranes, permanent brain damage or even asphyxiation.20 Therefore, quantitative detection of sulfide is important in the assessment of environmental quality and protection of human health. To this end, a variety of different analytical methods have been developed for sulfide assay, including titration,21 chromatography,22 electrochemistry,23–25 fluorimetry,26 capillary electrophoresis,27 and inductively coupled plasma-atomic emission spectroscopy.28 However, many of the available methods for sulfide detection are limited in practical applications due to their intrinsic shortcomings of being time consuming, having poor selectivity, and requiring expensive instruments or complicated procedures. Therefore, development of rapid, simple and convenient approaches for sulfide detection is still highly desired.
In this work, the peroxidase-like activity of Pd nanocubes (PdNCs) is precisely regulated through surface poisoning by sulfide. PdNCs of 18 nm in size were prepared by a one-pot synthesis method according to a previously reported procedure.29 It was found that PdNCs have excellent catalytic activity toward the oxidation of peroxidase substrate 3,3′,5,5′-tetramethylbenzidine (TMB) in the presence of H2O2. Nevertheless, their peroxidase-like activity was significantly inhibited in the presence of NaHS, and the activity decrease was correlated with the concentration of HS−. Based on this finding, a colorimetric method for sensitive and selective detection of sulfide is developed (Scheme 1).
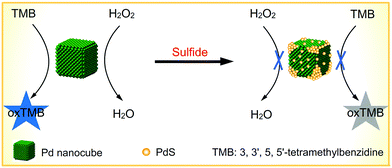 | ||
| Scheme 1 Schematic illustration of the regulating peroxidase-like activity of Pd nanocubes through surface inactivation and its application for sulfide assay. | ||
Experimental
Chemicals and characterization
The details of all chemicals and instrumentation used in this work are shown in the ESI.†Preparation of PdNCs
In a typical synthesis, 8.0 mL of an aqueous solution containing 105 mg of poly(vinyl pyrrolidone) (PVP), 60 mg of ascorbic acid (AA) and 600 mg of KBr was hosted in a vial and preheated to 80 °C in an oil bath under magnetic stirring for 10 min. Subsequently, 3.0 mL of an aqueous solution containing 57 mg of Na2PdCl4 was added using a pipette. After the vial had been capped, the reaction was allowed to continue at 80 °C for 3 h. The cubic Pd product was collected by centrifugation, washed three times with water and re-dispersed in 11 mL water.Preparation of Pd octahedrons
Pd octahedrons (∼20 nm) were prepared using a seeded growth method. Firstly, Pd seeds of ∼10 nm in size were synthesized using the same method as that for the preparation of PdNCs, except for the addition of 300 mg of KBr. Then, 0.3 mL of the Pd seeds was mixed with 105 mg PVP, 100 μL HCHO and 7.6 mL water in a vial at 60 °C. After that, 3 mL of an aqueous solution containing 28.5 mg of Na2PdCl4 was rapidly injected into the vial. The reaction was allowed to continue at 60 °C for 3 h. The octahedral Pd nanocrystals were collected by centrifugation, washed three times with water and re-dispersed in water.General procedure for sulfide detection
Typically, 100 μL TMB (1.0 mM), 100 μL H2O2 (100 mM), 15 μL PdNCs (1.5 mg mL−1), and 100 μL NaHS at different concentrations were added into 685 μL phosphate buffer (pH 4.5). The solution was mixed thoroughly and incubated for 5 min at room temperature, and then used for absorption spectroscopy measurements.Results and discussion
Strategy design for sulfide assay
The detection method relies on the high peroxidase-like activity of PdNCs and specific inhibition of their catalytic activity by sulfide. It has been demonstrated that the PdNCs enclosed by {100} facets exhibit excellent peroxidase-like activity.12 In this case, the oxidation of TMB by H2O2 can be efficiently catalyzed and thus generates an intense blue-colored signal (i.e., from oxidized TMB with a maximum absorbance at 652 nm). In the presence of sulfide, some of the surface Pd atoms on the nanocubes would transform into PdS immediately since the solubility product constant (Ksp, 25 °C) of PdS is as low as 2.03 × 10−58. Namely, the surfaces of the PdNCs are specifically and strongly passivated, resulting in partial or total deactivation of the PdNCs for catalysis. Thus, the generation of the blue-colored signal will be inhibited. The more sulfide in the detection system, the weaker the blue-colored signal generated by the catalytic reaction. Based on the precise regulation of sulfide concentration, sulfide assay can be conveniently achieved through measuring the absorbance at 652 nm of the solution using an UV-Vis spectrometer or observing the solution color with the naked eye.Feasibility demonstration of the strategy for sulfide assay
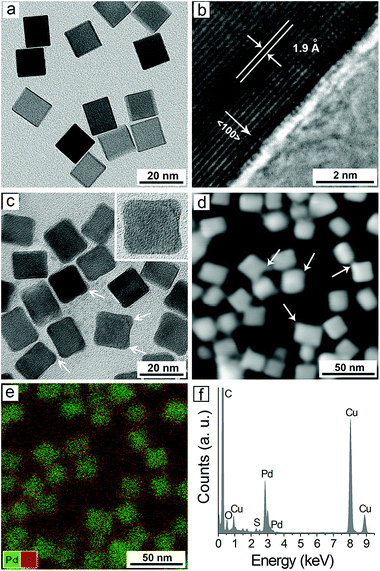
Fig. 1a shows a representative transmission electron microscopy (TEM) image of the prepared PdNCs from a standard synthesis. It was found that the particles displayed well-defined cubic shape, sharp corners and smooth surfaces. The average edge length of the cubes was measured to be 18.2 ± 1.5 nm. The high-resolution TEM image of an individual cube clearly shows a lattice fringe spacing of 1.9 Å (Fig. 1b), which can be indexed to the {200} reflections of face centered-cubic Pd.29 Interestingly, obvious morphological changes of the PdNCs were observed after their interaction with NaHS.Specifically, the surfaces of the cubes became rugged and the corners protruded out of the cubes (Fig. 1c). The same phenomenon was also observed by high-angle annular dark-field scanning TEM (HAADF-STEM) imaging after their reaction (see the white arrows, Fig. 1d). Moreover, energy dispersive X-ray (EDX) elemental analysis further intuitively demonstrated the formation of a thin layer of PdS on the surfaces of the PdNCs (Fig. 1e). The EDX spectrum clearly showed that Pd and S were both involved in the sample after the reaction of PdNCs with HS−, and the atomic ratio of Pd to S was ∼9![[thin space (1/6-em)]](https://www.rsc.org/images/entities/char_2009.gif) :
:![[thin space (1/6-em)]](https://www.rsc.org/images/entities/char_2009.gif) 1 (Fig. 1f). In addition, X-ray photoelectron spectroscopy (XPS) and dynamic light scattering (DLS) measurements were also carried out, and the results further confirmed that PdS was formed on the surfaces of PdNCs (Fig. S1 and S2, ESI†). Our previous work has indicated that sulfuration of noble metal nanoparticles on their surface easily occurs when trace amounts of sulfide exist.30 In addition, it has also been demonstrated that the sulfuration preferentially occurs at the corners of the metal nanoparticles when they are in anisotropic shapes (e.g., triangular and cubic shapes).31 Herein, the preferential sulfuration at the corners of the PdNCs leads to the formation of slightly concaved surfaces on the cubes.
1 (Fig. 1f). In addition, X-ray photoelectron spectroscopy (XPS) and dynamic light scattering (DLS) measurements were also carried out, and the results further confirmed that PdS was formed on the surfaces of PdNCs (Fig. S1 and S2, ESI†). Our previous work has indicated that sulfuration of noble metal nanoparticles on their surface easily occurs when trace amounts of sulfide exist.30 In addition, it has also been demonstrated that the sulfuration preferentially occurs at the corners of the metal nanoparticles when they are in anisotropic shapes (e.g., triangular and cubic shapes).31 Herein, the preferential sulfuration at the corners of the PdNCs leads to the formation of slightly concaved surfaces on the cubes.
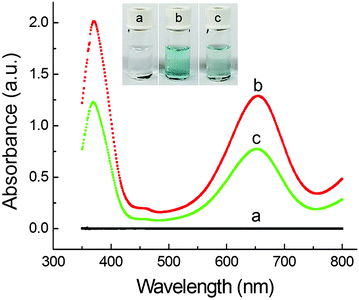
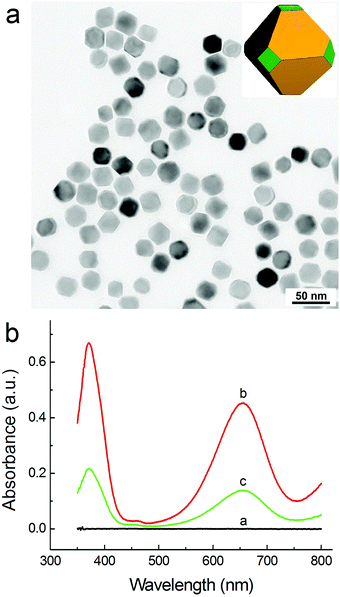
Based on this finding, we started to demonstrate the feasibility of the PdNC-catalyzed oxidation of TMB by H2O2 and its application for colorimetric sulfide assay. As shown in Fig. 2, the solution of a TMB–H2O2 mixture (trace a) is colorless, indicating that TMB cannot be oxidized by H2O2 in the absence of a catalyst. In the presence of PdNCs in the system, the TMB–H2O2 solution exhibits a distinguishable blue color with a maximum absorbance at 652 nm (trace b). However, when PdNCs were incubated with 1 μM NaHS before adding to the TMB–H2O2 solution, an obvious decrease of absorbance at 652 nm as well as a change in the solution color was observed (trace c). This result implies that HS− can effectively inhibit the peroxidase-like activity of the PdNCs through surface poisoning, which is able to be used for colorimetric detection of sulfide.
Colorimetric assay of sulfide
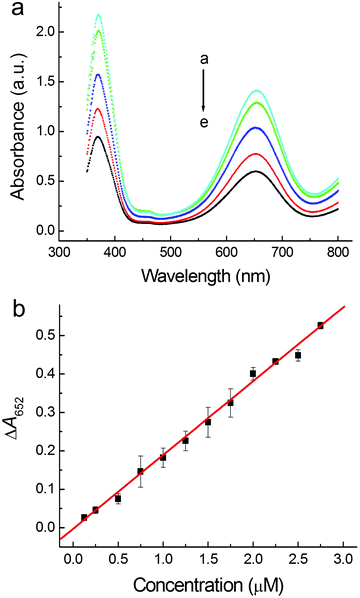
Based on the continual decrease of the absorbance at 652 nm along with the increase of HS− concentration (Fig. 3a), a new analytical method for quantitative detection of sulfide was established. The effects of solution pH as well as the amounts of introduced PdNCs and TMB on the inhibition of the peroxidase-like activity of PdNCs were investigated. To obtain absolute concentrations of PdNCs, the nanoparticles were firstly dissolved in aqua regia and then measured using a UV-Vis spectrometer. The concentration of the PdNCs was calculated according to the calibration curve that was obtained by recording the absorbance of PdCl42− at 279 nm (Fig. S3, ESI†), which had been proved to be an effective approach for calculating the concentration of Pd nanoparticles in our previous work.32 It was found that the maximum inhibition of the catalytic activity occurred when the pH was around 4.5, and 22.5 μg mL−1 PdNCs and 10 mM TMB were introduced into the system (Fig. S4–S6, ESI†).Colorimetric detection of sulfide was subsequently achieved under the optimal conditions. All measurements were performed in triplicate, and the data were recorded as a mean. As shown in Fig. 3b, the value of absorbance decrease at 652 nm was linearly correlated with the increasing concentration of NaHS from 0.125 to 2.75 μM, and the limit of detection (LOD) was 80 nM (3σ). Compared with most previous studies for colorimetric sulfide assay using metal nanoparticles as nanoprobes,30,33–41 this method shows higher sensitivity and a comparable detectable range (Table 1).
| Analytical probe | Linear range (μM) | LOD (μM) | Ref. |
|---|---|---|---|
| Ag nanoparticles | 0.5–7.5 | 0.15 | 30 |
| Ag nanoparticles | 0.8–6.4 | 0.35 | 33 |
| Au nanoparticles | 5–15 | 3 | 34 |
| Au nanoparticles | 3–10 | 0.2 | 35 |
| Au nanoparticles | 0.5–10 | 0.08 | 36 |
| Au/Ag nanorods | 0.5–5 | 0.5 | 37 |
| Au/AgI nanoparticles | 0.5–5 | 0.5 | 38 |
| Au@Pt nanoparticles | 0.01–0.1 | 0.0075 | 39 |
| Cu nanoclusters | 0.5–20 | 0.5 | 40 |
| Cu nanoparticles | 12.5–50 | 8.1 | 41 |
| Pd nanocrystals | 0.125–2.75 | 0.08 | This work |
Selectivity and real sample detection
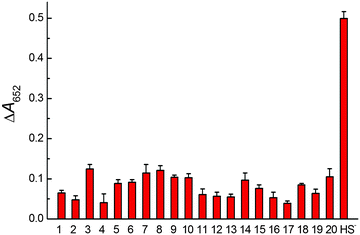
The absorbance responses of this method toward common ions in environmental water were measured. As shown in Fig. 4, the absorbance change at 652 nm reached ∼0.5 when 2.5 μM HS− was introduced. In contrast, the values were ∼0.1 or less when other common ions of the same concentration were added (i.e., one fifth of the signal that was observed in the presence of HS−). These results indicate that common ions have a negligible effect on the absorbance values of the system and thus high selectivity of this method for sulfide assay. We speculated that the high selectivity was attributed to the strong interaction between the Pd2+ on the surfaces of the PdNCs and sulfide (Ksp of PdS at 25 °C is 2.03 × 10−58).To demonstrate the reliability and potential applications of this strategy for sulfide assay, the concentrations of sulfide in environmental samples including tap water (collected from our lab) and river water (collected from the Yangtze River) were detected. First, the concentrations of sulfide in tap water and river water were measured by a conventional methylene blue standard method. However, no sulfide was detected in either of the two real samples. Then, the standard addition method was used to achieve the sulfide assay in real samples. Satisfactory quantitative spike recoveries of 96.4–102.5% and 93.0–98.8% in tap water and river water were obtained, respectively (Table 2). The results of this method are also comparable with those of the conventional methylene blue standard method. All of these results demonstrate that the present method has great potential applications for the detection of sulfide in environmental samples.
| Sample | Spiked (μM) | Found (μM) | Recovery (%) | Found (μM) | Recovery (%) |
|---|---|---|---|---|---|
| This method | This method | Standard method | Standard method | ||
| Tap water | 0.5 | 0.482 | 96.4 | 0.495 | 99.0 |
| 1.0 | 1.025 | 102.5 | 0.942 | 94.2 | |
| 2.0 | 1.958 | 97.9 | 1.914 | 95.7 | |
| River water | 0.5 | 0.465 | 93.0 | 0.506 | 101.2 |
| 1.0 | 0.988 | 98.8 | 0.965 | 96.5 | |
| 2.0 | 1.890 | 94.5 | 1.908 | 95.4 |
Universality of this method for sulfide assay
In addition, the universality of peroxidase-like activity and its application for sulfide assay was further studied using Pd nanocrystals with an octahedral shape as the nanozyme. As shown in Fig. 5, the as-prepared truncated Pd octahedrons are uniform in both size and shape, with an edge length of ∼20 nm. Similar to PdNCs, the Pd octahedrons also have the ability to catalyze the oxidation of TMB in the presence of H2O2, and their peroxidase-like activity is also able to be inhibited in the presence of NaHS. The detectable range and sensitivity for sulfide assay are the same as those of PdNCs (Fig. S7, ESI†), and the method involved in Pd octahedrons also shows good selectivity toward sulfide besides other common ions (Fig. S8, ESI†). It is known that different shapes or facets of Pd nanocrystals usually show distinct catalytic activity;42 however, herein the Pd nanocrystals with cubic and truncated octahedral shapes displayed almost the same peroxidase-like activity and thus the performance in the detection of sulfide. This result might be attributed to the relatively small sizes of the Pd nanocrystals that were used in the present system, where the shape/facet-dependent catalytic activity and selectivity are negligible. In other words, Pd nanocrystals with different shapes and relatively small sizes are able to be used as a universal nanozyme and thus applied for sulfide detection.Conclusions
In summary, the peroxidase-like activity of Pd nanocrystals was precisely regulated through surface inactivation by sulfide. Based on this mechanism, a reliable colorimetric method for sulfide assay was successfully developed. This method is simple, fast (complete within 5 min), and highly sensitive (LOD: 80 nM). The high detection sensitivity relies on the ultrahigh peroxidase-like activity of Pd nanocrystals and the efficient inhibition toward this catalytic activity by sulfide. The specific interaction of sulfide with Pd nanocrystals and thus the formation of PdS layers allow selective sulfide assay besides other common ions. We believe that the present method will find widespread use in quantifying sulfide ions or hydrogen sulfide in environmental scenarios or biological processes. Moreover, Pd nanocrystals with superior peroxidase-like activity can also be extended to other systems for sensing.Conflicts of interest
There are no conflicts to declare.Acknowledgements
This work was supported by the National Natural Science Foundation of China (No. 21775014, 21505012, and 81501837), Natural Science Foundation of Chongqing, China (No. cstc2017jcyjAX0368), and Achievement Transfer Program of Institutions of Higher Education in Chongqing (No. KJZH17112). Y. W. was also supported by the Program for Top-Notch Young Innovative Talents of Chongqing Normal University (No. 02030307-00026).Notes and references
- G. F. Gaetani, S. Galiano, L. Canepa, A. M. Ferraris and H. N. Kirkman, Blood, 1989, 73, 334–339 CAS.
- S. Hiraga, K. Sasaki, H. Ito, Y. Ohashi and H. Matsui, Plant Cell Physiol., 2001, 42, 462–468 CrossRef CAS PubMed.
- M. Nasir, M. H. Nawaz, U. Latif, M. Yaqub, A. Hayat and A. Rahim, Microchim. Acta, 2016, 184, 323–342 CrossRef.
- L. Gao, J. Zhuang, L. Nie, J. Zhang, Y. Zhang, N. Gu, T. Wang, J. Feng, D. Yang, S. Perrett and X. Yan, Nat. Nanotechnol., 2007, 2, 577–583 CrossRef CAS PubMed.
- W. Lai, Q. Wei, M. Xu, J. Zhuang and D. Tang, Biosens. Bioelectron., 2017, 89, 645–651 CrossRef CAS PubMed.
- Z. Gao, G. G. Liu, H. Ye, R. Rauschendorfer, D. Tang and X. Xia, Anal. Chem., 2017, 89, 3622–3629 CrossRef CAS PubMed.
- W. Shi, Q. Wang, Y. Long, Z. Cheng, S. Chen, H. Zheng and Y. Huang, Chem. Commun., 2011, 47, 6695–6697 RSC.
- H. Cheng, Y. Liu, Y. Hu, Y. Ding, S. Lin, W. Cao, Q. Wang, J. Wu, F. Muhammad, X. Zhao, D. Zhao, Z. Li, H. Xing and H. Wei, Anal. Chem., 2017, 89, 11552–11559 CrossRef CAS PubMed.
- R. Ren, G. Cai, Z. Yu, Y. Zeng and D. Tang, Anal. Chem., 2018, 90, 11099–11105 CrossRef CAS PubMed.
- L.-N. Zhang, H.-H. Deng, F.-L. Lin, X.-W. Xu, S.-H. Weng, A.-L. Liu, X. H. Lin, X. H. Xia and W. Chen, Anal. Chem., 2014, 86, 2711–2718 CrossRef CAS PubMed.
- J. Wei, X. Chen, S. Shi, S. Mo and N. Zheng, Nanoscale, 2015, 7, 19018–19026 RSC.
- X. Xia, J. Zhang, N. Lu, M. J. Kim, K. Ghale, Y. Xu, E. McKenzie, J. Liu and H. Ye, ACS Nano, 2015, 9, 9994–10004 CrossRef CAS PubMed.
- H. Ye, Y. Liu, A. Chhabra, E. Lilla and X. Xia, ChemNanoMat, 2017, 3, 33–38 CrossRef CAS.
- Z. Gao, S. Lv, M. Xu and D. Tang, Analyst, 2017, 142, 911–917 RSC.
- H. Ye, J. Mohar, Q. Wang, M. Catalano, M. J. Kim and X. Xia, Sci. Bull., 2016, 61, 1739–1745 CrossRef CAS.
- T. G. Choleva, V. A. Gatselou, G. Z. Tsogas and D. L. Giokas, Microchim. Acta, 2018, 185, 22 CrossRef PubMed.
- X.-X. Wang, Q. Wu, Z. Shan and Q.-M. Huang, Biosens. Bioelectron., 2011, 26, 3614–3619 CrossRef CAS PubMed.
- S. Kumar, P. Bhushan and S. Bhattacharya, Anal. Methods, 2016, 8, 6965–6973 RSC.
- E. Howard, J. Henriksen, A. Buchan, C. Reisch, H. Bürgmann, R. Welsh, W. Ye, J. M. González, K. Mace, S. B. Joye, R. P. Kiene, W. B. Whitman and M. A. Moran, Science, 2006, 314, 649–652 CrossRef CAS PubMed.
- H. Peng, Y. Cheng, C. Dai, A. L. King, B. L. Predmore, D. J. Lefer and B. Wang, Angew. Chem., Int. Ed., 2011, 50, 9672–9675 CrossRef CAS PubMed.
- Z. Pawlak and A. S. Pawlak, Talanta, 1999, 48, 347–353 CrossRef CAS PubMed.
- D. Tang and P. H. Santschi, J. Chromatogr. A, 2000, 883, 305–309 CrossRef CAS PubMed.
- X. Cao, H. Xu, S. Ding, Y. Ye, X. Ge and L. Yu, Food Chem., 2016, 194, 1224–1229 CrossRef CAS PubMed.
- J. Shu, Z. Qiu, S. Lv, K. Zhang and D. Tang, Anal. Chem., 2017, 89, 11135–11142 CrossRef CAS PubMed.
- J. Shu, Z. Qiu and D. Tang, Anal. Chem., 2018, 90, 9691–9694 CrossRef CAS PubMed.
- P. Ni, C. Chen, Y. Jiang, Z. Zhao and Y. Lu, Microchim. Acta, 2018, 185, 362 CrossRef PubMed.
- Z. Daunoravicius and A. Padarauskas, Electrophoresis, 2015, 23, 2439–2444 CrossRef.
- M. Chertouk and A. Chovet, Anal. Chim. Acta, 2008, 609, 160–168 CrossRef PubMed.
- J. Zeng, C. Zhu, J. Tao, M. Jin, H. Zhang, Z.-Y. Li, Y. Zhu and Y. Xia, Angew. Chem., Int. Ed., 2012, 51, 2354–2358 CrossRef CAS PubMed.
- L. Liu, Y. Wang and W. Fu, Sens. Actuators, B, 2017, 247, 414–420 CrossRef CAS.
- J. Zeng, J. Tao, D. Su, Y. Zhu, D. Qin and Y. Xia, Nano Lett., 2011, 11, 3010–3015 CrossRef CAS PubMed.
- Y. Wang, H.-C. Peng, J. Liu, C. Z. Huang and Y. Xia, Nano Lett., 2015, 15, 1445–1450 CrossRef CAS PubMed.
- K. Shanmugaraj and M. Ilanchelian, Microchim. Acta, 2016, 183, 1721–1728 CrossRef CAS.
- J. Zhang, X. Xu and X. Yang, Analyst, 2012, 137, 1556–1558 RSC.
- Z. Yuan, F. Lu, M. Peng, C.-W. Wang, Y.-T. Tseng, Y. Du, N. Cai, C.-W. Lien, H.-T. Chang, Y. He and E. S. Yeung, Anal. Chem., 2015, 87, 7267–7273 CrossRef CAS PubMed.
- H.-H. Deng, S.-H. Weng, S.-L. Huang, L.-N. Zhang, A.-L. Liu, X.-H. Lin and W. Chen, Anal. Chim. Acta, 2014, 852, 218–222 CrossRef CAS PubMed.
- H. Huang, Q. Li, J. Wang, Z. Li, X.-F. Yu and P. K. Chu, Plasmonics, 2014, 9, 11–16 CrossRef CAS.
- J. Zeng, M. Li, A. Liu, F. Feng, T. Zeng, W. Duan, M. Li, M. Gong, C.-Y. Wen and Y. Yin, Adv. Funct. Mater., 2018, 28, 1800515 CrossRef.
- Z. Gao, D. Tang, D. Tang, R. Niessner and D. Knopp, Anal. Chem., 2015, 87, 10153–10160 CrossRef CAS PubMed.
- H. Liao, L. Hu, Y. Zhang, X. Yu, Y. Liu and R. Li, Microchim. Acta, 2018, 185, 143 CrossRef PubMed.
- A. Hatamie, B. Zargar and A. Jalali, Talanta, 2014, 121, 234–238 CrossRef CAS PubMed.
- M. Jin, H. Zhang, Z. Xie and Y. Xia, Energy Environ. Sci., 2012, 5, 6352–6357 RSC.
Footnote |
| † Electronic supplementary information (ESI) available: Experimental details, additional figures and results. See DOI: 10.1039/c8nj05138k |
| This journal is © The Royal Society of Chemistry and the Centre National de la Recherche Scientifique 2019 |

