
Fingerprint identification of copper ions with absorption and emission dual-mode responses by N,S co-doped red carbon dots†
Bo
Ju‡
,
Ting
Zhang‡
,
Song
Li
,
Jun
Liu
,
Weiran
Zhang
,
Minjie
Li
 * and
Sean Xiao-An
Zhang
* and
Sean Xiao-An
Zhang
State Key Laboratory of Supramolecular Structure and Materials, College of Chemistry, Jilin University, Changchun 130012, P. R. China. E-mail: liminjie@jlu.edu.cn
First published on 8th November 2018
Abstract
Research interest in applying fluorescent carbon dots (CDs) to construct sensing platforms for metal ions has drawn increasing attention recently because of the outstanding optical and chemical properties of CDs. However, traditional recognition methods are almost focused on the single fluorescence mode and the interference from competitive metal ions can hardly be fully avoided. It is highly desirable to develop multiple-mode detection methods to guarantee the detection accuracy. Here, heteroatom N,S-co doped red emissive carbon dots (R-CDs) with high photoluminescence quantum yield (∼23%) were prepared for sensing copper ions (Cu2+) selectively. Besides the fluorescence quenching effect by Cu2+, the change in the UV-vis absorption spectrum has been explored as an additional and exclusive sign for binding of Cu2+. Then, the unique coordination-assisted quenching mechanism was suggested to be responsible for both fluorescence quenching and absorption change. Furthermore, the highly selective and sensitive detection paper for Cu2+ has been efficiently developed. This work will pave the way toward sensing trace metal ions.
Introduction
Copper is not only an essential micronutrient but also an important component of protein in the human body.1 The intake of copper has an important influence on the development and functions of the body. Improper intake can lead to copper toxication and cause many health problems, such as gastrointestinal disorders and neuropsychological issues, etc.1 Until now, many traditional detection systems for determination of copper ions (Cu2+) have been developed, such as inductively coupled plasma mass spectrometry and flame atomic absorption spectrometry.2 However, these strategies need tedious operation procedures and expensive equipment. Fluorescence sensing as a low-cost, easy manipulation and highly efficient strategy has been widely used in many areas, which can eliminate the above limitations.3 At present, a large amount of fluorescence-based sensing systems have been explored to detect Cu2+, among which various fluorescent materials such as organic dyes,4 semiconducting quantum dots5,6 and metal–organic frameworks7,8 are available. However, these materials have disadvantages of toxicity, poor photostability and complicated preparation routes, which will greatly limit their practical applications.Compared with the above-mentioned traditional fluorescent materials, fluorescent carbon dots (CDs) have been extensively applied in many fields of bioimaging,9–11 photocatalysis12–14 and optoelectrical devices,15–17 owing to their facile manufacturing processes, better biocompatibility, high photostability and adjustable luminescence.18–22 To date, much breakthrough progress has been reported on the construction of CD-based fluorescent sensing platforms for the detection of Cu2+.23–28 However, these detection strategies are mainly involved in the simplest fluorescence sensing mode, and the manipulation processes are almost in the solution phase. Meanwhile, observation of the fluorescence quenching process can also bring measurement inaccuracy due to the inevitable interference caused by competitive ions. So, it is very important to explore an easy fingerprint recognition pathway for sensing Cu2+ selectively and sensitively and prevent the errors caused by other interference sources. In order to improve convenience and practicability, further monitoring of media is also urgently needed to be shown.
Herein, N,S co-doped red emissive CDs (R-CDs) with a high photoluminescence quantum yield of ∼23% were successfully synthesized through a simple solvothermal reaction from o-phenylenediamine (OPD), chloroform (CHCl3) and dithiothretiol (DTT). The as-prepared R-CDs with multiple functional groups exhibited highly sensitive and selective detection towards Cu2+ with an efficient fluorescence quenching degree (∼93%), and the detection limit can reach 2 μM. Then, UV-vis absorption spectroscopy has been efficiently explored as a fingerprint recognition strategy for monitoring the sensing process, which enhances the accuracy of identification. By detailed characterization, this highly selective detection of Cu2+ can be ascribed to be the unique coordination-assisted quenching mechanism between R-CDs and Cu2+. At last, a CD-based sensing paper has been successfully developed with fluorescence and absorption dual-mode sensing, which provides a reference for trace elements analysis of CDs.
Results and discussion
Solvothermal carbonization from organic molecular precursors is a widely adopted strategy for the preparation of heteroatom doped CDs.29 Here, N,S co-doped R-CDs were synthesized via a facile, one-step solvothermal process from CHCl3, OPD and DTT. Then, their optical properties were measured by UV-vis absorption spectra and photoluminescence (PL) spectra. In Fig. 1a, the R-CDs had an absorption peak at 271 nm and a broad tail at 435–570 nm, which correspond to the π → π* transitions of the aromatic C![[double bond, length as m-dash]](https://www.rsc.org/images/entities/char_e001.gif) C bond and the n → π* transitions of heteroatom-related chemical bonds (e.g., CO, CN, etc.) in aromatic sp2 structures, respectively.30 The as-prepared R-CDs in ethanol solution showed obvious red color luminescence under 570 nm excitation (inset, Fig. 1a). In a photoluminescence spectrum, the R-CDs exhibited excitation-independent fluorescence behaviors with the strongest emission band centered at 596 nm and a shoulder peak at 648 nm (Fig. 1b). The absolute quantum yield of 23.26% was examined under optimal 570 nm excitation (Fig. S1, ESI†). Then, transmission electron microscopy (TEM) was performed to characterize the morphology of the R-CDs. Fig. 1c shows the TEM images of R-CDs, which possess well dispersibility without apparent aggregation. More than 150 particles were statistically analyzed, and Fig. 1d shows that the particle distribution of R-CDs is centered at 7–12 nm. Besides, the amorphous structure without well-resolved lattice fringes was observed from the high-resolution TEM image (HRTEM, Fig. 1c inset).20 The height distribution ranging from 6 to 10 nm was observed by atomic force microscopy (AFM) characterization, which is similar to the above TEM measurements (Fig. S2, ESI†). Then, 1H-NMR spectroscopy was employed to make a distinction between the sp3-C (<6 ppm) and sp2-C (>6 ppm) structures in R-CDs (Fig. S3a, ESI†).31 And a more complicated structure of R-CDs was formed from the comparison of NMR spectra between R-CDs and OPD (Fig. S3, ESI†). Several different molecular m/z weights were observed in the mass spectrum of R-CDs, indicating that the as-prepared R-CDs have relatively multiple compositions (Fig. S4, ESI†). Although specific structural information of R-CDs could not be figured out at present, we speculate that R-CDs consist of molecular aggregates of OPD derivatives through supramolecular interactions.31 Therefore, the excitation-independent fluorescence behaviour of R-CDs is more related to molecular emission fragments in these aggregates.31 Meanwhile, the complex structure of R-CDs is also ascribed to the introduction of OPD and DTT as nitrogen and sulfur sources into the framework of CDs, which is an intricate formation process as shown in our previous study.21 Based on the above results, the long-wavelength PL and strong PL emission may be attributed to the co-doped nitrogen and sulfur elements and could bring more active sp2 nanodomains, which can reduce the band gap and restrain nonradiative transitions.32
C bond and the n → π* transitions of heteroatom-related chemical bonds (e.g., CO, CN, etc.) in aromatic sp2 structures, respectively.30 The as-prepared R-CDs in ethanol solution showed obvious red color luminescence under 570 nm excitation (inset, Fig. 1a). In a photoluminescence spectrum, the R-CDs exhibited excitation-independent fluorescence behaviors with the strongest emission band centered at 596 nm and a shoulder peak at 648 nm (Fig. 1b). The absolute quantum yield of 23.26% was examined under optimal 570 nm excitation (Fig. S1, ESI†). Then, transmission electron microscopy (TEM) was performed to characterize the morphology of the R-CDs. Fig. 1c shows the TEM images of R-CDs, which possess well dispersibility without apparent aggregation. More than 150 particles were statistically analyzed, and Fig. 1d shows that the particle distribution of R-CDs is centered at 7–12 nm. Besides, the amorphous structure without well-resolved lattice fringes was observed from the high-resolution TEM image (HRTEM, Fig. 1c inset).20 The height distribution ranging from 6 to 10 nm was observed by atomic force microscopy (AFM) characterization, which is similar to the above TEM measurements (Fig. S2, ESI†). Then, 1H-NMR spectroscopy was employed to make a distinction between the sp3-C (<6 ppm) and sp2-C (>6 ppm) structures in R-CDs (Fig. S3a, ESI†).31 And a more complicated structure of R-CDs was formed from the comparison of NMR spectra between R-CDs and OPD (Fig. S3, ESI†). Several different molecular m/z weights were observed in the mass spectrum of R-CDs, indicating that the as-prepared R-CDs have relatively multiple compositions (Fig. S4, ESI†). Although specific structural information of R-CDs could not be figured out at present, we speculate that R-CDs consist of molecular aggregates of OPD derivatives through supramolecular interactions.31 Therefore, the excitation-independent fluorescence behaviour of R-CDs is more related to molecular emission fragments in these aggregates.31 Meanwhile, the complex structure of R-CDs is also ascribed to the introduction of OPD and DTT as nitrogen and sulfur sources into the framework of CDs, which is an intricate formation process as shown in our previous study.21 Based on the above results, the long-wavelength PL and strong PL emission may be attributed to the co-doped nitrogen and sulfur elements and could bring more active sp2 nanodomains, which can reduce the band gap and restrain nonradiative transitions.32
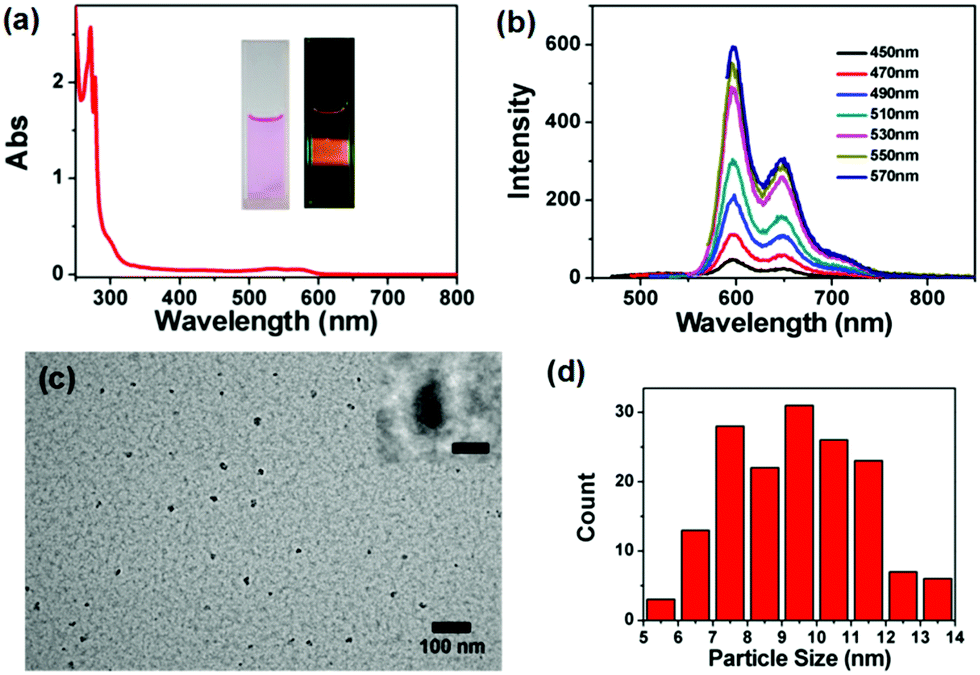 | ||
| Fig. 1 (a) UV-vis absorption spectrum of R-CDs in ethanol; insets are the photos of R-CDs under sunlight (left) and 570 nm excitation (right). (b) Photoluminescence spectra of R-CDs at different excitation wavelengths. (c) TEM and HRTEM images of R-CDs. Scale bar = 100 nm (inset: Scale bar = 10 nm). (d) Size distribution of R-CDs based on TEM statistical analysis. | ||
In order to identify the structural composition of R-CDs, Fourier transform infrared (FT-IR) spectrscopy and X-ray photoelectron spectroscopy (XPS) were performed. In Fig. 2a, the FT-IR spectra showed that R-CDs possess various nitrogen/oxygen/sulfur-related functional groups, such as O–H and N–H stretching vibrations corresponding to 3386, 3366, 3284 and 3188 cm−1; C–H vibration bands at 2851, 2903, 2922, and 2960 cm−1, CO, CN and CC at 1632, 1592 and 1501 cm−1, C–S, C–O and C–N at 885, 1018 and 1273 cm−1; SO symmetric stretching at 1040 cm−1, and the N–H deformation vibration at 747 cm−1.20,33 The XPS survey provided more evidence for elemental compositions and chemical bondings of R-CDs. The total XPS spectra clearly display five peaks at 163 eV, 227 eV, 284 eV, 399 eV and 532 eV, which correspond to S2p, S2s, C1s, N1s and O1s, respectively (Fig. 2b).34 In high-resolution XPS investigation, the C1s spectra can be deconvoluted into three binding energy peaks at 284.7, 285.7 and 287.9 eV, which can be classified into C–C, C–N/C–O/C–S and CO/CN, respectively (Fig. 2c).20,34 The N1s analysis reveals the presence of peaks at 399.3 eV and 400.1 eV for C–N and CN (Fig. 2d).32 In Fig. 2e, there are two bands at 532.3 and 531.7 eV for C–O and CO/SO in the O1s spectrum.20,34 The high-resolution S2p data indicate the existence of four energy bands at 163.4 eV, 164.6 eV, 167.7 eV and 168.7 eV, which are assigned to S2p3/2 C–S, S2p1/2 C–S, S2p3/2 SO, and S2p1/2 SO respectively (Fig. 2f).35,36 The above XPS analysis is in full agreement with the FT-IR studies. Due to the abundant functional groups on CDs, the as-prepared R-CDs can be easily dissolved in various solvents and display tunable photoluminescence behaviors from 575 nm to 636 nm depending on the change in solvent polarity, which is owing to the presence of hydrogen-bond or dipole–dipole interactions between R-CDs and solvent molecules (Fig. S5, ESI†).37 Therefore, multiple oxygen/nitrogen/sulfur-related active sites on the surface of R-CDs also make them as suitable candidates for combination with toxic metal ions through coordination interactions.1
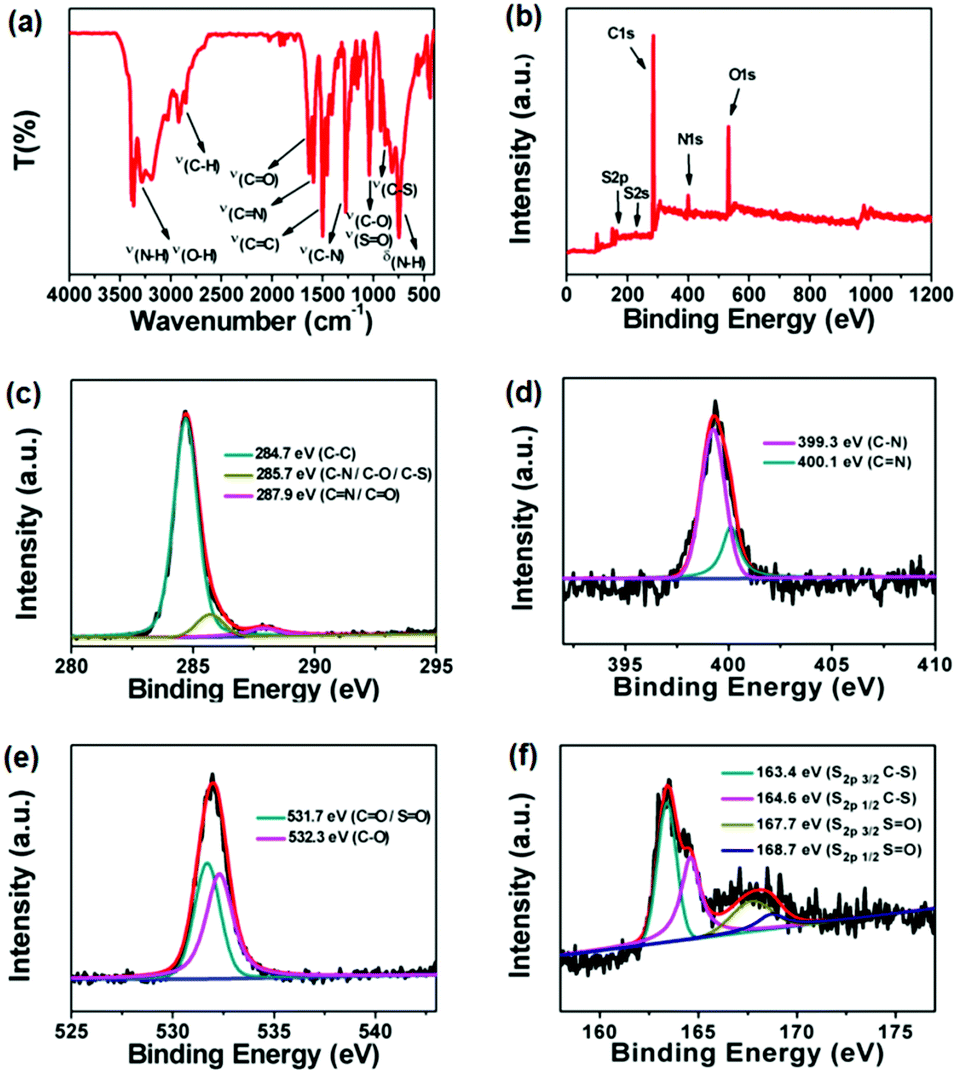 | ||
| Fig. 2 (a) FT-IR spectrum of R-CDs. (b) XPS pattern of R-CDs. High-resolution XPS C1s (c), N1s (d), O1s (e), and S2p (f) spectra of R-CDs, respectively. | ||
According to the above discussion, the N,S co-doped R-CDs with diversified active sites show remarkable photoluminescence properties, of which one potential application is regarded as a fluorescent sensor for transition metal ion detection in the fields of bioanalysis and environmental monitoring.25 In this paper, the possibility of R-CDs as the probe for metal ions has been established by testing the fluorescence response of R-CDs in the presence of various metal ions. As shown in Fig. 3a, the fluorescence change in R-CDs upon addition of different metal ions (K+, Na+, Ag+, Cu+, NH4+, Cu2+, Ca2+, Fe2+, Mg2+, Ni2+, Pb2+, Zn2+, Cd2+, Co2+, Mn2+, Sn2+, Al3+, Fe3+, Bi3+, Ce3+ and Cr3+) could be observed. This clearly shows that the fluorescence intensities of R-CDs towards most of the metal ions were nearly kept constant (<37% attenuation) except for Cu2+ (>90% decrease). Hence, the highly sensitive and selective detection of Cu2+ compared with other metal ions by R-CDs was presented. Fig. 3b shows the fluorescence quenching spectra of R-CDs upon addition of different concentrations of Cu2+. The photoluminescence intensity of R-CDs could be effectively weakened with increasing contents of Cu2+. Further, the Stern–Volmer exponential equation analysis can be utilized to fit the emission intensity ratio of R-CDs vs. Cu2+ concentrations (Fig. S6, ESI†).38 And I0/I = 0.2798![[thin space (1/6-em)]](https://www.rsc.org/images/entities/char_2009.gif) exp(0.2482[α]) + 0.4587 was calculated. The Stern–Volmer quenching constant (KSV) was analyzed to be 6.94 × 10⁴ M−1 and the detection limit obtained from this curve was 2 μM. Although the R-CDs do not exhibit a particularly excellent sensing performance compared to previously reported studies, they meet the criteria of the World Health Organization for the lowest concentration of Cu2+ in drinking water (32 μM).25 However, to our surprise, the fluorescence of R-CDs could be weakened by introducing higher contents (>20 μM) of Fe3+, Al3+, Bi3+, Cr3+, Ce3+, Sn2+ and Fe2+, but the quenching efficiency of these metal ions was much lower than that of Cu2+ (Fig. S7, ESI†). UV-vis absorption spectroscopy is a widely applied characterization method to monitor the structural variation in the materials.39,40 In Fig. 3c, the variation in the UV-vis absorption spectra of R-CDs can be clearly observed with increasing Cu2+ concentration. And the absorption spectra of R-CDs by adding low Cu2+ concentration (<20 μM) have two isosbestic points at 475 nm and 595 nm respectively, which indicates that the combination process is a simple one at the earlier stage. As multiple functional groups on R-CDs could coordinate with Cu2+, the complex chemical process would occur at high Cu2+ concentration (>20 μM). Therefore, the UV-vis spectra of R-CDs by adding high Cu2+ concentration do not have any isosbestic points at this stage. Upon adding an amount of Cu2+, the additional absorption peak at 662 nm gradually appeared. However, no obvious absorption change in R-CDs was observed upon addition of most of the other metal ions (Fig. 3d). Although some metal ions have quenching behaviors on R-CDs, the occurred new absorption peaks are all different from Cu2+, which are centered at 628 nm (Fig. S8, ESI†). This phenomenon illustrates that the R-CDs possibly have similar interaction modes with these ions except for Cu2+. Although we could not figure out the specific combination mechanism among these metal ions, the R-CDs exhibit highly selective and sensitive detection of Cu2+ towards other metal ions, which can be efficiently recognized through UV-vis absorption and fluorescence emission spectra.
exp(0.2482[α]) + 0.4587 was calculated. The Stern–Volmer quenching constant (KSV) was analyzed to be 6.94 × 10⁴ M−1 and the detection limit obtained from this curve was 2 μM. Although the R-CDs do not exhibit a particularly excellent sensing performance compared to previously reported studies, they meet the criteria of the World Health Organization for the lowest concentration of Cu2+ in drinking water (32 μM).25 However, to our surprise, the fluorescence of R-CDs could be weakened by introducing higher contents (>20 μM) of Fe3+, Al3+, Bi3+, Cr3+, Ce3+, Sn2+ and Fe2+, but the quenching efficiency of these metal ions was much lower than that of Cu2+ (Fig. S7, ESI†). UV-vis absorption spectroscopy is a widely applied characterization method to monitor the structural variation in the materials.39,40 In Fig. 3c, the variation in the UV-vis absorption spectra of R-CDs can be clearly observed with increasing Cu2+ concentration. And the absorption spectra of R-CDs by adding low Cu2+ concentration (<20 μM) have two isosbestic points at 475 nm and 595 nm respectively, which indicates that the combination process is a simple one at the earlier stage. As multiple functional groups on R-CDs could coordinate with Cu2+, the complex chemical process would occur at high Cu2+ concentration (>20 μM). Therefore, the UV-vis spectra of R-CDs by adding high Cu2+ concentration do not have any isosbestic points at this stage. Upon adding an amount of Cu2+, the additional absorption peak at 662 nm gradually appeared. However, no obvious absorption change in R-CDs was observed upon addition of most of the other metal ions (Fig. 3d). Although some metal ions have quenching behaviors on R-CDs, the occurred new absorption peaks are all different from Cu2+, which are centered at 628 nm (Fig. S8, ESI†). This phenomenon illustrates that the R-CDs possibly have similar interaction modes with these ions except for Cu2+. Although we could not figure out the specific combination mechanism among these metal ions, the R-CDs exhibit highly selective and sensitive detection of Cu2+ towards other metal ions, which can be efficiently recognized through UV-vis absorption and fluorescence emission spectra.
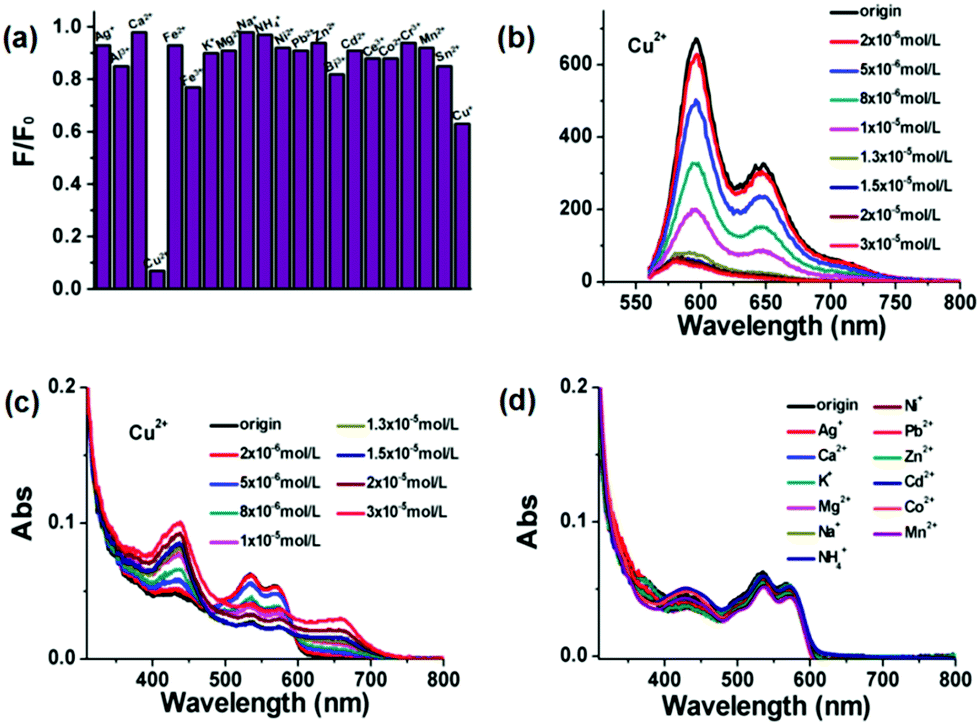 | ||
| Fig. 3 (a) Competitive ion study of R-CDs toward various metal ions (30 μM). (b) Photoluminescence quenching spectra of R-CDs at different concentrations of Cu2+. (c) UV-vis absorption spectra of R-CDs upon addition of different contents of Cu2+. (d) Comparison of the UV-vis absorption spectra of R-CDs in the presence of various metal ions. | ||
Previous studies have reported that the fluorescence of inorganic and organic materials could be quenched by some metal ions (such as Cu2+, Fe3+, etc.) based on coordination interactions.31,41 That is because these substrates have multiple active sites such as hydroxyl and carboxylic groups, which can efficiently coordinate with the corresponding metal ions. Compared with traditional metal ion sensors, R-CDs have abundant functional groups with different species, which have huge potential applications in detecting Cu2+ through strong coordination interactions. And the as-prepared R-CDs have a long excitation wavelength (∼550 nm), which avoids the interference from the adsorption of competitive metal ions. In order to further investigate the fluorescence quenching mechanism of Cu2+, a series of measurements have been carried out. Generally, the fluorescence quenching mechanism can be classified into static quenching and dynamic quenching processes. The color change in chemosensors is usually ascribed to a static quenching process arising from the formation of a non-fluorescent complex between fluorophores and quenchers in the ground state. However, the variation of fluorescence lifetime is also attributed to a dynamic quenching process owing to diffusive collisions in a depopulated process of the excited state.42,43 The fluorescence lifetime curves of R-CDs in the presence and absence of Cu2+ were studied (Fig. 4a). An exponential decay containing two lifetimes of 2.71 ns (81.26%) and 6.04 ns (18.74%) was measured in the photoluminescence lifetime of R-CDs. After the addition of Cu2+, the lifetime of R-CDs is altered to a single component with a lifetime of 4.31 ns (100%), which indicates the existence of the dynamic quenching process in the R-CD–Cu2+ system.42 However, an obvious color change in R-CDs by introducing Cu2+ can also be found, which demonstrates that the static quenching process could also dominate the coordination-assisted fluorescence quenching mechanism (Fig. S9, ESI†).43
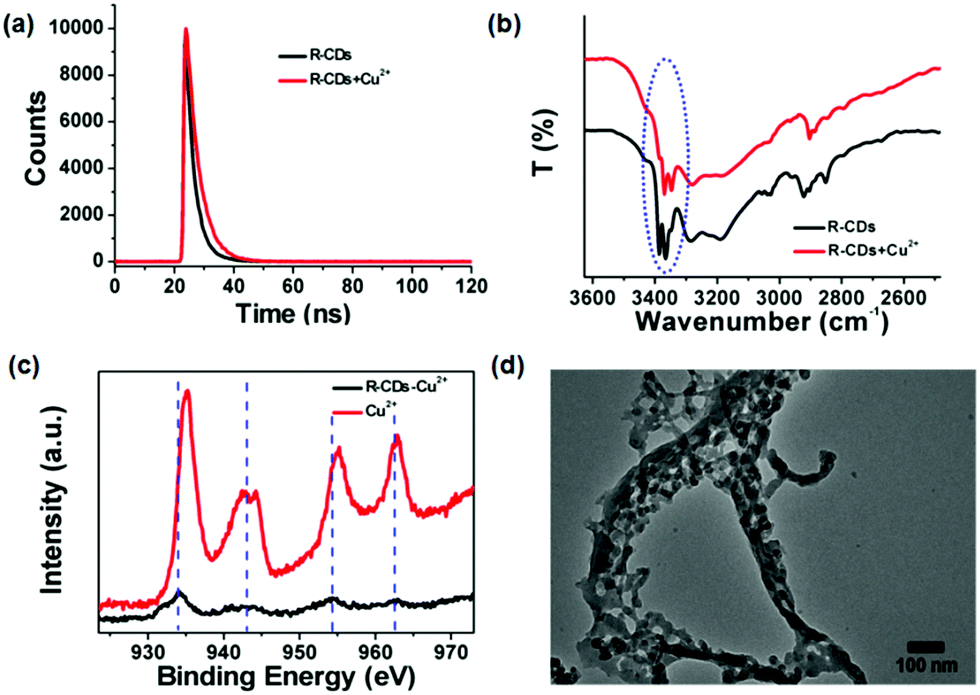 | ||
| Fig. 4 (a) Fluorescence lifetime decay curves of R-CDs and R-CDs–Cu2+ under 400 nm excitation. (b) FT-IR spectra of R-CDs and the R-CD–Cu2+ mixture. (c) High-resolution XPS Cu2p spectra of Cu2+ and the R-CD–Cu2+ mixture. (d) The morphology of the R-CD–Cu2+ complex with scale bar = 100 nm. | ||
Further, the coordination interaction between R-CDs and Cu2+ was investigated by FT-IR spectra and XPS analysis. In contrast to R-CDs, the vibration peaks of N–H/O–H (3365 cm−1 and 3387 cm−1) of R-CDs–Cu2+ were clearly blue-shifted in Fig. 4b, which illustrate the occurrence of the coordination process between R-CDs and Cu2+.44 In XPS analysis, the evident shift of Cu2p peaks to low energy of R-CDs–Cu2+ can be observed, which has been widely reported in many Cu2+ coordination compounds (Fig. 4c).45 Owing to the existence of coordination interactions between Cu2+ ions and different surface states of R-CDs, the obvious aggregation of neighboring particles is possible, which has been driven by surface energy and π–π stacking attractions (Fig. 4d).46
Ethylenediaminetetraacetic acid disodium (EDTA-Na) salts are a common chelating agent with large amounts of carboxylic groups for combining metal ions.32 Herein, recovery experiments of the absorption and fluorescence spectra of R-CDs–Cu2+ with the addition of EDTA-Na were investigated (Fig. S10, ESI†). When Cu2+ was added into a solution of R-CDs, the characteristic coordination absorption peak of R-CDs–Cu2+ at 662 nm appeared and the fluorescence intensity of R-CDs quickly decreased to 20%. Subsequently, this led to the disappearance of the new absorption peak and the fluorescence of R-CDs was recovered to 65% after excess EDTA-Na was introduced into the R-CD–Cu2+ solution. The above experiments illustrate that Cu2+ has much stronger coordination ability towards EDTA-Na than R-CDs, which leads to the release of Cu2+ from the surface states of R-CDs. The recovery of incomplete fluorescence may be due to the energy loss and non-radiative transition in the competitive coordination process. Due to the existence of the coordination interaction, the absorbance of the characteristic absorption peak at 662 nm could gradually increase by adding different contents of Cu2+ (Fig. 3c). This is attributed to the ligand-to-metal charge transfer between the π electrons in the π-conjugation network of R-CDs and unoccupied d orbitals of Cu2+.7 And the large spectral overlaps between the absorption spectra of the R-CD–Cu2+ complex and the emission spectra of R-CDs can be observed (Fig. S11, ESI†). The effective energy transfer process would happen between the energy donor R-CDs and the energy acceptor R-CDs–Cu2+, resulting in the fluorescence quenching of R-CDs. For the purpose of ruling out the possible impacts of R-CDs–Cu+ generated during the redox reaction between R-CDs and Cu2+, the effects of Cu+ on R-CDs were characterized. Although R-CDs–Cu+ exhibited a similar coordination mode with R-CDs–Cu2+, the interaction ability of Cu+ was weaker than Cu2+, which can be concluded from the unconspicuous coordination absorption peak at 662 nm and the insufficient fluorescence quenching efficiency of R-CDs–Cu+ (Fig. S12, ESI† and Fig. 3a). Based on the above discussion, the highly sensitive and selective recognition of R-CDs on Cu2+ is suggested to originate from the unique coordination interaction between Cu2+ and R-CDs (Fig. 5).46
 | ||
| Fig. 5 Schematic illustration of the selective detection mechanism of R-CDs towards Cu2+. | ||
As a chemosensor, the R-CDs have good photostability with <20% decrease under 12 W UV irradiation for 6 h (Fig. S13a, ESI†) and pH resistance without complete fluorescence quenching in pH < 11 (Fig. S13b, ESI†). Meanwhile, the R-CDs also exhibit good repeatability upon detection of Cu2+ with the effective fluorescence quenching degree >90% (Fig. S14, ESI†). Then, the reliability of R-CDs for Cu2+ sensing in real sample analysis has been illustrated (Fig. S15, ESI†). Compared with the blank and control groups (R-CDs by adding seawater, lake water or tap water), all of the experimental groups (R-CDs by adding 20 μM Cu2+ in different types of natural water) exhibit fluorescence quenching effectively, indicating the applicability of R-CDs in environmental monitoring. The above experiments show that the highly selective detection of Cu2+ can be easily operated in a solution phase. To further demonstrate the potential application practicability, a detection paper for visual recognition of Cu2+ was fabricated through immobilizing the R-CDs on a fiber paper. After dropping 30 μM Cu2+ solution onto the detection paper, the fluorescence of R-CDs is efficiently quenched with a quenching efficiency of ∼91% and the visible color of the paper turned into yellow (Fig. 6 and Fig. S16, ESI†). Hence, this detection process can be successfully achieved in visible and fluorescence dual modes. And the CD-based indicator paper also exhibits the selective sensing performance on Cu2+ compared with other metal ions (Fig. S17, ESI†). In consequence, the R-CDs may provide well guarantee for the monitoring of trace elements.
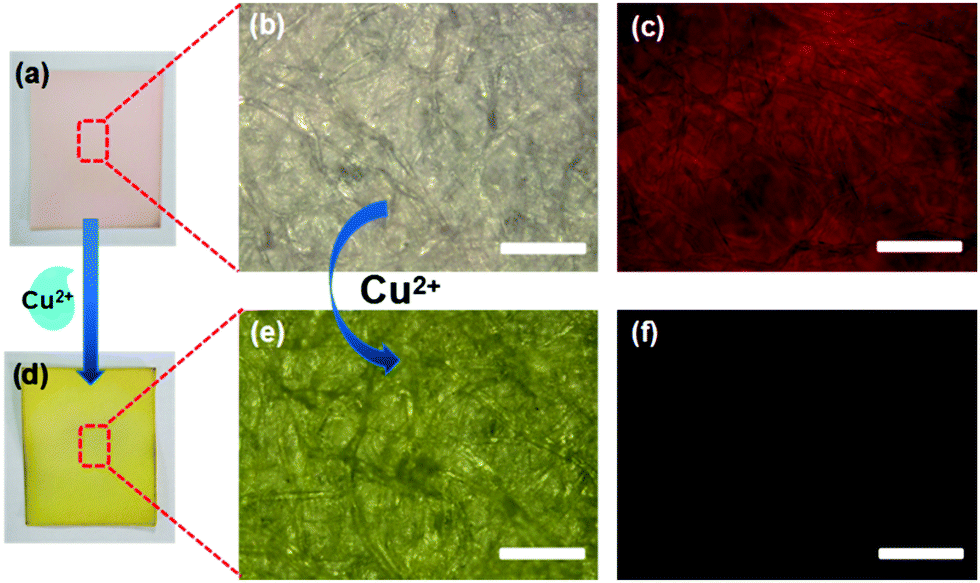 | ||
| Fig. 6 (a and d) Photographs of the detection paper immobilized with R-CDs and R-CDs–Cu2+. (b and e) Microscopic images and (c and f) fluorescence mode images of CD-based detection paper (0.5 mg mL−1) with the addition of Cu2+ (30 μM) or not, scale bar = 100 μm. | ||
Methods and experimental section
Synthesis of R-CDs
R-CDs were synthesized using a solvothermal route as a previous study.20 0.4 g OPD and 0.05 g DTT were dispersed in 20 mL CHCl3. And 1 mL 1 mol L−1 NaOH was added to the solution to adjust the reaction system to a pH of 13–14 under vigorous stirring conditions. Then, the solution was heated at 160 °C for 12 h in a poly(tetrafluoroethylene) Teflon-lined autoclave. Subsequently, crude products were obtained and concentrated using a rotary evaporator. In order to remove unreacted raw materials, the products were separated by column chromatography. At last, the purified R-CD sample was obtained and dried under vacuum conditions for further experiments.Recognition of metal ions by R-CDs in a solution phase
Different contents of Cu2+ (0–30 μM) were mixed with 2 mL R-CDs in ethanol (0.1 mg mL−1). And the photoluminescence spectra of the Cu2+-CD solution were recorded under 550 nm excitation. The selectivity detecting process was carried out by adding other metal ions (including K+, Na+, Ag+, NH4+, Ca2+, Fe2+, Mg2+, Ni2+, Pb2+, Zn2+, Cd2+, Co2+, Mn2+, Sn2+, Al3+, Fe3+, Bi3+, Ce3+ and Cr3+) instead of Cu2+ in the same way. All detection experiments were performed at room temperature.Selective detection of Cu2+ using R-CDs on the test paper
R-CD-based indicator paper was successfully constructed by fixed manipulation (blank filter paper was immersed in a 0.5 mg mL−1 R-CD solution for 12 h and further dried). Then, their detection ways towards different kinds of metal ions are also of uniform operation (1 mL 30 μM metal ion solution was dropped on the detection paper and dried). And the fluorescence quenching process was performed under green light (∼515–560 nm) excitation using a Leica DM4000M fluorescence microscope.Conclusions
In summary, a facile and efficient solvothermal strategy to synthesize strong red emission N,S co-doped CDs with a high QY (∼23%) was developed. By doping with heteroatom nitrogen and sulfur, diversified active functional groups were introduced onto R-CDs, which endow R-CDs with highly selective and sensitive recognition function on Cu2+ in UV-vis absorption and fluorescence emission spectra monitoring. By a series of experimental characterization, this selective sensing Cu2+ by R-CDs was due to the formation of the R-CD–Cu2+ complex through unique coordination interactions. And this fluorescence quenching mechanism involves dynamic and static quenching processes. Finally, the visible and fluorescence dual-mode selective sensing Cu2+ pathway in the solid phase was efficiently constructed by a R-CD-related detection paper. We expect this work to give inspiration on further avenues for trace element recognition technologies.Conflicts of interest
There are no conflicts of interest to declare.Acknowledgements
The authors are thankful for the support of the NSFC (Grant No. 21574058 for M. Li).Notes and references
- (a) X. H. Gao, C. Du, Z. H. Zhuang and W. Chen, J. Mater. Chem. C, 2016, 4, 6927 RSC; (b) Y. C. Yang, W. X. Fang, M. Q. Xue, Z. M. Xu and C. Huang, J. Mater. Cycles Waste Manage., 2016, 18, 296 CrossRef CAS.
- (a) C. Z. Huang and B. Hu, Spectrochim. Acta, Part B, 2008, 63, 437 CrossRef; (b) M. Ghaedi, F. Ahmadi and A. Shokrollahi, J. Hazard. Mater., 2007, 142, 272 CrossRef CAS PubMed.
- (a) L. Y. Yu, L. Y. Zhang, G. J. Ren, S. Li, B. Y. Zhu, F. Chai, F. Y. Qu, C. G. Wang and Z. M. Su, Sens. Actuators, B, 2018, 262, 678 CrossRef CAS; (b) G. J. Ren, Y. X. Meng, Q. Zhang, M. Y. Tang, B. Y. Zhu, F. Chai, C. G. Wang and Z. M. Su, New J. Chem., 2018, 42, 6824 RSC.
- (a) X. Zhang, H.-A. Choi, S. Y. Lee, J. Yin, S. H. Kim, X. M. Lee and J. Y. Yoon, Dyes Pigm., 2015, 122, 109 CrossRef CAS; (b) Y. X. Li, H. P. Zhou, S. H. Yin, H. Jiang, N. Niu, H. Huang, S. A. Shahzad and C. Yu, Sens. Actuators, B, 2016, 235, 33 CrossRef CAS.
- K. Zhang, J. K. Guo, J. J. Nie, B. Y. Du and D. J. Xu, Sens. Actuators, B, 2014, 190, 279 CrossRef CAS.
- W. Bian, F. Wang, H. Zhang, L. Zhang, L. Wang and S. M. Shuang, Luminescence, 2015, 30, 1064 CrossRef CAS PubMed.
- (a) H. Weng and B. Yan, Anal. Chim. Acta, 2017, 988, 89 CrossRef CAS PubMed; (b) C. Liu and B. Yan, Sens. Actuators, B, 2016, 235, 541 CrossRef CAS; (c) J.-X. Wu and B. Yan, Dalton Trans., 2017, 46, 15080 RSC.
- (a) T.-T. Zheng, J. Zhao, Z.-W. Fang, M.-T. Li, C.-Y. Sun, X. Li, X.-L. Wang and Z.-M. Su, Dalton Trans., 2017, 46, 2456 RSC; (b) Y. Q. Xiao, Y. J. Cui, Q. Zheng, S. C. Xiang, G. D. Qian and B. L. Chen, Chem. Commun., 2010, 46, 5503 RSC.
- D. Li, P. T. Jing, L. H. Sun, Y. An, X. Y. Shan, X. H. Lu, D. Zhou, D. Han, D. Z. Shen, Y. C. Zhai, S. N. Qu, R. Zboril and A. L. Rogach, Adv. Mater., 2018, 1705913 CrossRef PubMed.
- J. J. Liu, D. W. Li, K. Zhang, M. X. Yang, H. C. Sun and B. Yang, Small, 2018, 1703919 CrossRef PubMed.
- Q. Y. Jia, J. C. Ge, W. M. Liu, X. L. Zheng, S. Q. Chen, Y. M. Wen, H. Y. Zhang and P. F. Wang, Adv. Mater., 2018, 1706090 CrossRef PubMed.
- Y. Wang, X. Q. Liu, J. Liu, B. Han, X. Q. Hu, F. Yang, Z. W. Xu, S. R. Jia, Z. Li and Y. L. Zhao, Angew. Chem., Int. Ed., 2018, 57, 1 CrossRef.
- M. Han, S. J. Zhu, S. Y. Lu, Y. B. Song, T. L. Feng, S. Y. Tao, J. J. Liu and B. Yang, Nano Today, 2018, 19, 201 CrossRef CAS.
- G. A. M. Hutton, B. Reuillard, B. C. M. Martindale, C. A. Caputo, C. W. J. Lockwood, J. N. Butt and E. Reisner, J. Am. Chem. Soc., 2016, 138, 16722 CrossRef CAS PubMed.
- (a) J. K. Ren, X. M. Sun, Y. F. Wang, R. Song, Z. Xie, S. Y. Zhou and P. Chen, Adv. Opt. Mater., 2018, 1701273 CrossRef; (b) Y. L. Qin, N. Y. Liu, H. Li, Y. Sun, L. L. Hu, S. Q. Zhao, D. X. Han, Y. Liu, Z. H. Kang and L. Niu, J. Phys. Chem. C, 2017, 121, 27546 CrossRef CAS.
- K.-K. Liu, X.-M. Li, S.-B. Cheng, R. Zhou, Y.-C. Liang, L. Dong, C.-X. Shan, H.-B. Zeng and D.-Z. Shen, Nanoscale, 2018, 10, 7155 RSC.
- B. Yuan, S. Y. Guan, X. M. Sun, X. M. Li, H. B. Zeng, Z. Xie, P. Chen and S. Y. Zhou, ACS Appl. Mater. Interfaces, 2018, 10, 16005 CrossRef CAS PubMed.
- K. Jiang, Y. H. Wang, X. L. Gao, C. Z. Cai and H. W. Lin, Angew. Chem., Int. Ed., 2018, 57, 1 CrossRef.
- H. Ding, Y. Ji, J.-S. Wei, Q.-Y. Gao, Z.-Y. Zhou and H.-M. Xiong, J. Mater. Chem. B, 2017, 5, 5272 RSC.
- B. Ju, Y. Wang, Y.-M. Zhang, T. Zhang, Z. H. Liu, M. J. Li and S. X.-A. Zhang, ACS Appl. Mater. Interfaces, 2018, 10, 13040 CrossRef CAS PubMed.
- H. Nie, M. J. Li, Q. S. Li, S. J. Liang, Y. Y. Tan, L. Sheng, W. Shi and S. X.-A. Zhang, Chem. Mater., 2014, 26, 3104 CrossRef CAS.
- B. Ju, H. Nie, Z. H. Liu, H. J. Xu, M. J. Li, C. F. Wu, H. D. Wang and S. X.-A. Zhang, Nanoscale, 2017, 9, 13326 RSC.
- C. Hu, C. Yu, M. Y. Li, X. N. Wang, J. Y. Uang, Z. B. Zhao, A. Eychmuller, Y.-P. Sun and J. S. Qiu, Small, 2014, 10, 4926 CrossRef CAS PubMed.
- Y. Q. Dong, R. X. Wang, G. L. Li, C. Q. Chen, Y. W. Chi and G. N. Chen, Anal. Chem., 2012, 84, 6220 CrossRef CAS PubMed.
- (a) Y. Q. Dong, R. X. Wang, H. Li, J. W. Shao, Y. W. Chi, X. M. Lin and G. N. Chen, Carbon, 2012, 50, 2810 CrossRef CAS; (b) X. M. Lin, G. M. Gao, L. Y. Zheng, Y. W. Chi and G. N. Chen, Anal. Chem., 2014, 86, 1223 CrossRef CAS PubMed.
- (a) J. L. Ci, Y. Tian, S. Kuga, Z. W. Niu, M. Wu and Y. Huang, Chem. – Asian J., 2017, 12, 2916 CrossRef CAS PubMed; (b) A. W. Zhu, Q. Qu, X. L. Shao, B. Kong and Y. Tian, Angew. Chem., Int. Ed., 2012, 124, 7297 CrossRef.
- A. Kumari, A. Kumar, S. K. Sahu and S. Kumar, Sens. Actuators, B, 2018, 254, 197 CrossRef CAS.
- Y. B. Wang, Q. Chang and S. L. Hu, Sens. Actuators, B, 2017, 253, 928 CrossRef CAS.
- H. Ding, J.-S. Wei, P. Zhang, Z.-Y. Zhou, Q.-Y. Gao and H.-M. Xiong, Small, 2018, 1800612 CrossRef PubMed.
- S. Y. Lu, L. Z. Sui, J. J. Liu, S. J. Zhu, A. M. Chen, M. X. Jin and B. Yang, Adv. Mater., 2017, 1603443 CrossRef PubMed.
- (a) S. J. Zhu, Q. N. Meng, L. Wang, J. H. Zhang, Y. B. Song, H. Jin, K. Zhang, H. C. Sun, H. Y. Wang and B. Yang, Angew. Chem., Int. Ed., 2013, 52, 3953 CrossRef CAS PubMed; (b) S. J. Zhu, Y. B. Song, J. R. Shao, X. H. Zhao and B. Yang, Angew. Chem., Int. Ed., 2015, 54, 14626 CrossRef CAS PubMed.
- X. Miao, X. L. Yan, D. Qu, D. B. Li, F. F. Tao and Z. C. Sun, ACS Appl. Mater. Interfaces, 2017, 9, 18549 CrossRef CAS PubMed.
- L. Peng, A. Philippaerts, X. X. Ke, J. V. Noyen, F. D. Clippel, G. V. Tendeloo, P. A. Jacobs and B. F. Sels, Catal. Today, 2010, 150, 140 CrossRef CAS.
- M.-Q. Zhao, M. Sedran, Z. Ling, M. R. Lukatskaya, O. Mashtalir, M. Ghidiu, B. Dyatkin, D. J. Tallman, T. Djenizian, M. W. Barsoum and Y. Gugotsi, Angew. Chem., Int. Ed., 2015, 54, 4810 CrossRef CAS PubMed.
- J. Liang, Y. Jiao, M. Jaroniec and S. Z. Qiao, Angew. Chem., Int. Ed., 2012, 51, 11496 CrossRef CAS PubMed.
- Z. M. Wei, T. Li, K. Jennum, M. Santella, N. Bovet, W. P. Hu, M. B. Nielsen, T. Bjornholm, G. C. Solomon, B. W. Laursen and K. Norgaard, Langmuir, 2012, 28, 4016 CrossRef CAS PubMed.
- A. Sciortino, E. Marino, B. V. Dam, P. Schall, M. Cannas and F. Messina, J. Phys. Chem. Lett., 2016, 7, 3419 CrossRef CAS PubMed.
- X. C. Sun, J. K. He, Y. T. Meng, L. C. Zhang, S. C. Zhang, X. Y. Ma, S. Dey, J. Zhao and Y. Lei, J. Mater. Chem. A, 2016, 4, 4161 RSC.
- S. Y. Zhu, M. J. Li, L. Sheng, P. Chen, Y. M. Zhang and S. X.-A. Zhang, Analyst, 2012, 137, 5581 RSC.
- H. Nie, M. J. Li, Y. J. Hao, X. D. Wang and S. X.-A. Zhang, Chem. Sci., 2013, 4, 1852 RSC.
- S. Goswami, D. Sen and N. K. Das, Org. Lett., 2010, 12, 856 CrossRef CAS PubMed.
- P. Das and S. K. Mandal, J. Mater. Chem. C, 2018, 6, 3288 RSC.
- Y. H. Liu, W. X. Duan, W. Song, J. J. Liu, C. L. Ren, J. Wu, D. Liu and H. L. Chen, ACS Appl. Mater. Interfaces, 2017, 9, 12663 CrossRef CAS PubMed.
- D. P. Drolet, D. M. Manuta and A. J. Lees, Inorg. Chim. Acta, 1988, 146, 173 CrossRef CAS.
- C. Furlani and G. Polzonetti, Inorg. Chim. Acta, 1983, 73, 105 CrossRef CAS.
- Q. Wu, X. J. Wang, S. A. Rasaki, T. Thomas, C. X. Wang, C. Zhang and M. H. Yang, J. Mater. Chem. C, 2018, 6, 4508 RSC.
Footnotes |
| † Electronic supplementary information (ESI) available. See DOI: 10.1039/c8nj04906h |
| ‡ Bo Ju and Ting Zhang contributed equally to this work. |
| This journal is © The Royal Society of Chemistry and the Centre National de la Recherche Scientifique 2019 |