
Functionalized nanoparticles as adjuvant to increase the cytotoxicity of metallodrugs toward tumor cells†
Eduardo
Guimarães Vieira
 *a,
Rodrigo Bernardi
Miguel
a,
Daniel
Rodrigues da Silva
a,
Rodrigo
Boni Fazzi
a,
Ricardo Alexandre Alves
de Couto
a,
Jayr Henrique
Marin
a,
Marcia Laudelina Arruda
Temperini
a,
Jorge
da Silva Shinohara
a,
Henrique Eisi
Toma
a,
Lilian Cristina
Russo
b,
Yuli Thamires
Magalhães
b,
Newton Luiz
Dias Filho
c,
Fábio Luiz
Forti
b and
Ana Maria
da Costa Ferreira
*a
*a,
Rodrigo Bernardi
Miguel
a,
Daniel
Rodrigues da Silva
a,
Rodrigo
Boni Fazzi
a,
Ricardo Alexandre Alves
de Couto
a,
Jayr Henrique
Marin
a,
Marcia Laudelina Arruda
Temperini
a,
Jorge
da Silva Shinohara
a,
Henrique Eisi
Toma
a,
Lilian Cristina
Russo
b,
Yuli Thamires
Magalhães
b,
Newton Luiz
Dias Filho
c,
Fábio Luiz
Forti
b and
Ana Maria
da Costa Ferreira
*a
aDepartment of Fundamental Chemistry, Institute of Chemistry, University of São Paulo, 05508-000 São Paulo-SP, Brazil. E-mail: amdcferr@iq.usp.br; eduardogv5007@gmail.com
bDepartment of Biochemistry, Institute of Chemistry, University of São Paulo, 05508-000 São Paulo-SP, Brazil
cDepartment of Physics and Chemistry, University of São Paulo State (UNESP), 15385-000 Ilha Solteira-SP, Brazil
First published on 19th November 2018
Abstract
Functionalized MCM-41 is a class of new nanoporous biomaterials extensively studied as drug carriers of a diversity of therapeutic agents due to its suitable properties. In the present study, two oxindolimine complexes based on copper(II) and zinc(II) were immobilized in two selective delivery systems, namely, unmodified and modified MCM-41, which can act as carriers of water-insoluble anticancer metallodrugs. Morphological and structural characterizations of these materials were accomplished, and their cytotoxic effect was evaluated on three different cancer cell lines, SKMEL-147, SKMEL-05 and HeLa, in comparison to a non-tumor cell line (fibroblast P4). Cytotoxicity assays showed that both complexes coordinated to the modified matrix were more active and selective than those immobilized into the unmodified matrix, particularly toward SKMEL-147 cells. In contrast, P4 cells were much less affected by the presence of these compounds, with very high IC50 values. Further, the release of the complexes from these materials was monitored in vitro by X-ray fluorescence, which indicated a significant delivery after 2 h at 37 °C. By using CytoViva™ images, it was possible to observe the presence of such nanoparticles inside the cells, as well as the formation of apoptotic bodies due to the action of these antitumor compounds. A high damage on the nucleus was verified by comet and DNA cleavage assays, pointing to DNA as an important target of such metallodrugs. The matrices also contribute to the potential therapeutic action of these metal complexes, significantly increasing their cytotoxicity against melanoma and cervical carcinoma cells.
Introduction
Hybrid compounds showing interesting biological activity have been obtained by the insertion or binding of organic ligands and their corresponding metal complexes to inorganic matrices, focusing mainly on anticancer treatments.1 These materials have deserved the increasing attention in the literature in recent years due to their suitable characteristics, which include ease of preparation, biocompatibility, and ability to circulate in the bloodstream and enter the cells, exhibiting modified delivery patterns.2,3 In this field, different nanostructures have been developed aiming at application in diagnostics and therapeutics,4,5 and design strategies comprise exploitation of the tumor microenvironment6 as well as stimuli-responsive systems.7,8 These materials can efficiently transport and deliver active compounds9 for imaging or healing purposes, targeting specific organs, tissues or even cells. Since the surface characteristics of nanoparticles remarkably affect their interactions with biological tissues, cellular uptake and distribution, modifications using adequate targeting ligands, such as peptides, aptamers, folic acid or antibodies have been already reported.10 Particularly, mesoporous silica nanoparticles with modified surfaces display some advantages for efficient drug delivery, generating enormous interest in the literature.11 Some of their attractive characteristics for biomedical applications are high drug-loading capacity, protection of inserted or supported species, increased stability, and controlled access to selected targets.12 Further, these nanoparticles offer low toxicity, robustness, tuneable size, shape and porosity, as well as ease of preparation and functionalization.13 The strategies used include functionalization,14 polymer coating,15 and covalent grafting of metal complexes.16 Also, the use of gatekeepers that are pH-sensitive or activated by specific external or internal stimuli offers the possibility of these nanosystems to be recognized and internalized only by tumor cells.17 As an example, a novel type of multifunctional envelope-type mesoporous silica nanoparticle has been designed for glutathione-induced intracellular drug delivery.18 This was achieved by anchoring β-cyclodextrin on the surface of the silica nanoparticles via disulfide linking, then introducing additionally a peptide sequence motif and a matrix metalloproteinase substrate peptide via host–guest interactions.Herein, a copper(II) complex, [Cu(isapn)]+1, with an oxindolimine ligand (3E,3′E)-3,3′-(propane-1,3-diylbis(azaneylylidene))bis(indolin-2-one), and its analogous zinc(II) complex, [Zn(isapn)]+2, were immobilized in two selective delivery systems comprising unmodified and modified silica nanostructures, with the aim of improving their cytotoxicity and delivery conditions. These metal complexes have already shown activity against tumor cells,19,20 targeting DNA, mitochondria and some selective proteins,21,22 and constitute promising candidates as antitumor agents.
Experimental
Materials
The chemicals used in this research, including 3-amino-1,2,4-triazole-5-carboxylic acid (atzac), isatin (isa), 1,3-diaminopropane (pn), zinc(II) perchlorate hexahydrate, and copper(II) perchlorate hexahydrate, were purchased from Sigma-Aldrich. Commercial grade solvents and reagents were used as received, without further purification. The metal complexes, [Cu(isapn)]+1 and the analogous [Zn(isapn)]+2 (Fig. 1) were previously prepared according to procedures described in the literature.23,24 | ||
| Fig. 1 Scheme of preparation of unmodified and modified carrier (MCM-41) and structures of the metal complexes studied, [Cu(isapn)]+1 and [Zn(isapn)]+2. | ||
Synthesis of new carrier [(3-amino-1,2,4-triazole-5-carboxylic acid)propyl]-MCM (MCM-atzac)
The mesoporous matrix MCM-41 was synthesized by the basic hydrolysis of tetraethylorthosilicate (TEOS), which was calcined and then reacted with (3-chloropropyl)trimethoxysilane (CPTMS), as described in the literature (Fig. 1).25,26 Next, to a solution of 3-amino-1,2,4-triazole-5-carboxylic acid (2.0 g, 15.70 mmol) in 150 mL hot water, 5 g of [(3-chloropropyl)]-MCM (MCM-Cl) was added. The suspension was stirred over a period of 24 h under reflux. Subsequently, the formed material was separated by filtration and washed successively with water and ethanol, resulting in the [(3-amino-1,2,4-triazole-5-carboxylic acid)propyl]-MCM (MCM-atzac) in a yield of 4.5 g. Elemental analysis for MCM-atzac, found: C, 6.20%; H, 3.28%; N, 2.18%. 13C solid-state NMR (100.61 MHz, ppm): (1) 10.70 (CH2–Si), (2) 27.32 (CH2–CH2Si), (3) 49.65 (CH2–N), (4 and 5) 141.6/150.75 (aromatic ring) and (6) 157.06 (carboxylic acid group). 29Si solid-state NMR (79.48 MHz, ppm): (1) −111.61 (Q3 = Si(O–Si)3OH), (2) −103.16 (Q4 = Si(OSi)4) (T3 = RSi(OSi)3), (3) −67.68 (T3 = RSi(OSi)3), (4) −60.16 (T2 = RSi(OSi)(OH)2).Immobilization of metal complexes into unmodified and modified matrix
The immobilization of the studied complexes on the MCM-41 matrices was carried out as follows. First, solutions of the oxindolimine-copper(II) complex, [Cu(isapn)]+1, and of the analogous zinc(II) complex, [Zn(isapn)]+2 (Fig. 1), were prepared (3 mmol L−1) in 30 mL of a mixture of dimethylformamide and water (5![[thin space (1/6-em)]](https://www.rsc.org/images/entities/char_2009.gif) :95 v/v) at pH ∼ 6.4. The unmodified or modified MCM-41 was added to each complex solution, and the mixture was kept under constant stirring for 24 h at room temperature. Then, each material was filtrated under reduced pressure and washed several times with a mixture of DMSO (dimethyl sulfoxide)/H2O (5:95 v/v). The samples were dried at 70 °C overnight and ground before storage in glass flasks.
:95 v/v) at pH ∼ 6.4. The unmodified or modified MCM-41 was added to each complex solution, and the mixture was kept under constant stirring for 24 h at room temperature. Then, each material was filtrated under reduced pressure and washed several times with a mixture of DMSO (dimethyl sulfoxide)/H2O (5:95 v/v). The samples were dried at 70 °C overnight and ground before storage in glass flasks.
Instrumentation
Elemental analysis (CHN, PerkinElmer-2400), FT infrared spectroscopy (PerkinElmer – Frontier), and metal analyses (ICP-OES, Spectro Arcos) were carried out at the Central Analítica of our institution (http://ca.iq.usp.br/novo/). The Raman spectra were recorded using a Bruker RFS 100 FT-Raman spectrometer equipped with a Ge detector, using liquid nitrogen as the coolant, with excitation from a Nd:YAG laser (λ0 = 1.064 nm). For the complexes’ spectra, 500 scans were performed at a resolution of 2 cm−1 with a 25 mW laser focused on the samples. For the MCM-41 and its derivates, 3000 scans were carried out at a resolution of 2 cm−1, with a power of 200 mW. All spectra were pre-processed in a MATLAB R2015a environment using a Whittaker filter (λ = 10000, ρ = 0.001) for baseline correction, smoothed with a Savitsky–Golay filter (5 points and a zeroth order polynomial function) and normalized by scaling between 0 and 1. To avoid showing the water emission spectrum, the region between 2000 and 2800 cm−1 was excluded. All pure spectra are available in Fig. S1 (ESI†). X-ray diffraction (XRD) patterns were obtained with a Rigaku Miniflex instrument operating at 30 kV and 15 mA using a nickel filter and Cu radiation (Kα), with a wavelength of 1.5418 Å. Thermogravimetric analysis (TGA) curves were registered with a Netsch STA 409 PC thermobalance. The temperature range used was 25 to 800 °C, at a heating rate of 10 °C min−1, using air atmosphere to purge the system (flow rate of 50 mL min−1). Surface area was determined by Brunauer–Emmett–Teller (BET) method, through N2 adsorption at 77 K, using an ASAP 2020-Micromeritics instrument. The samples were previously dried at 70 °C. 13C and 29Si solid-state NMR analyses were performed with a Bruker Avance 500 spectrometer at the Institute of Chemistry of UNESP/Araraquara-SP. Scanning electron microscopy (SEM) images were obtained using an EVO LS15 (Carl Zeiss), with specimens coated with gold. All the EPR data were recorded in a CW-Bruker instrument operating at X-band (9.5 GHz, 20 mW power, 100 kHz frequency). The frequency was calibrated with DPPH (g = 2.0036). The low-temperature measurements were carried out in a Quartz Dewar with liquid nitrogen (77 K). In the delivery assays, the copper and zinc amounts released from the MCM carriers were monitored by X-ray fluorescence spectra, using a Bruker Picofox spectrometer with Mo tube (50 kV, 600 μA) and SDD detector cooled by a Peltier bath.
Cells and cell culture
The human melanoma cells SKMEL-147 (wild type, Cellosaurus, CVCL 3876) and SKMEL-05 (ATCC®, HTB-70™, B-Raf mutated gene expression) were kindly provided by Professor Dr Roger Chammas from the Cancer Institute of São Paulo State (ICESP). The non-tumorigenic P4 cells (human foreskin fibroblasts) were isolated from tissues in Dr Silvya Stuchi Maria-Engler's laboratory, at the Faculty of Pharmaceutical Sciences-USP, where the cultivation procedure was established. HeLa cervical cancer cells (ATCC® CCL-2) were kindly provided by Professor Dr Pio Colepicolo Neto from the Institute of Chemistry – University of São Paulo. Cells were cultivated in Dulbecco's modified Eagle's medium (DMEM, Vitrocell) supplemented with 10% fetal bovine serum (FBS, Vitrocell), maintained at 5% CO2 atmosphere and 37 °C.Cell viability analysis
Cell viability was assessed using the tetrazolium dye reduction assay (MTT) in order to verify the cytotoxicity of the [Cu(isapn)]+1 and [Zn(isapn)]+2 complexes, free in solution or immobilized into the unmodified and modified matrix. For these assays, 1 × 10⁴ cells of each cell line were seeded in a 96-well plate and grown for 24 h. The medium was removed, and the dishes washed three times with PBS buffer (pH 7.4). The suspensions of free or immobilized complexes were prepared in culture medium and immediately added to the cells, which were treated for 24 h. Subsequently, the medium was replaced by 200 μL of medium containing 0.2 mg mL−1 3-(4,5-dimethylthiazol-2-yl)-2,5-diphenyltetrazolium bromide reagent (MTT, Sigma-Aldrich) and incubated for 3 h. After the incubation, it was possible to observe the formation of formazan crystals under a microscope. The formazan crystals were solubilized by addition of 100 μL DMSO. The absorbance was measured at 570 nm on a microplate reader (Tecan Infinite M200, Switzerland). Cytotoxicity was expressed as IC50, which was determined from the concentration-response curve.CytoViva hyperspectral images
The CytoViva™ hypermicroscope system allows the observation of metallodrug delivery and localization. The device consists of a coverslip mounted on top of a microscope glass slide using two pieces of double-sided tape. For this analysis, 1 × 10⁵ SKMEL-147 cells were plated in a 6-well plate containing a glass coverslip. After 24 h, the coverslips were removed from the wells and immersed in PBS solution. The coverslips were sealed with nail polish to prevent evaporation. Dark-field microscopy was performed with the aid of the CytoViva ultra-resolution imaging system, equipped with a halogen 150 W light source (at low power) and a 60 and 100×/1.30 oil lens. The CytoViva ultra-resolution imaging system is composed by a dark-field hyperspectral arrangement mounted on an Olympus BX51 microscope. The dark-field configuration generates a hollow light cone focused on the specimen.27Complex release experiments
The release experiments were carried out in duplicate under the same cell incubation conditions. In this experiment, 0.5 mg mL−1 of unmodified and modified matrix loaded with [Cu(isapn)]+1 or [Zn(isapn)]+2 were placed in a 96-well plate containing 200 μL DMEM at 37 °C, in 5% CO2 atmosphere. At different intervals of incubation time, 100 μL was collected and transferred to a microtube. Next, each suspension was centrifuged at 14000 rpm for 5 min, and the supernatants were collected and analysed by a Bruker Picofox spectrometer. In the analyses by this technique, samples were prepared in the form of thin films deposited on quartz and then kept in an oven at 110 °C. For the quantification of metal released during incubation, the internal standard addition of the element titanium was used, in the final concentration of 5 ppm.
Alkaline comet assay – single-cell electrophoresis assay
The alkaline comet assay was performed as described by Torres et al.28 with modifications. 1 × 10⁵ cells were plated on a 12-well plate and grown at 37 °C in a 5% CO2 atmosphere. The next day, cells were incubated in the presence or absence of the free and immobilised complexes for 24 h. After incubation, cells were trypsinized and re-suspended in PBS comet buffer (2.5 mM KCl, 1.0 mM KH2PO4, 0.1 mM NaCl and 8.0 mM Na2HPO4, pH 7.4). Thirty microliters of each cell suspension was added to 100 μL of 0.5% low melting point agarose (LMPA, Sigma; in PBS comet buffer) at 37 °C and spread onto a slide pre-coated with 1.5% normal melting agarose (NMA; Sigma, in PBS comet buffer) using a coverslip. The slides were protected from light and kept at 4 °C for 20 min to allow the agarose to solidify, and the coverslips were gently removed. Then, the slides were immediately submersed in freshly prepared cold lysis solution (2.5 M NaCl, 100 mM EDTA, 10 mM Tris, 10% DMSO and 0.1% Triton X-100, 4 °C) and incubated overnight at 4 °C in the absence of light. The slides were placed in an electrophoresis chamber filled with freshly prepared alkaline buffer (300 mM NaOH and 1 mM EDTA, pH > 13, 4 °C) and incubated for 30 min at 4 °C for DNA denaturation. Electrophoresis was conducted at 25 V and 300 mA for 30 min in the same buffer. After electrophoresis, the slides were transferred to the neutralization buffer (0.4 M Tris, pH 7.5) for 15 min, dried at RT and fixed with pure ethanol for 5 min. The slides were dried and maintained at 4 °C, protected from light and moisture. To acquire the image, the slides were stained with an ethidium bromide solution (20 mg mL−1 in deionized water) and immediately analysed under a fluorescence microscope. The analysis and evaluation of DNA damage was performed in the Komet 6.0 software (Andor Technology, Belfast, Northern Ireland) using the Olive Tail Moment (OTM) parameter.DNA cleavage
In order to monitor the effect of the complexes on the DNA, a flow cytometry assay was performed using the Muse Multi-Color DNA Damage kit (MCH200107, Merck Millipore), which allows a fast analysis of DNA double-strand breaks (DSBs) by the activation of the protein kinase ATM (ataxia-telangiectasia mutated) and H2AX (H2A histone family, member X). For this test, 1 × 10⁵ cells were seeded onto a 12-well plate and grown for 24 h. After this period, the adhered cells were washed three times with PBS, and fresh DMEM containing MCM-41, MCM-[Cu(isapn)], MCM-[Zn(isapn)], MCM-atzac, MCM-atzac-[Cu(isapn)] or MCM-atzac-[Zn(isapn)] was added, at the concentration of the respective IC50 values, and incubated for 24 or 48 h. After incubation, cells were re-suspended with a trypsin–EDTA solution and centrifuged at 300g for 5 min in a microtube. The supernatant was discarded and the pellet was re-suspended with 200 μL of the 1× assay buffer, then re-centrifuged. Following that, the cells were fixed with 200 μL of the fixation buffer and 200 μL of the 1× assay buffer, incubated for 10 min on ice, and centrifuged at 300g for 5 min. Again, the supernatant was discarded, and cells were permeabilized with 200 μL of permeabilization buffer for 10 min on ice. After centrifugation, the supernatant was discarded and 100 μL of the antibody solution was added (1:20 of anti-phospho-ATM and anti-phospho-H2AX antibody in 1× assay buffer). The cells were incubated for 30 min in the dark, at RT. After incubation, the samples were centrifuged once more and re-suspended in 200 μL of the 1× assay buffer. Finally, the samples were read using the Muse Cell analyser.
Results and discussion
Synthesis and characterization of the metal complexes immobilized into unmodified and modified MCM-41
The unmodified and modified MCM-41 nanoparticles loaded with metal complexes ([Cu(isapn)]ClO41 and [Zn(isapn)]ClO42) were prepared initially by the basic hydrolysis of tetraethylorthosilicate (TEOS) in an aqueous solution of ammonium hydroxide and hexadecyltrimethyl ammonium bromide (CTAB) as surfactant. Subsequently, the mesoporous matrix MCM-41 was reacted under reflux with the silylating agent CPTMS in toluene, giving surface-bound chloropropyl groups with a loading density of 1.77 mmol g−1 (based on the carbon content of 6.37%). Afterward, the new carrier matrix (MCM-atzac) was synthesized through the reaction between the previously obtained material with 3-amino-1,2,4-triazole-5-carboxylic acid ligand (atzac). Based on nitrogen elemental analysis (2.18%), the density of functionalization was 0.389 mmol of (atzac)propyl groups per gram of MCM-atzac. On the other hand, a decrease in carbon loading density from 1.77 mmol g−1 to 0.86 mmol g−1 was expected after the reaction with the atzac ligand. The presence of 3-amino-1,2,4-triazole-5-carboxilic acid ligand on the MCM-Cl was confirmed by 13C solid-state NMR spectroscopy. The spectrum of the precursor material (MCM-Cl) (Fig. 2A) shows three peaks at 10.51 (CH2–Si) (1), 27.78 (CH2–CH2Si) (2), and 47.73 ppm (CH2–Cl) (3), which are assigned to the carbon of the propyl chain of the silylating agent. After the reaction with atzac ligand, three new peaks appear at 141.60 (4), 150.75 (aromatic ring) (5), and 157.06 (carboxylic acid group) (6) (Fig. 2B), showing that most of the chloropropyl groups were replaced by (atzac)propyl groups. All other peaks refer to the hydroxyl groups that remained unreacted during the carrier preparation steps. | ||
| Fig. 2 13C solid-state NMR spectra of (A) MCM-Cl and (B) MCM-atzac and 29Si solid-state NMR spectra of (C) MCM-Cl and (D) MCM-atzac. | ||
29Si NMR solid-state spectra of MCM-Cl (Fig. 2C) display some peaks at −112.33 (1) and −103.10 ppm (2), which are due to Si(O–Si)3OH (Q3) and Si(OSi)4 (Q4) species of the silica walls.29 The peaks at −68.00 (3), −59.07 (4), and −50.14 (5) ppm show different silicon coordination environments, such as RSi(OSi)3 (T3), RSi(OSi)(OH)2 (T2) and RSi(OSi)2(OH) (T1), respectively.30 Reacting MCM-Cl with atzac ligand, the 29Si solid-state NMR data of the obtained MCM-atzac (Fig. 2D) displays the absence of the peak T1 at −50.14 ppm. Also, there is a slight displacement of the peaks Q3 = −111.61 ppm (1), Q4 = −103.16 ppm (2), T3 = −67.68 ppm (3), and T2 = −60.16 ppm (4) when compared to the previous compound, which attests to the binding of the atzac to MCM-Cl.
Therefore, the metal complexes [Cu(isapn)]ClO41 and [Zn(isapn)]ClO42, immobilized into the unmodified and modified matrices, were prepared and characterized by elemental analysis, UV/Vis, IR, and EPR or NMR. The copper(II) and zinc(II) loading on MCM-[Cu(isapn)], MCM-atzac-[Cu(isapn)], MCM-[Zn(isapn)] and MCM-atzac-[Zn(isapn)] were 3.06, 1.73, 4.29, and 2.64%, respectively. The ability of binding the complexes was determined by ICP-OES, and the values of 0.48 and 0.272 mmol of copper groups per gram of MCM-[Cu(isapn)]and MCM-atzac-[Cu(isapn)], respectively, were verified. On the other hand, the zinc(II) loading was 0.656 and 0.403 mmol per gram of unmodified and modified matrix, respectively.
These values demonstrate that there is greater interaction between the zinc complex and the matrices than with the copper complex. In the FTIR spectra of the MCM-41 (Fig. S2 (ESI†) – black line), an intense and wide band is observed at 3445 cm−1, which is characteristic of the OH-stretching of the silanol groups, as well as the remaining adsorbed water.31 This same behaviour has been observed for the other compounds. The band at 1090 cm−1 is characteristic of siloxane groups (Si–O–Si) present in the MCM-41 mesoporous material structure.32,33 Next, the unmodified matrix was reacted with 3-chloropropyl trimethoxysilane (Fig. S2A or B (ESI†) – pink lines), and two weak bands appear at 2921 and 2854 cm−1, which are derived from the silylating agent (CPTMS). After the reaction with the atzac ligand, there is a displacement of the C–H stretch to higher frequencies that is not too evident in the FTIR spectra, but in the Raman spectra the bands appear at 2896 and 2925 cm−1. Also, a new band appears as a shoulder at 1574 cm−1, which may be attributed to typical N–H bending vibrations. Another characteristic band of the atzac ligand appears in the Raman spectrum at 983 cm−1, attributed to out-of-plane bending of N–H of the imidazole (Fig. 3). In the FTIR spectra of the copper and zinc complexes immobilized into the unmodified (Fig. S2A or B (ESI†) – red and blue lines) and modified matrices (Fig. S2A or B (ESI†) – wine and dark cyan lines), it was not possible to observe all characteristic bands of the complexes. This result was expected, since the total amount of metal complexes immobilized in the pores is relatively very small compared to silica (discussed in Table 4).
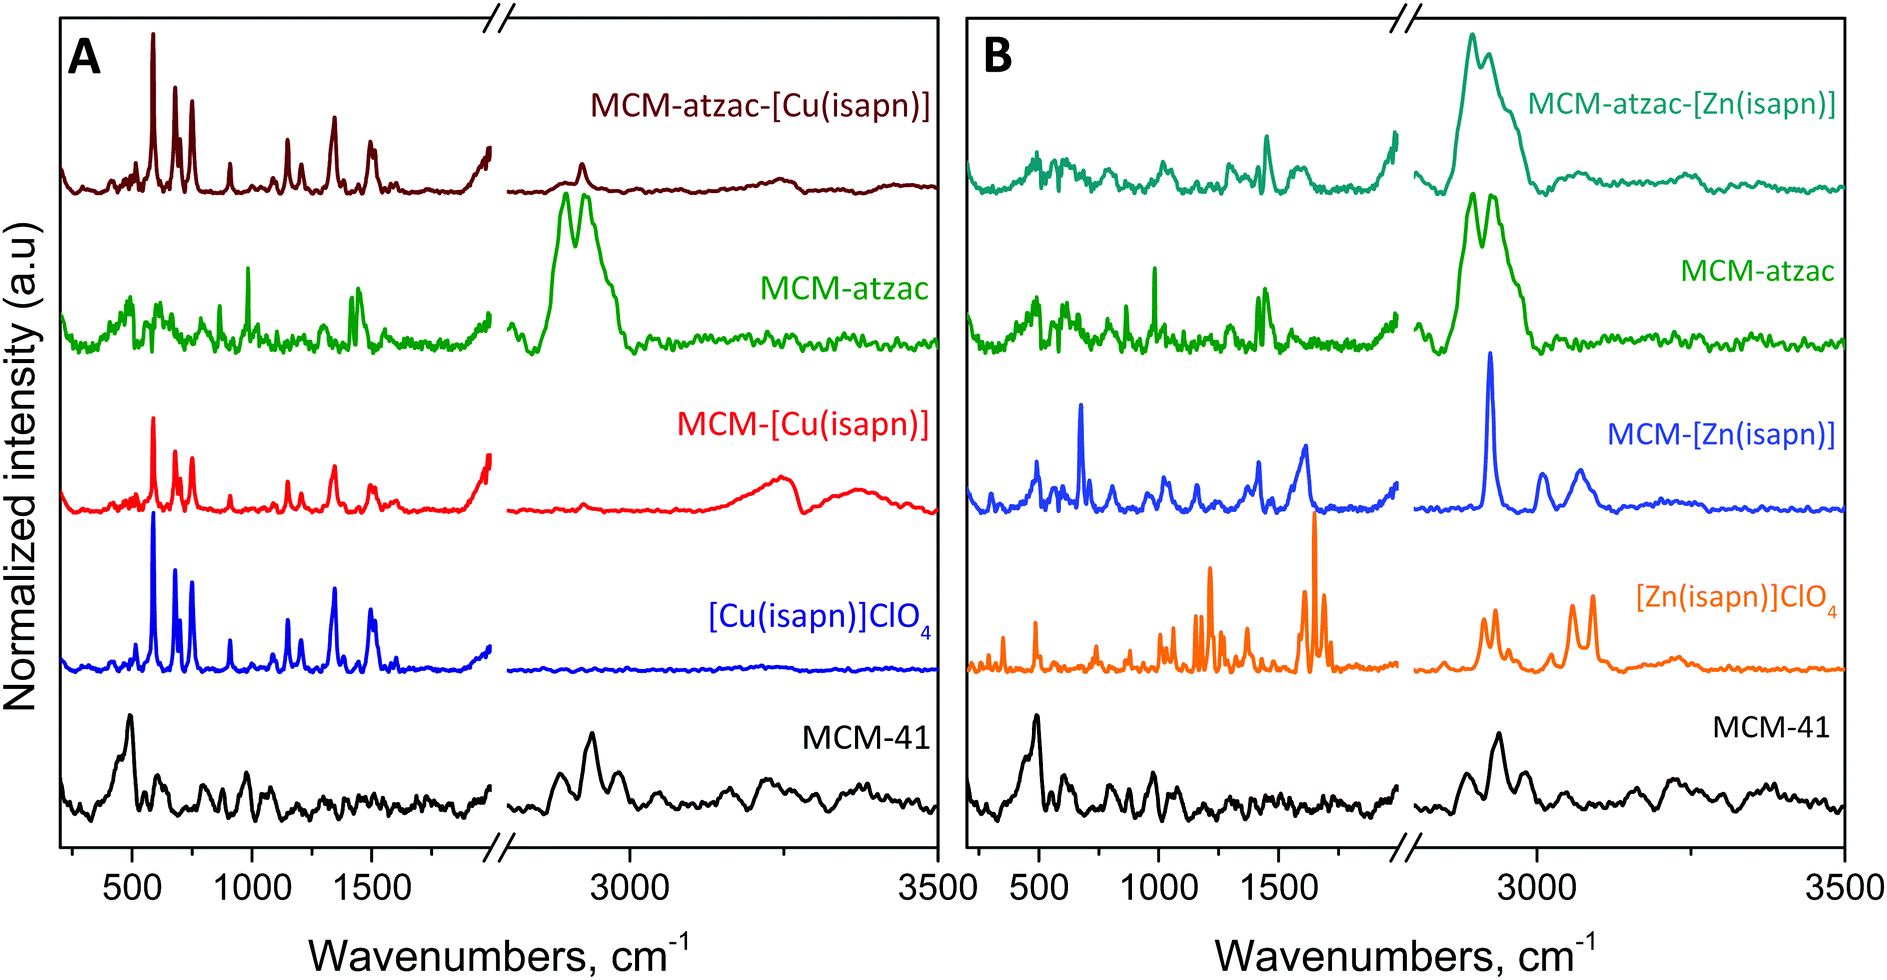 | ||
| Fig. 3 FT-Raman spectra of the (A) copper and (B) zinc complexes immobilized into the unmodified and modified matrices. | ||
However, the appearance of two weak bands in the CH stretching region may be attributed to the complexes and the modifying groups of the matrix.
The normalized Raman spectra of the MCM-[Cu(isapn)] and MCM-atzac-[Cu(isapn)] (Fig. 3A) show remarkable similarity with the free [Cu(isapn)]+ complex. This similarity may be explained by the small interaction between [Cu(isapn)]+ and unmodified or modified matrices. In the spectra shown, this can be observed by the absence of shifts and band asymmetries, which are known interaction factors.
Furthermore, this similarity shows that the copper ions are not lost to any significant extent in the matrix. Additionally, it is possible to observe a decrease of the silica bands due to a stronger scattering by the [Cu(isapn)]+. The silica bands that can be observed only in the unmodified MCM-41 were previously assigned by X. Gao et al.34 and C. B. Wang et al.,35 although these bands are really weak in the Raman spectra, as can be seen in Fig. 3.
On the other hand, the spectra of MCM-[Zn(isapn)] and MCM-atzac-[Zn(isapn)] (Fig. 3B) show high discrepancy when compared to the free [Zn(isapn)]+ Raman profile. In the region of carbonyls (1600 to 1800 cm−1); an asymmetric band profile is observable, probably due to intermolecular interactions such as hydrogen bonding. A similar profile is observed in the 1100 cm−1 region as well.
These interactions affect the Raman spectra in such a way that the pure zinc complex is not very noticeable within the matrices, although other characterization techniques showed its presence. The pure zinc complex shows a complex profile due to the keto–enolic equilibria, in contrast to the copper complex, which shows a simpler profile, more similar to enolic–enolic equilibria in the complex due to the absence of the N–H stretching vibration. For the MCM-[Zn(isapn)], a simpler profile is observed than the pure complex, possibly due to a stabilization of one of the tautomeric forms after the inclusion in the matrix. In addition, copper complexes are better scattering molecules than the zinc complexes, as observed in the pure Raman spectra counts presented in Fig. S1 (ESI†).
The surface area and pore volume of each compound or material were evaluated using BET method (Table 1). All compounds display a type IV nitrogen adsorption isotherm and H1 hysteresis loop, which is a classic characteristic of the MCM-41 with a well-done hexagonal cylinder (Fig. S3 (ESI†)).36,37
| Samples | BET surface area (m2 g−1) | Pore volume (cm3 g−1) |
|---|---|---|
| MCM-41 | 1018 | 1.225 |
| MCM-[Cu(isapn)] | 525 | 0.269 |
| MCM-[Zn(isapn)] | 641 | 0.461 |
| MCM-atzac | 716 | 0.365 |
| MCM-atzac-[Cu(isapn)] | 365 | 0.333 |
| MCM-atzac-[Zn(isapn)] | 801 | 0.382 |
The unmodified MCM-41 has a high surface area and pore volume38 after grafting of chloropropyl groups and treatment with atzac ligand. After the immobilization of the copper(II) or zinc(II) complexes into the unmodified and modified matrix, a decrease in the surface area and pore volume was observed for all materials. The exception occurred for the MCM-atzac-[Zn(isapn)], in which it was observed that both its surface area and pore volume present higher values than its precursor material, MCM-atzac. This can be attributed to a stronger interaction of the zinc complex 2 with the MCM-atzac matrix. After the immobilization of the complex, the internal pores were occupied, causing an external expansion of its distribution, and therefore increasing the surface area and pore volume (Table 1).
However, the arrangement of these molecules inside the pores is not regular, and there may be regions with a high density of organofunctional groups, causing the formation of protuberances and increasing the distribution of pore size and surface area. This explanation agrees with the zinc loading found in MCM-atzac-[Zn(isapn)] and the corresponding thermogravimetric analysis data.
The thermogravimetric analyses (TGA) generate curves of mass loss as a function of the temperature gradient. Thus, it is possible to obtain important information on the degradation temperature of the functionalized or immobilized groups on the matrices, as well as to estimate the amount of organic groups available on their surfaces.39 The results show mass losses in characteristic regions for each type of material. Fig. 4 shows the thermogravimetric curves of the metal complexes immobilized on the unmodified and modified matrices. These materials are thermally stable up to about 200 °C, while the stability of the unmodified precursor matrix (MCM-41) is much higher. In the thermogram of unmodified MCM-41 (Fig. 4A, line a), it is possible to observe a first loss of mass (1.14 wt%) at a temperature between 25–120 °C, which can be ascribed to the removal of physisorbed water molecules.40,41 Further, the loss of 5.37 wt% above 120 °C is due to the removal of water during the condensation of adjacent silanol groups.42,43 In the thermogravimetric curves of MCM-[Cu(isapn)] (Fig. 4A, line b) and MCM-[Zn(isapn)] (Fig. 4A, line c), the removal of water molecules can be seen in the range of 25–200 °C. Next, the mass losses observed after water elimination can be attributed to the release of organic groups from the copper and zinc complexes, confirming that these complexes did not lose the metal ion to the matrix. After the reaction of the MCM-41 with chloropropyl groups and its modification with atzac groups, the thermogravimetric curve of the MCM-atzac (Fig. 4A, line d) shows a first loss of mass (3.81 wt%) up to a temperature close to 120 °C, which can be attributed to water removal.44 A second mass loss (12.80 wt%) is detected between 120–630 °C and refers firstly to the decomposition of the atzac ligand and chloropropyl group, and subsequently of the remaining chloropropyl groups, which are more internally bound in the pores of the matrix. The TGA curves of MCM-atzac-[Cu(isapn)] (Fig. 4A, line e) and MCM-atzac-[Zn(isapn)] (Fig. 4A, line f) produced about 16 and 12% weight loss, respectively. This is due to the decomposition of the modified organic groups and of the immobilized metal complexes, while the MCM-atzac matrix shows a total mass loss of 17.08% in the same temperature range. These results agree with those found by ICP-OES.
 | ||
| Fig. 4 (A) Thermogravimetric curves and (B) powder X-ray diffraction patterns of the copper(II) and zinc(II) complexes immobilized into the unmodified and modified matrix. | ||
Fig. 4B displays the low angle range of XRD patterns for each sample. The X-ray powder diffractograms of the MCM-41 (Fig. 4B, line a) show three diffraction peaks at around 2 theta = 2.48 (100), 4.22 (110) and 4.83 (200), corresponding to the crystalline face of the matrix.45–47 This diffraction pattern is typical of the mesoporous nanosilica with hexagonal pore structure. After immobilization of the copper and zinc complexes into the unmodified matrix, the X-ray powder diffractograms of MCM-[Cu(isapn)] and MCM-[Zn(isapn)] (Fig. 4B, lines b and c) show the same three peaks indexed to the reflections 100, 110 and 200, with a slight shift to low angle range compared to the previous unmodified material. The presence of these diffraction peaks may indicate that the complexes were physisorbed in the unmodified matrix pores.
In X-ray powder diffractograms of MCM-atzac (Fig. 4B, line d), the 110 and 200 reflections practically disappear, and the (100) reflection is slightly shifted to a higher-angle range (2θ = 2.58). These changes may be due to the atzac functional groups attaching to the matrix. The same behaviour was observed in the spectra of MCM-atzac-[Cu(isapn)] and MCM-atzac-[Zn(isapn)] (Fig. 4B, lines e and f), and a shift to 2θ = 2.60 and 2.66, respectively, might suggest the immobilization of the complexes in the modified matrix (MCM-atzac).
Fig. 5 shows the EPR spectra of MCM-[Cu(isapn)] and MCM-atzac-[Cu(isapn)] materials, and their respective analogues with CuCl2 can be seen in Fig. S4 (ESI†).
 | ||
| Fig. 5 X-band EPR spectra of the copper complex immobilized into the unmodified and modified matrix at 77 K. | ||
As can be seen in Table 2, the EPR data measured at 77 K show different parameters for the free complex, MCM-[Cu(isapn)], MCM-atzac-[Cu(isapn)] and its respective analogous materials with CuCl2. The verified hyperfine structure and determined values of g‖ parameter indicate an elongated axial geometry around copper ion for all samples.
| Compounds | g iso | g ⊥ | g ‖ | A ‖ (G) |
|---|---|---|---|---|
| [Cu(isapn)]ClO4 | 2.180 | 2.114 | 2.311 | 118 |
| MCM-[Cu(isapn)] | 2.153 | 2.080 | 2.299 | 154 |
| MCM-atzac-[Cu(isapn)] | 2.151 | 2.069 | 2.314 | 154 |
| MCM-CuCl2 | 2.186 | 2.077 | 2.404 | 122 |
| MCM-atzac-CuCl2 | 2.139 | 2.066 | 2.284 | 166 |
Considering the complex [Cu(isapn)], its structure shows a remarkable change when inserted or immobilized in the silica-carriers, as attested by the A‖ parameter, which changes from 118 to 154 G. Probably, a square pyramidal geometry is observed in the free complex, with the perchlorate ion occupying the axial position modified when the complex interacts with the matrix. A similar change was observed for the free copper ions, although showing different parameters. These differences indicate that the oxindolimine ligand is kept in the immobilized species, providing high steric hindrance with the functionalizing coordinating groups in the matrix.
Cell viability analysis
In order to show the influence of the unmodified and modified matrices on the cytotoxicity of complexes [Cu(isapn)]ClO41 and [Zn(isapn)]ClO42, MTT assays were performed in the presence and absence of the matrices MCM-41 and MCM-atzac against tumor cell lines SKMEL-147, SKMEL-05 and HeLa, in comparison to non-tumor cells, fibroblast P4. Initially, the assay was performed using the free complexes (Table 3).| Complexes | IC50 (μM) | |||||||
|---|---|---|---|---|---|---|---|---|
| SKMEL-147 | SKMEL-05 | HeLa | Fibroblast | |||||
| 24 h | 48 h | 24 h | 48 h | 24 h | 48 h | 24 h | 48 h | |
| [Cu(isapn)]ClO4 | >100 | >100 | >100 | >100 | 80 ± 6 | 76 ± 4 | >100 | >100 |
| [Zn(isapn)]ClO4 | >100 | >100 | >100 | >100 | >100 | >100 | >100 | >100 |
| Carriers/complexes | IC50 (μg mL−1) | |||||||
|---|---|---|---|---|---|---|---|---|
| SKMEL-147 | SKMEL-05 | HeLa | Fibroblast | |||||
| 24 h | 48 h | 24 h | 48 h | 24 h | 48 h | 24 h | 48 h | |
| MCM-41 | 204 ± 7 | 202 ± 9 | >500 | >500 | >500 | >500 | 415 ± 11 | 426 ± 12 |
| MCM-[Cu(isapn)] | 155 ± 5 | 150 ± 6 | >500 | 266 ± 13 | >500 | 313 ± 12 | 418 ± 11 | 298 ± 9 |
| MCM-[Zn(isapn)] | 98 ± 5 | 85 ± 9 | >500 | 222 ± 15 | >500 | >500 | 325 ± 16 | 182 ± 15 |
| MCM-atzac | 53 ± 3 | 49 ± 2 | >500 | >500 | >500 | >500 | 347 ± 11 | 93 ± 3 |
| MCM-atzac-[Cu(isapn)] | 34 ± 1 | 35 ± 1 | >500 | 258 ± 16 | >500 | >500 | 186 ± 9 | 80 ± 7 |
| MCM-atzac-[Zn(isapn)] | 27 ± 2 | 11 ± 3 | >500 | 286 ± 7 | >500 | >500 | 183 ± 2 | 78 ± 1 |
The high IC50 values obtained for free complexes attested to the low toxicities of these complexes against the four lines above-mentioned. Except for the values obtained with [Cu(isapn)]ClO4 against HeLa cells, 80 ± 6 μM after 24 h incubation and 76 ± 4 μM after 48 h, for all other materials, these values were above 100 μM (Table 3). Subsequently, the copper(II) and zinc(II) complexes immobilized into the unmodified and modified matrices were tested. At this stage, the results confirmed selectivity against SKMEL-147 cells; the values obtained for the unmodified matrix (MCM-41) were around 200 μg mL−1 with 24 or 48 h of incubation (Table 3). When [Cu(isapn)]ClO41 and [Zn(isapn)]ClO42 complexes were immobilized into the pores of the pure matrix MCM-41, the subsequent MTT assay presented an increase in its cytotoxicity of 24% for MCM-[Cu(isapn)] after 24 or 48 h of treatment. On the other hand, the cytotoxicity for MCM-[Zn(isapn)] increased about 51% for the first 24 h, and 57.5% after 48 h of stimulation. Going further in the quest for greater cytotoxicity, MCM-41 was functionalized with atzac groups and the corresponding IC50 value was about 50 ± 2 μg mL−1 (Table 3); i.e., there was an increase of 75% in cytotoxicity over the pure matrix, and an increase of almost 60% above that of the MCM-[Zn(isapn)] within 48 h. By immobilizing the copper(II) and zinc(II) complexes on the MCM-atzac, the IC50 results were approximately 35 ± 1 μg mL−1 for MCM-atzac-[Cu(isapn)] for both incubation times; for MCM-atzac-[Cu(isapn)], they were 27 ± 2 μg mL−1 after 24 h and 11 ± 3 μg mL−1 after 48 h of treatment. Similar assays were performed with the immobilization of copper(II) and zinc(II) chloride in the unmodified and modified matrices, and the results showed much lower cytotoxicity than those with the complexes. From Table 3, the selectivity indexes of the immobilized complexes in the pure matrix (MCM-41) against the SKMEL-147 cells in relation to the fibroblast presented values ranging from 1.99 to 3.32. After modification with atzac groups and subsequent immobilization of the copper(II) and zinc(II) complexes, these indexes increased to 6.55, 5.47 and 6.78, respectively, for matrix MCM-atzac, MCM-atzac-[Cu(isapn)] and MCM-atzac-[Zn(isapn)] after 24 h of exposure.
To better analyse the cytotoxicity data of the different materials, the content of metal complexes loaded in each matrix was determined. In the case of the MCM matrix, a 25% metal loading was verified for the copper complex 1, versus 28% for the zinc complex 2. A lower complex loading was verified when the MCM-atzac matrix was used, 14% for complex 1 and 17.4% for complex 2.
Table 4 also displays the IC50 values (estimated as μM concentration) based on the content of complexes immobilized, to better demonstrating the increase in their cytotoxicity after insertion in both types of matrices.
| Carriers-complexes | % Complexes (m/m) | [Complex] IC50 (μM) | |||
|---|---|---|---|---|---|
| SKMEL-147 | Fibroblast | ||||
| 24 h | 48 h | 24 h | 48 h | ||
| MCM-[Cu(isapn)] | 25.0 | 73.2 ± 2.4 | 70.8 ± 2.4 | 197.4 ± 5.2 | 140.7 ± 4.3 |
| MCM-atzac-[Cu(isapn)] | 14.0 | 9.1 ± 0.3 | 9.3 ± 0.3 | 49.6 ± 2.4 | 21.3 ± 1.9 |
| MCM-[Zn(isapn)] | 28.3 | 64.4 ± 3.3 | 55.8 ± 5.9 | 213.5 ± 10.5 | 119.6 ± 10.4 |
| MCM-atzac-[Zn(isapn)] | 17.4 | 10.9 ± 0.8 | 4.4 ± 1.2 | 73.9 ± 0.8 | 31.5 ± 0.4 |
These calculations were performed using the percentages of metals found inside each material from the ICP-OES data and considering a 100% delivery. The data make clear that the metal concentrations at the IC50 point were lower than the corresponding values for the free complexes. In other words, the use of the matrices provides further increases in the cytotoxicity of the studied metal complexes.
Microscopy images of treated cells
From CytoViva™ images (Fig. 6), the presence of the complex-loaded MCM nanoparticles was observed mainly in the cytoplasm, both for the copper and zinc complexes. However, similar images for MCM-atzac nanoparticles loaded with the same metal complexes also exhibit a significant amount of the nanoparticles in the nucleus, although they still predominate in the cytosol. By comparing these images, we can see that the MCM-atzac materials show a better dispersion all over the cell. For both metal-loaded materials, the induction of apoptotic bodies occurs within the first 24 h of incubation. Fig. S5 (ESI†) shows the SEM images of unmodified and modified matrices loaded with copper(II) or zinc(II) complexes. For MCM-[Cu(isapn)] and MCM-atzac-[Cu(isapn)], these images show a cluster of particles of various sizes, ranging from nanometres to micrometres. On the other hand, the images for MCM-[Zn(isapn)] and MCM-atzac-[Zn(isapn)] show more uniform and dispersed particles, with sizes around 41 to 52 nm for MCM-[Zn(isapn)], and around 66 nm for MCM-atzac-[Zn(isapn)]. | ||
| Fig. 6 Optical images, acquired with the CytoViva™ instrument, of SKMEL-147 cells incubated for 24 h. (A) Control, (B) MCM-[Cu(isapn)], (C) MCM-[Zn(isapn)], (D) MCM-atzac-[Cu(isapn)] and (E) MCM-atzac-[Zn(isapn)] nanoparticles. Arrows indicate the localization of metal-loaded NPs (bright points) or apoptotic bodies (dark circles). | ||
These results on the morphology and speciation can explain the verified differences in the reactivity of the active metal-loaded materials inside the cell.
Metal complex release from the carriers
Fig. 7 shows the release curves of the complexes [Cu(isapn)]ClO41 and [Zn(isapn)]ClO42 immobilized into the MCM-41 (Fig. 7A) and MCM-atzac matrices (Fig. 7C). From these curves, we can see that most of the copper complex was quickly released from both matrices (80–85%), during the first hour, reaching 98 and 99% of total complex delivered after 24 and 48 h, respectively. On the other hand, the rate release of the zinc complex 2 from the MCM matrix during the first hour was 45% (Fig. 7B), while for the modified MCM-atzac matrix it was 68% within the same time (Fig. 7D). The total release from the MCM-[Zn(isapn)] sample after 24 and 48 h was 55% and 63%, respectively. For MCM-atzac-[Zn(isapn)], it was 80% and 82% in 24 and 48 h, respectively. Due to physicochemical properties of the metallodrug or weak interactions between the metallodrug and the matrices, a premature release before reaching the target or site of action may occur.48 However, despite these observed differences in loading content and release time, both complexes 1 and 2 show quite closer cytotoxicity values, with lower IC50 values when immobilized in MCM-atzac matrix than in MCM matrix. | ||
| Fig. 7 Metal release kinetics from (A) MCM-[Cu(isapn)], (B) MCM-[Zn(isapn)], (C) MCM-atzac-[Cu(isapn)], and (D) MCM-atzac-[Zn(isapn)] at 37 °C in DMEM. | ||
Comet and DNA cleavage assay
By the alkaline comet assay, it was possible to quantify DNA damage in SKMEL-147 cells after 24 h exposure to the different compounds. DNA damage is expressed by the parameter Olive Tail Moment (OTM), which estimates the intensity and length of the tail (fragmented DNA) in relation to the head (non-fragmented DNA), as shown in Fig. 8. From the images, along with the OTM index graph, it is possible to observe that the untreated cells (control) and the cells treated with copper(II) chloride showed no or negligible DNA damage. However, the MCM-41 matrix causes twice as much DNA damage when compared to the control/CuCl2(aq) (see Fig. 8A and B, OTM index graph), and the MCM-atzac matrix exhibits nearly 5-fold greater damage than the control (OTM = 4.75). On the other hand, the OTM index decreases with the immobilization of copper(II) chloride in the pure and modified matrix (Fig. 8E and F). These data show an increase in DNA damage when there is matrix–complex interaction compared to the free matrix. This may indicate an increase in matrix bioactivity and/or that the matrix is probably influencing the intracellular transport of the complex, since the free complexes have no activity against SKMEL-147. Overall, the assay shows considerable DNA damage, with OTM values around 7 for the carrier-complexes, while the cells not exposed to the drug show an OTM value of 1, indicating DNA is a possible target of the compounds. Since comet assays have indicated DNA as a possible target for action of the studied materials, another assay was performed with the aim of identifying whether the compounds can make single or double DNA breaks (SSB or DSB). In Fig. S4, ESI,† the data show an increase in ATM phosphorylation in cells treated with matrices containing the copper and zinc complexes, evidencing that the DSB repair system is active. These compounds can carry out DSBs in the melanoma cells, after exposure for 24 h, in the concentration of their respective IC50. Moreover, since histone H2A.X is an ATM substrate, increased ATM phosphorylation derived from DSBs was expected to result in an increased phosphorylation of H2A.X at serine 139.49 However, this effect was not observed in these assays, and this same behaviour has been previously reported in the literature.50 This may be due to a possible inhibition of ATM by the compounds tested. | ||
| Fig. 8 DNA damage in melanoma cells (SKMEL-147) after exposure for 24 h to the controls (only SKMEL-147 cells; or CuCl2(aq) added) and to matrices, in the presence or absence of the complexes. Treated cells were processed according to alkaline comet assay, and the OTM (Olive Tail Moment) parameter was taken from 100 distinct cells; this procedure was carried out in triplicate. *p < 0.05; **p < 0.001; and ***p < 0.0001. Statistical analysis was performed by one-way ANOVA and the Tukey post-test. DNA damage images for (A) control, (B) CuCl2, (C) MCM-41, (D) MCM-atzac, (G) MCM-[Cu(isapn)], (H) MCM-[Zn(isapn)], (I) MCM-atzac-[Cu(isapn)], and (J) MCM-atzac-[Zn(isapn)]. Images were not shown for (E) MCM-CuCl2 and (F) MCM-atzac-CuCl2. | ||
Conclusions
Two MCM-based matrices (MCM-Cl and MCM-atzac) were synthesized, and oxindolimine-copper(II) or zinc(II) complexes were immobilized into their structures. The zinc complex seems to interact more effectively with both matrices (MCM-Cl and MCM-atzac), and so, its surface area and the metal content in each structure increased. Both complexes maintain their structures after attaching to the pure and modified matrix. The copper complex has a stronger interaction when compared to the free ion, indicating closer bonds between the metal and the coordinating ligand atoms. It is possible to affirm that the pure and modified matrix have the same level of interaction with the copper complex, as indicated by corresponding EPR parameters.The cell viability assays showed that the matrices made the compounds more cytotoxic against the tumor cells tested and, further, increased their selectivity for the SKMEL-147 lineage relative to the non-tumor fibroblast P4. In addition, this study showed the cleavage of the genetic material in SKMEL-147 cells after treatment with these materials, attesting that a possible target of their action is DNA, as indicated by DNA cleavage in comet tests. Imaging with CytoViva™ showed that those materials have the capacity to enter the cells and release the metal complexes by a kinetic process that depends on the metal. In this way, the matrices can carry the active complexes into the intracellular space, where they can spread to specific cellular compartments. Therefore, these results are indicative that these silica matrices with the immobilized antitumor complexes are useful and advantageous in possible therapeutic treatments.
Conflicts of interest
The authors declare no competing financial interest.Acknowledgements
The authors are grateful to São Paulo State Research Foundation (FAPESP, Grant 2011/50318-1 and 2016/21070-5), and network CEPID-Redoxoma (Redox Process in Biomedicine, Grant 2013/07937-8) for financial support. EGV also thanks FAPESP (Grant 2016/16735-8 and 2017/21919-3) for the postdoctoral scholarship. The authors also thank Professor Marisa G. Medeiros (IQ-USP) for providing microscopy facilities in comet tests. RBM, DRS, RBF and JHM are grateful to Conselho Nacional de Desenvolvimento Científico e Tecnológico (CNPq) and Coordenação de Aperfeiçoamento de Pessoal de Nível Superior (CAPES, Finance code 001) for their PhD or MSc fellowships.References
- D. Kim, J. Kim, Y. I. Park, N. Lee and T. Hyeon, ACS Cent. Sci., 2018, 4, 324 CrossRef CAS PubMed.
- W. A. Wani, S. Prashar, S. Shreaz and S. Gómez-Ruiz, Coord. Chem. Rev., 2016, 312, 67 CrossRef CAS.
- C. I. C. Crucho, ChemMedChem, 2015, 10, 24 CrossRef CAS PubMed.
- H. Chen, D. Liu and Z. Guo, Chem. Lett., 2016, 45, 242 CrossRef CAS.
- G. Chen, I. Roy, C. Yang and P. N. Prasad, Chem. Rev., 2016, 116, 2826 CrossRef CAS PubMed.
- Y. Dai, C. Xu, X. Sun and X. Chen, Chem. Soc. Rev., 2017, 46, 3830 RSC.
- M. Zhou, K. Wen, Y. Bi, H. Lu, J. Chen, Y. Hu and Z. Chai, Curr. Top. Med. Chem., 2017, 17, 2319 CAS.
- G. Saravanakumar, J. Kim and W. J. Kim, Adv. Sci., 2017, 4, 1600124 CrossRef PubMed.
- M. Zhang, C. Saint-Germain, G. He and R. W.-Y. Sun, Curr. Med. Chem., 2018, 25, 493 CrossRef CAS PubMed.
- R. A. Petros and J. M. DeSimone, Nat. Rev. Drug Discovery, 2010, 9, 615 CrossRef CAS PubMed.
- Y. Feng, N. Panwar, D. J. H. Tng, S. C. Tjin, K. Wang and K.-T. Yong, Coord. Chem. Rev., 2016, 319, 86 CrossRef CAS.
- T. Chen, W. Wu, H. Xiao, Y. Chen, M. Chen and J. Li, ACS Macro Lett., 2016, 5, 55 CrossRef CAS.
- J. Wen, K. Yang, F. Liu, H. Li, Y. Xu and S. Sun, Chem. Soc. Rev., 2017, 46, 6024 RSC.
- L. F. de Oliveira, K. Bouchmella, K. d. A. Gonçalves, J. Bettini, J. Kobarg and M. B. Cardoso, Langmuir, 2016, 32, 3217 CrossRef CAS PubMed.
- G. Wang, J. Dong, T. Yuan, J. Zhang, L. Wang and H. Wang, Macromol. Biosci., 2016, 16, 990 CrossRef CAS PubMed.
- R. M. Sábio, M. Gressier, J. M. A. Caiut, M.-J. Menu and S. J. L. Ribeiro, Mater. Lett., 2016, 174, 1 CrossRef.
- A. Baeza and M. Vallet-Regí, Curr. Top. Med. Chem., 2015, 15, 2306 CrossRef CAS PubMed.
- J. Zhang, Z.-F. Yuan, Y. Wang, W.-H. Chen, G.-F. Luo, S.-X. Cheng, R.-X. Zhuo and X.-Z. Zhang, J. Am. Chem. Soc., 2013, 135, 5068 CrossRef CAS PubMed.
- G. Filomeni, G. Cerchiaro, A. M. D. C. Ferreira, A. De Martino, J. Z. Pedersen, G. Rotilio and M. R. Ciriolo, J. Biol. Chem., 2007, 282, 12010 CrossRef CAS PubMed.
- G. Filomeni, S. Piccirillo, I. Graziani, S. Cardaci, A. M. Da Costa Ferreira, G. Rotilio and M. R. Ciriolo, Carcinogenesis, 2009, 30, 1115 CrossRef CAS PubMed.
- R. B. Miguel, P. A. D. Petersen, F. A. Gonzales-Zubiate, C. C. Oliveira, N. Kumar, R. R. do Nascimento, H. M. Petrilli and A. M. da Costa Ferreira, J. Biol. Inorg. Chem., 2015, 20, 1205 CrossRef CAS PubMed.
- P. Katkar, A. Coletta, S. Castelli, G. L. Sabino, R. A. A. Couto, A. M. d. C. Ferreira and A. Desideri, Metallomics, 2014, 6, 117 RSC.
- G. Cerchiaro, P. L. Saboya, A. M. da Costa Ferreira, D. M. Tomazela and M. N. Eberlin, Transition Met. Chem., 2004, 29, 495 CrossRef CAS.
- G. Cerchiaro, G. A. Micke, M. F. M. Tavares and A. M. da Costa Ferreira, J. Mol. Catal. A: Chem., 2004, 221, 29 CrossRef CAS.
- A. C. Gomes, S. M. Bruno, S. Gago, R. P. Lopes, D. A. Machado, A. P. Carminatti, A. A. Valente, M. Pillinger and I. S. Gonçalves, J. Organomet. Chem., 2011, 696, 3543 CrossRef CAS.
- M. Manzano, V. Aina, C. O. Areán, F. Balas, V. Cauda, M. Colilla, M. R. Delgado and M. Vallet-Regí, Chem. Eng. J., 2008, 137, 30 CrossRef CAS.
- A. Vainrub, O. Pustovyy and V. Vodyanoy, Opt. Lett., 2006, 31, 2855 CrossRef PubMed.
- T. E. P. Torres, L. C. Russo, A. Santos, G. R. Marques, Y. T. Magalhaes, S. Tabassum and F. L. Forti, Biochim. Biophys. Acta, Gen. Subj., 2017, 1861, 1879 CrossRef CAS PubMed.
- E. G. Vieira, R. O. Silva, D. R. do Carmo, E. F. Junior and N. L. Dias Filho, Mater. Chem. Phys., 2017, 191, 197 CrossRef CAS.
- E. G. Vieira, I. V. Soares, N. L. Dias Filho, N. C. da Silva, E. F. Garcia, A. C. Bastos, S. D. Perujo, T. T. Ferreira, A. H. Rosa and L. F. Fraceto, J. Colloid Interface Sci., 2013, 391, 116 CrossRef CAS PubMed.
- R. M. Silverstein, F. X. Webster, D. J. Kiemle and D. L. Bryce, Spectrometric identification of organic compounds, John wiley & sons, 2014 Search PubMed.
- J. N. Appaturi, M. Selvaraj and S. B. Abdul Hamid, Microporous Mesoporous Mater., 2018, 260, 260 CrossRef CAS.
- J. N. Appaturi and F. Adam, Appl. Catal., B, 2013, 136-137, 150 CrossRef CAS.
- X. Gao, I. E. Wachs, M. S. Wong and J. Y. Ying, J. Catal., 2001, 203, 18 CrossRef CAS.
- C.-B. Wang, G. Deo and I. E. Wachs, J. Catal., 1998, 178, 640 CrossRef CAS.
- Y. Gao, C. Yang, X. Liu, R. Ma, D. Kong and L. Shi, Macromol. Biosci., 2012, 12, 251 CrossRef CAS PubMed.
- A. Zakeri Siavashani, M. Haghbin Nazarpak, F. Fayyazbakhsh, T. Toliyat, S. J. P. McInnes and M. Solati-Hashjin, J. Mater. Sci., 2016, 51, 10897 CrossRef CAS.
- M. Hamzehloo, J. Karimi, K. Aghapoor, H. Sayahi and H. R. Darabi, J. Porous Mater., 2018, 25, 1275 CrossRef CAS.
- Z. Zhang, G. Liang and T. Lu, J. Appl. Polym. Sci., 2007, 103, 2608 CrossRef CAS.
- I. Díaz, F. Mohino, J. n. Pérez-Pariente and E. Sastre, Appl. Catal., A, 2001, 205, 19 CrossRef.
- A. Abbaszad Rafi, M. Mahkam, S. Davaran and H. Hamishehkar, Eur. J. Pharm. Sci., 2016, 93, 64 CrossRef CAS PubMed.
- X. Feng, Z. Yan, N. Chen, Y. Zhang, X. Liu, Y. Ma, X. Yang and W. Hou, New J. Chem., 2013, 37, 2203 RSC.
- A. Kiwilsza, B. Milanowski, K. Drużbicki, L. E. Coy, M. Grzeszkowiak, M. Jarek, J. Mielcarek, J. Lulek, A. Pajzderska and J. Wąsicki, J. Porous Mater., 2015, 22, 817 CrossRef CAS.
- S. Ek, A. Root, M. Peussa and L. Niinistö, Thermochim. Acta, 2001, 379, 201 CrossRef CAS.
- Q. Wang, M. Zhu, C. Xu, H. Zhang, X. Wang, B. Dai and J. Zhang, New J. Chem., 2018, 42, 6507 RSC.
- L. Xing, Y. Hui, J. Yang, X. Xing, Y. Hou, Y. Wu, K. Fan and W. Wang, J. Chem., 2018, 2018, 6 Search PubMed.
- A.-M. Brezoiu, M. Deaconu, I. Nicu, E. Vasile, R.-A. Mitran, C. Matei and D. Berger, Microporous Mesoporous Mater., 2019, 275, 214 CrossRef CAS.
- V. Mamaeva, C. Sahlgren and M. Lindén, Adv. Drug Delivery Rev., 2013, 65, 689 CrossRef CAS PubMed.
- S. Burma, B. P. Chen, M. Murphy, A. Kurimasa and D. J. Chen, J. Biol. Chem., 2001, 276, 42462 CrossRef CAS PubMed.
- A. Lewinska, J. Adamczyk-Grochala, E. Kwasniewicz, A. Deregowska and M. Wnuk, Apoptosis, 2017, 22, 800 CrossRef CAS PubMed.
Footnote |
| † Electronic supplementary information (ESI) available: Supporting Fig. S1–S7. See DOI: 10.1039/c8nj04654a |
| This journal is © The Royal Society of Chemistry and the Centre National de la Recherche Scientifique 2019 |