Effect of Ca2+ ion co-doping on radiative properties via tuning the local symmetry around the Eu3+ ions in orange red light emitting GdPO4:Eu3+ phosphors†
Pramod
Halappa
 ,
Balaji
Devakumar
and
C.
Shivakumara
 *
*
Solid State and Structural Chemistry Unit, Indian Institute of Science, Bangalore 560012, India. E-mail: shiva@iisc.ac.in; Tel: +91 80 2293 2951
First published on 12th November 2018
Abstract
A series of Ca2+ substituted GdPO4:Eu3+ novel phosphors were prepared via the solid state method. Rietveld refinement of the XRD data and transmission electron microscopy results confirmed that all these compounds adopted the monazite phase with space group P21/n. Fourier transform infrared spectroscopy (FTIR) analysis confirmed the presence of the characteristic vibrational bands for host matrix of GdPO4, and field emission scanning electron microscopy (FESEM) results revealed that the particles possess agglomerated granular morphology. Photo-luminescent spectra displayed the representative luminescence 5D0 → 7FJ (J = 0–4) intra-4f shell Eu3+ ion transitions. The magnetic dipole (5D0 → 7F1) transition was stronger than the electric dipole (5D0 → 7F2) transition. On co-doping Ca2+ content to Gd0.93Eu0.07PO4 phosphor, we observed the enhanced PL intensity as a function of Ca2+ content; the maximum intensity of 1.5 times was observed for 7 mol% of calcium doped Gd0.93Eu0.07PO4 phosphor. The enhancement of the PL intensity owing to the effective ionic radius and the mismatch in Pauling's electronegativity between co-dopant and host cations causes distortion of local crystal field surrounding the Eu3+ ions. Furthermore, this local distortion or reduced symmetry effect around the Eu3+ ions was reconfirmed by the Judd–Ofelt and life time decay analyses. The evaluated 1931 Commission International de l’Eclairage (CIE) chromaticity color coordinates exhibit orange red emission (x = 0.6247, y = 0.3748) with minimal CCT values and high color purity. This class of phosphors possessed excellent thermal stability at high temperature, and the integrated emission intensity at 423 K was about 66% of that at 303 K. Considering the above results, the Eu3+/Ca2+ co-doped GdPO4 phosphors have potential applications in the near-UV excited white light emitting diodes.
1. Introduction
For the past few years, astonishing transformation has been taking place in the electronics industry owing to its compactness, cost effectiveness, safety, energy conservation and environmental friendliness. Specifically, the light emitting diodes (LEDs), which are considered to be the future-generation solid-state lighting sources, have created their own value in the market due to their advantages such as reducing the usage of electricity for illumination, low-carbon emission, long life time, eco-friendliness, high brightness and so on. In particular, white light emitting diodes (WLEDs) have gained more attention due to their prominent advantages in the lighting industry.1–7The phosphor originated WLEDs realise the white color through the characteristic emission of phosphor materials.8,9 In fabrication of WLEDs, there are mainly two approaches. The first one is the blend of a blue InGaN LED (450–470 nm) chip and Ce3+ activated Y3Al5O12 (YAG) yellow phosphor distributed over a broad spectra to generate cool white light.10 However, this approach has some severe disadvantages such as these WLEDs showing a low colour rendering index (CRI < 80) and a high correlated colour temperature (more than 6000 K) due to the lack of red emission, which limits the application of these WLEDs in house hold and other practical applications.11–13 To overcome these limitations, the second approach of fabrication of WLEDs, i.e., combination of tri-colour (red, blue and green) phosphors on NUV chip, was popularized owing to its color stability and excellent CRI, which made these WLEDs warm light sources, more like the natural light.14–17 Unfortunately, the chemical stability and the efficiency of commercially available red phosphors (Y2O2S:Eu3+) are much lower compared to the commercialized blue (BaMgAl10O17:Eu2+) and green (ZnS:Cu+, Al3+) phosphors.18,19 Hence, to achieve the highly efficient warm white light production, design of efficient, high color purity and low CCT red light emitting phosphors is essential. In order to obtain the efficiency and long durability of phosphor, selection of proper host and activator is very important.
Among the phosphate containing phosphors, gadolinium orthophosphate (GdPO4) is an excellent host matrix, owing to its high optical damage threshold, large band gap, high absorption in the UV region, lower toxicity and excellent thermal and charge stabilization properties for rare earth ions. Moreover, phosphates can facilitate high crystal field environment, which greatly affects the rare earth ions’ characteristic emission.20,21
Eu3+ activated GdPO4 phosphor system received much attention in view of bio-medical and opto-electronic applications due to its inspirational luminescent properties.20,21 From previous reports, it is evident that Europium activated GdPO4 commonly crystallizes in the hexagonal structure at low temperature and crystallizes in monoclinic structure at high temperature. The monoclinic phase shows enhanced luminescent properties compared to those of its hexagonal structure.22 However, europium sources are very expensive and less abundant. Also, concentration quenching is an active phenomenon in rare earth doped phosphors above the threshold concentration of rare earth ions with respect to the host matrix. These problems kept out the europium activated phosphors from cost effective solid state lighting applications. Previously, Halappa et al.22 reported concentration quenching observed beyond 9 mole% of Eu3+ doping in GdPO4 system.22 Evidently, it will be attractive if further enhancement in their luminescent properties with minimal rare earth ion concentration in the system for real time applications was possible.
Luminescent emission can be improved by modifying the phosphor composition, i.e. by co-doping small quantity of impurity ions such as Ca2+, Zn2+, and Li+ ions.22–25 Generally, co-dopants enhance the luminescent intensity of the phosphors by modifying the crystal field environment or creating defects.24,26 Among various co-dopants, Li+ has been extensively studied to enhance the luminescent efficiency of phosphors.27,28 However, not much attention has been paid on the effect and the mechanism of Ca2+ ion co-doping in phosphors. To the best of our knowledge, the enhancement of luminescent intensity from Ca2+ ions in GdPO4 phosphors has not been evaluated so far. Hence, Ca2+ is a motivational candidate for co-doping in Eu3+ activated GdPO4 phosphor and investigates the effect of co-doping on luminescence properties. In this study, Eu3+/Ca2+ co-doped GdPO4 phosphors have been prepared by a conventional solid state method. The structural and morphological studies were done using X-ray diffraction (XRD), transmission electron microscopy and scanning electron microscopy (SEM) techniques. The vibrational properties of the prepared phosphors were evaluated by Fourier transform infrared (FTIR) spectroscopy, and the effect of Ca2+ co-doping on luminescent and other radiative properties of Eu3+ activated GdPO4 phosphor was investigated.
2. Experimental
2.1. Materials
All the chemicals purchased are of analytical reagent grade and used without further purification. In this preparation, gadolinium oxide (Gd2O3), di-ammonium hydrogen phosphate (NH4)2HPO4, europium oxide (Eu2O3) and calcium carbonate (CaCO3) were used as raw materials.2.2. Synthesis
Series of Eu3+/Ca2+ co-doped GdPO4 phosphors were synthesized by the solid state method. For the typical preparation of Gd0.93Eu0.07PO4 phosphor, the requisite amounts of Gd2O3, Eu2O3 and (NH4)2HPO4 were weighed and transferred to an agate mortar and ground well. The resultant mixture was kept in a porcelain crucible, and phase evaluation study of Eu3+ activated GdPO4 phosphor was monitored by varying the calcination temperature from 650 °C to 950 °C for 12 h. Similarly, series of Ca2+ co-doped Eu3+ activated GdPO4 phosphors were are also synthesized. The obtained powder product was used for further studies.2.3. Characterization
The phase purity of the phosphor samples was evaluated by the powder X-ray diffraction (PXRD) technique on PANalytical Empyrean powder diffractometer with Cu Kα source (λ = 1.5418 Å). Rietveld refinement analysis was carried out using FullProf Suite programme. The vibration bands were identified using Perkin Elmer FTIR Spectrometer using KBr as a reference. The surface morphologies of the synthesized samples were investigated using field emission scanning electron microscopy (FE-SEM, FEI Quanta 200) with instrument operated at an accelerating voltage of 10 kV. Transmission electron microscopy (TEM) and high-resolution TEM images were recorded using JEOL 2100F/FEI Tecnai 200 KV. The photo-luminescent emission and excitation spectra of these phosphor powders were measured using a Jobin-Yvon Fluoro-Max spectro-fluorometer (with 450 W Xenon lamp source). The photo-luminescent decay measurements were recorded using Edinburgh Nano-second time resolved fluorescence spectrometer (equipped with λex = 394 nm source). The temperature-dependent PL spectra of the samples were measured using Edinburgh FS5 spectro-fluorometer equipped with a temperature controller.3. Results and discussion
3.1. Powder X-ray diffraction (PXRD)
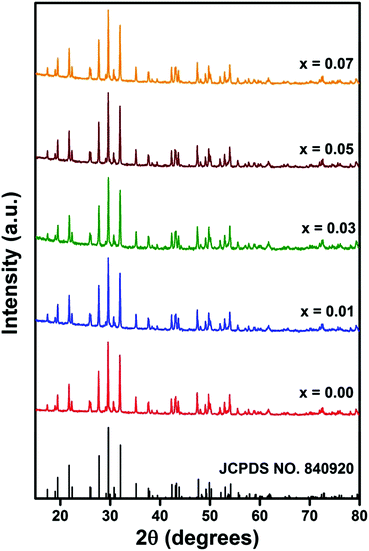
Fig. S1 (ESI†) illustrates the powder X-ray diffraction (PXRD) patterns of Gd0.93Eu0.07PO4 phosphor synthesized at 650 °C, 750 °C, 850 °C and 950 °C for 12 h, respectively. From Fig. S1 (ESI†) it is noticeable that PXRD pattern of the sample, calcined at 650 °C and 750 °C, shows peaks which correspond to the crystalline cubic Gd2O3 rich phase with a minor gadolinium phosphate phase. As the calcination temperature increased from 750 °C to 850 °C, the monoclinic GdPO4 phase was enhanced with a minor cubic Gd2O3 phase. When calcination temperature was increased to 950 °C, the PXRD pattern of the sample matched well with monazite phase of GdPO4 (space group P121/n1, JCPDS card no. 84-0920) without any additional peaks of raw materials. This result indicates that 950 °C is the optimum calcination temperature to prepare Eu3+/Ca2+ co-doped GdPO4 phosphor.Fig. 1 represents the PXRD patterns of the Gd0.93−xEu0.07CaxPO4 (0.00 ≤ x ≤ 0.07) phosphors prepared at 950 °C in 12 h. From Fig. 1, it is evident that all the X-ray diffracted peaks are in good agreement with the monazite phase of GdPO4 with the space group P121/n1 (JCPDS card no. 84-0920), and other characteristic peaks of impurity phases were not observed. This result indicates that substitution of Eu3+ and Ca2+ did not have any significant effect on monazite crystal structure of GdPO4 host matrix.
The structural parameters of prepared phosphors were estimated using the Rietveld refinement method. In this study, the Rietveld refinement was executed using the FULLPROF Suite program.29 The pseudo voigt function was used to fit numerous parameters. Observed, calculated and the difference XRD patterns of Gd0.93−xEu0.07CaxPO4, (a) x = 0.00, (b) x = 0.01, (c) x = 0.03, (d) x = 0.05 and (e) x = 0.07 are shown in Fig. 2, and there is a decent agreement between the observed and the calculated patterns. The refined structural parameters for all the phosphors are summarized in Table S1 (ESI†). We did not observe any considerable changes in lattice parameters and cell volume on doping and co-doping of Eu3+/Ca2+ in the GdPO4 host because of the comparable effective ionic radii of nine coordinated Gd3+ (1.107 Å), Eu3+ (1.120 Å), and Ca2+ (1.18 Å) ions.
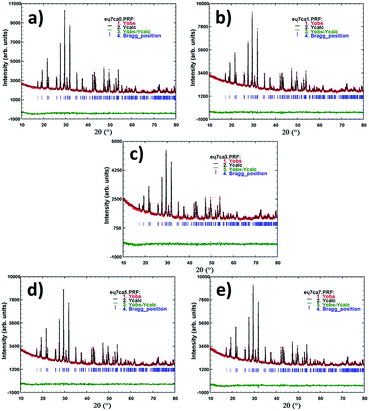 | ||
| Fig. 2 Observed, calculated and the difference XRD patterns of Gd0.93−xEu0.07CaxPO4 phosphors: (a) x = 0.00, (b) x = 0.01, (c) x = 0.03, (d) x = 0.05 and (e) x = 0.07. | ||
3.2. Electron microscopic analysis
Field emission scanning electron micrographic (FE-SEM) images of the solid state synthesized Gd0.86Eu0.07Ca0.07PO4 phosphors are displayed in Fig. 3a. It is worth noting that these samples exhibit agglomerated spherical shape particles with the average particle diameter varying from 0.25 to 0.40 μm. Fig. 3b–d display the Bright field TEM image, high resolution TEM image and SAED pattern of Gd0.86Eu0.07Ca0.07PO4 microcrystals, respectively. In Fig. 3c, the clear lattice fringes with lattice spacing of 0.235 nm correspond to the (112) plane of monoclinic GdPO4 phase, reflecting the highly crystalline nature of the phosphor. Fig. 3d illustrates the indexed SAED image, which corresponds to the (101), (011), (200), (012), (120) and (−212) planes of monoclinic GdPO4 phosphor and reconfirms the phase purity of the phosphor. Fig. S2 (ESI†) illustrates the Energy Dispersive spectra (EDS) of Gd0.86Eu0.07Ca0.07PO4 phosphor. From Fig. S2 (ESI†), it is evident that the phosphor is composed only of Gd, P, O, Eu and Ca elements and we did not observe any other impurity ions present in the phosphor. The presence of Eu and Ca elemental lines in the EDS confirms the doping of these ions in GdPO4 matrix.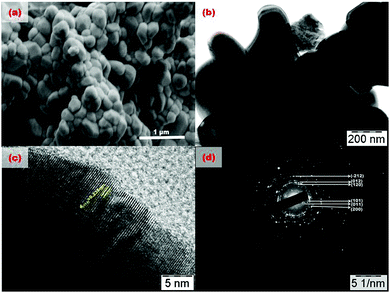 | ||
| Fig. 3 (a) FE-SEM image, (b) bright field TEM image, (c) HRTEM image, (d) SAED pattern of Gd0.86Eu0.07Ca0.07PO4 phosphors. | ||
3.3. Fourier transform infrared (FTIR) studies
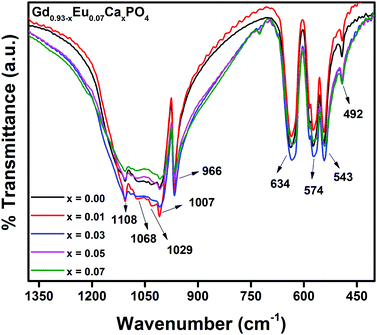
Fig. 4 illustrates the FT-IR spectra of Gd0.93−xEu0.07CaxPO4 (0.0 ≤ x ≤ 0.07) phosphors, recorded in the range from 400 to 1400 cm−1. A prominent absorption band, observed at 966 cm−1, corresponds to the symmetric stretching of P–O bonds in PO43− tetrahedra. The bands situated at 543, 574 and 634 cm−1 correspond to the asymmetric bending modes of P–O bonds, and a small band at 492 cm−1 can be assigned to symmetric bending of P–O bonds in phosphate tetrahedra. Multiple bands observed at 1007, 1029, 1068 and 1108 cm−1 correspond to the asymmetric stretching of P–O bonds in PO43− tetrahedra. Importantly, other extra peaks were not observed in FTIR spectra, which re-confirm the monophasic nature of these phosphors.30,313.4. Photoluminescence (PL) properties
Photoluminescence excitation spectra (λem = 594 nm) of Gd0.93Eu0.07PO4 phosphor prepared at 950 °C are shown in Fig. 5. From the excitation spectrum, it can be observed that a broad charge transfer band (CTB) arises due to charge transfer from O2− ion to Eu3+ ion, situated at 246 nm, and an intense peak overlaps with CTB at 272 nm due to the f–f transition (8S7/2 → 6I11/2) of Gd3+. There are multiple sharp excitation peaks in the range of 300–550 nm arising from the Eu3+ and Gd3+ ion transitions. Out of these transitions, (7F0 → 5I6) at 310 nm, (7F0 → 5H6) at 317 nm, (7F0 → 5D4) at 361 nm, (7F0 → 5G4) at 382 nm, (7F0 → 5L6) at 394 nm, (7F0 → 5D3) at 416 nm and (7F0 → 5D2) at 465 nm transitions can be attributed to electronic transitions of Eu3+ ions.32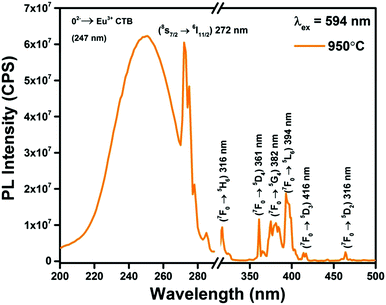 | ||
| Fig. 5 Photoluminescence excitation spectra (λem = 594 nm) of Gd0.93Eu0.07PO4 phosphor prepared at 950 °C. | ||
From Fig. S3 (ESI†), it is noticeable that the peak position of CTB of O2− → Eu3+, situated at 246 nm, exhibits enhanced spectral intensity with a slight red shift as a function of Ca2+ ions co-doping concentration in Gd0.93Eu0.07PO4 phosphors without any change in the peak positions of excitation spectra. The position of the CTB mainly depends on co-ordination environment of cations around the anion (O2−), electron affinity of anion, co-ordination number, size and charge of the cation.33 Hence, this red shift might be reasoned to change in co-ordination environment around the O2− ion with co-doping concentration.
Fig. S4 (ESI†) represents the Photoluminescence emission spectra for Gd0.93Eu0.07PO4 (λex = 394 nm) phosphors synthesized at 650 °C, 750 °C, 850 °C and 950 °C for 12 h. Upon excitation at 394 nm, the intense emission peaks appear between 585 to 600 nm, with maximum emission at 594 nm corresponding to magnetic-dipole transition (5D0 → 7F1); the weak broad emission bands between 605 and 625 nm correspond to the electric dipole transition (5D0 → 7F1). Other emission bands at 580, 651 and 685 to 705 nm result from the 5D0 → 7F0, 5D0 → 7F3, 5D0 → 7F4 transitions of Eu3+ activator ions. Generally, the electric–dipole transition is dependent on the host environment and the magnetic dipole transition is independent of the host environment.
From the emission spectrum it is evident that the magnetic-dipole transition (5D0 → 7F1) is dominant than that of the electric–dipole transition (5D0 → 7F2), signifying that the Eu3+ ions are in the inversion site symmetry.33,34 These PL emission results show that the PL emission intensity increases with the increase in calcination temperature. This effect can be explained as follows: as the temperature increases from 650–950 °C, the extent of monoclinic Gd0.93Eu0.07PO4 phosphor phase increases from cubic Gd2O3 phase. At 950 °C, monophasic Gd0.93Eu0.07PO4 is obtained (Fig. S1, ESI†), and hence, same optimized results are reflected in PL emission studies.
The photo-luminescent emission spectra of Gd0.93−xEu0.07CaxPO4 (0.0 ≤ y ≤ 0.07) phosphors, prepared at 950 °C for 12 h, were recorded at 394, 248, 361 and 464 nm excited wavelengths, shown in Fig. 6 and Fig. S5–S7 (ESI†), respectively. The emission features are similar to the earlier spectra (Fig. S4, ESI†), except for the magnitude of intensities for Gd0.93−xEu0.07CaxPO4 phosphors. Fig. S8 (ESI†) shows variation of the emission intensity of 5D0 → 7F1 peak as a function of Ca2+ concentration at different excitation wavelengths. It is worth noting that upon excitation, the emission intensities increase with increasing Ca2+ doping concentration from 1 to 7 mol% at all four excitation wavelengths. But λex = 394 nm showed highest luminescent emission intensity for 5D0 → 7F1 transition compared to other excitation wavelengths (248, 361 and 464 nm). Hence, PL emission spectra recorded with 394 nm excitation wavelength were used to investigate the other photo-luminescent and radiative properties. The emission intensity of Ca2+ co-doped phosphors was found to be enhanced 1.5 times compared to that of its parent without affecting the positions of the emission peaks.
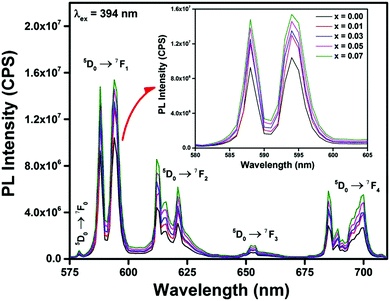 | ||
| Fig. 6 Photoluminescence emission spectra of Gd0.93−xEu0.07CaxPO4 phosphor prepared at 950 °C for 12 h and enlarged view of 5D0 → 7F1 peak (inset). | ||
This enhancement of PL emission intensity on Ca2+ co-doping may be reasoned the following way. An increment in energy transfer from O2− ions to Eu3+ ions was noticed in PL excitation spectrum (Fig. S3, ESI†) when Ca2+ ions are introduced in Eu3+ activated GdPO4 matrix. The charge to radius ratio of nine co-ordinated Ca2+ ions (Pauling's electronegativity for Ca2+ = 1.00 and effective ionic radii Ca2+ = 1.180 Å) is less than that of nine co-ordinated Gd3+ ions (electronegativity for Gd3+ = 1.20 and effective ionic radii for Gd3+ = 1.107 Å) of host, and this mismatch35 creates the constricted binding between O2− and Gd3+/Eu3+, which is expected to be released. Hence, doping of Ca2+ ions modifies the crystal field and reduces the symmetry around the Eu3+ ions in GdPO4 lattice. This, in turn, helps to relax the selection rule and increases the photon transition probability, which facilitates the enhancement of charge transfer process that can be realised in CTB. Conversely, the enhancement in PL emission intensity was observed.26 Moreover, co-doping of divalent calcium ions in trivalent gadolinium sites creates the charge imbalance or oxygen vacancies. Incorporation of Ca2+ ions at Gd3+ ions site effects the negative charge balance in the lattice and these negative charges can be compensated by oxygen vacancies (VO).36 These oxygen vacancies act as sensitizers and help in efficient energy transfer of absorbed photons to the activator ion.24 Hence, oxygen vacancies also make a small contribution towards PL emission intensity enhancement.
3.5. Luminescence life time measurement
Fig. 7 represents the photo-luminescent decay curves of Gd0.93−xEu0.07CaxPO4 (0.00 ≤ y ≤ 0.07) recorded at room temperature (λex = 394 nm and λem = 594 nm). All the decay curves were fitted well to the second order exponential function, given as follows:It = I1![[thin space (1/6-em)]](https://www.rsc.org/images/entities/char_2009.gif) exp(−t/τ1) + I2 exp(−t/τ1) + I2![[thin space (1/6-em)]](https://www.rsc.org/images/entities/char_2009.gif) exp(−t/τ2) exp(−t/τ2) | (1) |
 | (2) |
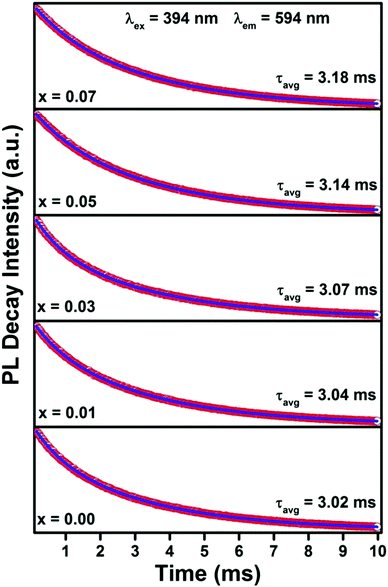 | ||
| Fig. 7 Fluorescence life time decays of Gd0.93−xEu0.07CaxPO4 recorded at λex = 394 nm and λem = 594 nm. | ||
From Fig. 7, it is evident that the decay lifetimes increase as the Ca2+ co-doping increases, and the average decay life times of Gd0.93−xEu0.07CaxPO4 (0.0 ≤ y ≤ 0.07) phosphors increase from 3.02 to 3.18 ms. This enhancement in lifetime may be due to improvement in energy transfer and radiative transitions. Moreover, the enhancement in the lifetime of the 5D0 → 7F1 level of Eu3+ ions again confirms the increase in PL emission intensity with respect to Ca2+ substitution.
3.6. Judd–Ofelt intensity parameters and radiative properties
The Judd–Ofelt (J–O) parameters for Gd0.93−xEu0.07CaxPO4 (0.0 ≤ x ≤ 0.07) phosphors were evaluated by using the emission spectra of these phosphors. The magnetic and electric dipole transition peak intensities are utilized to estimate the magnetic dipole and electric dipole line strengths of Gd0.93−xEu0.07CaxPO4 phosphors. By using estimated values of electric dipole line strengths, J–O intensity parameters Ωλ (λ = 2, 4), radiative transition probability (AR), radiative lifetime τR, non-radiative relaxation rate (WNR), total transition probability (AT), and theoretical photo-luminescence quantum efficiency (η) can be determined using the procedure reported in our earlier study22 and displayed in Table 1. The Ω6 parameter cannot be estimated due to practical restrictions, and also U(6) matrix, corresponding to 5D0 → 7F6 transitions of Eu3+ ions is usually weak and negligible.38 The Ω2 varies with covalency and local structural crystal field changes around the Eu3+ ions, and Ω4 is less sensitive to these factors. Therefore, a lesser value of Ω2 compared to that of Ω4 shows less covalent nature between the Eu3+ and O2− ligands. It was observed that as the concentration of Ca2+ doping increases, Ω2 value also increased owing to the decrease in the local symmetry around Eu3+ ion.39 Additionally, Ω4 value also increased with the increase in the concentration of Ca2+ co-doping, signifying the decrease in electron density of the O2− ligand.| λ ex (nm) | Ca2+ ion conc. (mol%) | J–O intensity parameters (×10−20 cm2) | A R (s−1) | W NR (s−1) | A T (s−1) | τ rad (ms) | η (%) | Asymmetric ratio | |
|---|---|---|---|---|---|---|---|---|---|
| Ω 2 | Ω 4 | ||||||||
| 0.00 | 0.80 | 1.73 | 239.66 | 91.47 | 331.13 | 4.17 | 72.38 | 0.50 | |
| 0.01 | 0.82 | 1.89 | 247.18 | 81.77 | 328.95 | 4.04 | 75.14 | 0.52 | |
| 394 | 0.03 | 0.85 | 1.88 | 247.51 | 78.22 | 325.73 | 4.04 | 75.99 | 0.54 |
| 0.05 | 0.91 | 1.96 | 256.28 | 62.19 | 318.47 | 3.90 | 80.47 | 0.57 | |
| 0.07 | 0.93 | 2.07 | 262.14 | 52.32 | 314.46 | 3.81 | 83.36 | 0.59 | |
The asymmetric ratio (Red/Orange ratio), i.e., ratio of the area under the electric dipole (5D0 → 7F2) transition to the area under the magnetic dipole (5D0 → 7F1) transition for Gd0.93−xEu0.07CaxPO4 phosphors was found to be less than unity (Table 1). These results indicate that Orange emission dominates the red emission in these phosphors. As the Ca2+ co-doping increased, value of asymmetric ratio also increased. This increment in the ratio is due to the increased local distortion or reduced symmetry around Eu3+ ions compared to the non-co-doped one34 and hence, intensity of the PL emission (w.r.t λex = 394 nm) was enhanced (Fig. 8). Table 1 gives the comparison of τexp and η for Gd0.93−xEu0.07CaxPO4 phosphors. Gd0.86Eu0.07Ca0.07PO4 shows the highest η around 83.36% and indicates possible practical utility of phosphor in solid state lighting and other display device applications.
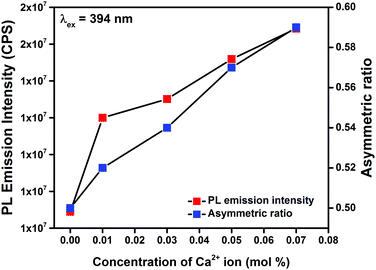 | ||
| Fig. 8 The relation between PL emission intensity and asymmetric ratio in Gd0.93−xEu0.07CaxPO4 phosphors recorded at λex = 394 nm. | ||
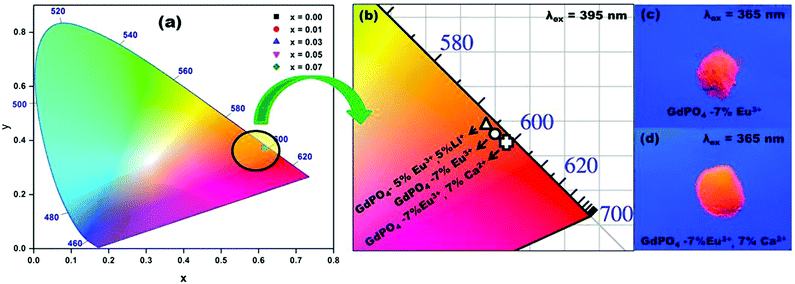
The color emitted by the phosphors can be realized in terms of human eye visualization system mathematically by Commission Internationale de l’eclairage (CIE) coordinates.40 CIE chromaticity coordinates of Gd0.93−xEu0.07CaxPO4 phosphors can be calculated from the PL emission spectra recorded at λex = 394 nm. Fig. 9 illustrates the CIE 1931 chromaticity diagram of Gd0.93−xEu0.07CaxPO4 recorded at λex = 394 nm. The x, y color coordinates of Gd0.93−xEu0.07CaxPO4 phosphors are listed in Table 2. From Fig. 9, it is evident that the color coordinates fall in the orange-red region of the CIE diagram41 and the color emitted by a phosphor varies slightly with the concentration moving towards longer wavelength region.
| Phosphors | CIE 1931 co-ordinates | CCT values (K) | Color purity (%) | |
|---|---|---|---|---|
| x | y | |||
| Gd0.93Eu0.07PO4 | 0.6212 | 0.3782 | 1703 | 98.43 |
| Gd0.92Eu0.07Ca0.01PO4 | 0.6222 | 0.3772 | 1712 | 98.68 |
| Gd0.90Eu0.07Ca 0.03PO4 | 0.6223 | 0.3774 | 1712 | 98.72 |
| Gd0.88Eu0.07Ca 0.05PO4 | 0.6238 | 0.3757 | 1729 | 99.08 |
| Gd0.86Eu0.07Ca 0.07PO4 | 0.6247 | 0.3748 | 1739 | 99.30 |
Correlated color temperature (CCT) is one of the substantial factors to assess the phosphor efficiency. CCT is calculated by converting the (x, y) coordinates of the light source to (u′, v′).22 By McCamy's approximation,42 the CCT value can be calculated from x, y co-ordinates. The evaluated CCT values for Gd0.93−xEu0.07CaxPO4 phosphors are in the range of 1704 to 1739 K (Table 2). Generally, CCT values below 5000 K are known to be best for production of warm white light.43,44
The color purity of the phosphors is also one of the significant parameters to evaluate the compatible light source for practical lighting applications. Hence, color purity of these phosphors can be estimated by using the following relation:
 | (3) |
The estimated color purity results are tabulated in Table 2 and show that the color purity of Gd0.93−xEu0.07CaxPO4 phosphors increased monotonically with Ca2+ substitution. Gd0.93−xEu0.07CaxPO4 phosphors showed highest color purity of 99.30%, signifying that this phosphor is a possible candidate for WLEDs and other display device fabrication.
3.7. Temperature dependent photo-luminescent properties
Fig. 10(a) shows the temperature-dependent PL emission spectra of GdPO4:Eu3+ (7 mol%) phosphors, measured in the temperature range of 303–533 K (λex = 394 nm). These spectra clearly indicate a decrease in the emission intensity of GdPO4:Eu3+ (7 mol%) phosphors by increasing the temperature because of the thermal quenching effect. The normalized PL emission intensity of GdPO4:Eu3+ (7 mol%) phosphors as a function of temperature is shown in Fig. 10 (b). The PL intensity at 423 K is about 66% of the initial value at 303 K, indicating that GdPO4:Eu3+ (7 mol%) phosphors possess excellent thermal stability and could serve as suitable candidates for high-power LEDs. The activation energy for the thermal quenching can be found using the following relation: | (4) |
4. Conclusions
Series of orange light emitting Eu3+/Ca2+ co-doped GdPO4 phosphors were prepared by conventional solid state route. PL studies and Judd–Ofelt parameter calculations confirm that Eu3+/Ca2+ co-doped GdPO4 phosphors exhibit enhanced PL emission and radiative properties. This enhancement of PL emission can be attributed to the size and electronegativity mismatch between the co-dopant and the host cation. CIE 1931 coordinates (0.6247, 0.3748) of 7 mol% Ca2+ co-doped phosphor shows highest color hue in the orange red region. Lower CCT (1739 K), excellent thermal stability and high color purity values promote the candidateship of this phosphor for practical application in fabrication of house hold WLEDs and other display devices.Conflicts of interest
There are no conflicts to declare.Acknowledgements
The authors acknowledge the chemical science division, Indian Institute of Science for providing the Time resolved fluorescence spectrometer and High resolution TEM facilities. One of the authors, Pramod Halappa, is thankful to Council of Scientific and Industrial Research (CSIR), New Delhi, India for providing CSIR SRF.Notes and references
- X. Huang, H. Guo and B. Li, J. Alloys Compd., 2017, 720, 29–38 CrossRef CAS.
- P. Du, X. Huang and J. S. Yu, Chem. Eng. J., 2018, 337, 91–100 CrossRef CAS.
- Z. Xu, Z. Xia, B. Lei and Q. Liu, J. Mater. Chem. C, 2016, 4, 9711–9716 RSC.
- P. Halappa and C. Shivakumara, in Trends and Applications in Advanced Polymeric Materials, ed. S. K. Nayak, S. Mohanty and L. Unnikrishnan, Scrivener Publishing LLC, USA, 2017, ch. 9, 163–189 Search PubMed.
- D. Deng, H. Yu, Y. Li, Y. Hua, G. Jia, S. Zhao, H. Wang, L. Huang, Y. Li, C. Li and S. Xu, J. Mater. Chem. C, 2013, 1, 3194–3199 RSC.
- W. B. Im, Y.-I. Kim, N. N. Fellows, H. Masui, G. A. Hirata, S. P. DenBaars and R. Seshadri, Appl. Phys. Lett., 2008, 93, 091905 CrossRef.
- Z. Jiang and Y. Wang, Electrochem. Solid-State Lett., 2010, 13, J68–J70 CrossRef CAS.
- H. Daicho, T. Iwasaki, K. Enomoto, Y. Sasaki, Y. Maeno, Y. Shinomiya, S. Aoyagi, E. Nishibori, M. Sakata, H. Sawa, S. Matsuishi and H. Hosono, Nat. Commun., 2012, 3, 1132 CrossRef.
- J. Y. Han, W. B. Im, G.-y. Lee and D. Y. Jeon, J. Mater. Chem., 2012, 22, 8793–8798 RSC.
- S. Lee and S. Y. Seo, J. Electrochem. Soc., 2002, 149, J85–J88 CrossRef CAS.
- Y. Jin, M.-H. Fang, M. Grinberg, S. Mahlik, T. Lesniewski, M. G. Brik, G.-Y. Luo, J. G. Lin and R.-S. Liu, ACS Appl. Mater. Interfaces, 2016, 8, 11194–11203 CrossRef CAS PubMed.
- J. Ruan, R.-J. Xie, N. Hirosaki and T. Takeda, J. Am. Ceram. Soc., 2011, 94, 536–542 CrossRef CAS.
- T. Hussain, L. Zhong, M. Danesh, H. Ye, Z. Liang, D. Xiao, C.-W. Qiu, C. Lou, L. Chi and L. Jiang, Nanoscale, 2015, 7, 10350–10356 RSC.
- A. Mathur, P. Halappa and C. Shivakumara, J. Mater. Sci.: Mater. Electron., 2018, 29, 19951–19964 CrossRef CAS.
- E. Pavitra, G. S. R. Raju, Y. H. Ko and J. S. Yu, Phys. Chem. Chem. Phys., 2012, 14, 11296–11307 RSC.
- A. Katelnikovas, J. Plewa, S. Sakirzanovas, D. Dutczak, D. Enseling, F. Baur, H. Winkler, A. Kareiva and T. Jüstel, J. Mater. Chem., 2012, 22, 22126–22134 RSC.
- B. Li, X. Huang, H. Guo and Y. Zeng, Dyes Pigm., 2018, 150, 67–72 CrossRef CAS.
- X. Huang, B. Li, H. Guo and D. Chen, Dyes Pigm., 2017, 143, 86–94 CrossRef CAS.
- X. Shen, L. Li, F. He, X. Meng and F. Song, Mater. Chem. Phys., 2012, 132, 471–475 CrossRef CAS.
- L. Zhang, M. Yin, H. You, M. Yang, Y. Song and Y. Huang, Inorg. Chem., 2011, 50, 10608–10613 CrossRef CAS.
- J. Cho and C. H. Kim, RSC Adv., 2014, 4, 31385–31392 RSC.
- P. Halappa, A. Mathur, M.-H. Delville and C. Shivakumara, J. Alloys Compd., 2018, 740, 1086–1098 CrossRef CAS.
- X. Liu, K. Han, M. Gu, L. Xiao, C. Ni, S. Huang and B. Liu, Solid State Commun., 2007, 142, 680–684 CrossRef CAS.
- S.-s. Yi, J. S. Bae, K. S. Shim, J. H. Jeong, J.-C. Park and P. H. Holloway, Appl. Phys. Lett., 2004, 84, 353–355 CrossRef CAS.
- L. S. Chi, R. S. Liu and B. J. Lee, J. Electrochem. Soc., 2005, 152, J93–J98 CrossRef CAS.
- K. E. Waldrip, J. S. Lewis, Q. Zhai, M. Puga-Lambers, M. R. Davidson, P. H. Holloway and S.-S. Sun, J. Appl. Phys., 2001, 89, 1664–1670 CrossRef CAS.
- T. V. Gavrilović, D. J. Jovanović, L. V. Trandafilović and M. D. Dramićanin, Opt. Mater., 2015, 45, 76–81 CrossRef.
- R. S. Yadav, R. V. Yadav, A. Bahadur and S. B. Rai, RSC Adv., 2016, 6, 51768–51776 RSC.
- P. Halappa, S. Thilak Raj, R. Sairani, S. Joshi, R. Madhusudhana and C. Shivakumara, Int. J. Nanotechnol., 2017, 14, 833–844 CrossRef CAS.
- E. N. Silva, A. P. Ayala, I. Guedes, C. W. A. Paschoal, R. L. Moreira, C. K. Loong and L. A. Boatner, Opt. Mater., 2006, 29, 224–230 CrossRef CAS.
- N. Clavier, A. Mesbah, S. Szenknect and N. Dacheux, Spectrochim. Acta, Part A, 2018, 205, 85–94 CrossRef CAS PubMed.
- G. S. R. Raju, E. Pavitra and J. S. Yu, Dalton Trans., 2013, 42, 11400–11410 RSC.
- P. Ghosh, S. Sadhu and A. Patra, Phys. Chem. Chem. Phys., 2006, 8, 3342–3348 RSC.
- M. A. Hassairi, A. Garrido Hernández, T. Kallel, M. Dammak, D. Zambon, G. Chadeyron, A. Potdevin, D. Boyer and R. Mahiou, J. Lumin., 2016, 170, 200–206 CrossRef CAS.
- P. Kumari and J. Manam, Spectrochim. Acta, Part A, 2016, 152, 109–118 CrossRef CAS PubMed.
- A. K. Dubey, P. Singh, S. Singh, D. Kumar and O. Parkash, J. Alloys Compd., 2011, 509, 3899–3906 CrossRef CAS.
- R. S. Ningthoujam, V. Sudarsan, S. V. Godbole, L. Kienle, S. K. Kulshreshtha and A. K. Tyagi, Appl. Phys. Lett., 2007, 90, 173113 CrossRef.
- C. A. Kodaira, H. F. Brito, O. L. Malta and O. A. Serra, J. Lumin., 2003, 101, 11–21 CrossRef CAS.
- R. G. A. Kumar, S. Hata and K. G. Gopchandran, Ceram. Int., 2013, 39, 9125–9136 CrossRef CAS.
- C. Shivakumara, R. Saraf and P. Halappa, Dyes Pigm., 2016, 126, 154–164 CrossRef CAS.
- P. Halappa, C. Shivakumara, R. Sarafa and H. Nagabhushana, AIP Conf. Proc., 2016, 1731, 140064 CrossRef.
- C. S. McCamy, Color Res. Appl., 1992, 17, 142–144 CrossRef.
- For specific color index, http://www.hunterlab.com/appnotes/an05_05.pdf for specific color index.
- B. Devakumar, P. Halappa and C. Shivakumara, Dyes Pigm., 2017, 137, 244–255 CrossRef CAS.
- S. Som, A. K. Kunti, V. Kumar, V. Kumar, S. Dutta, M. Chowdhury, S. K. Sharma, J. J. Terblans and H. C. Swart, J. Appl. Phys., 2014, 115, 193101 CrossRef.
- J.-C. Chang, C.-T. Chen, M. Rudysh, M. G. Brik, M. Piasecki and W.-R. Liu, J. Lumin., 2018, 206, 417–425 CrossRef.
- C. C. Lin, Y. S. Tang, S. F. Hu and R. S. Liu, J. Lumin., 2009, 129, 1682–1684 CrossRef CAS.
- P. Du and J. S. Yu, Luminescence, 2017, 32, 1504–1510 CrossRef CAS.
- Q. Guo, C. Zhao, L. Liao, S. Lis, H. Liu, L. Mei and Z. Jiang, J. Am. Ceram. Soc., 2017, 100, 2221–2231 CrossRef CAS.
- L. Mei, H. Liu, L. Liao, Y. Zhang and R. V. Kumar, Sci. Rep., 2017, 7, 15171 CrossRef.
Footnote |
| † Electronic supplementary information (ESI) available. See DOI: 10.1039/c8nj04372h |
| This journal is © The Royal Society of Chemistry and the Centre National de la Recherche Scientifique 2019 |

