LSPR effects in a magnetic–luminescent heterostructure for efficient enhanced luminescence performance
Hongxia
Peng
 *ab,
Yi
He
a,
Xiuying
Tian
a,
Jin
Wen
*a and
Lei
Zhang
a
aHunan Provincial Key Laboratory of Fine Ceramics and Powder Materials, School of Materials and Environmental Engineering, Hunan University of Humanities, Science and Technology, Loudi Hunan 417000, China. E-mail: Penghongxia1@126.com; Fax: +86-1897511023; Tel: +86-1897511023
bSchool of Materials Science and Engineering, Central South University, Changsha, Hunan 410083, P. R. China
First published on 6th November 2018
Abstract
The major challenges faced by magnetic–luminescent bi-functional nanoparticles include poor luminescence intensity and severe magnetic–luminescence quenching. Introduction of an intermediate layer with localized surface plasmon resonance (LSPR) effects in magnetic–luminescent bi-functional nanoparticles plays a major role in solving these challenges. Herein, a fascinating process of plasmonic energy conversion in Fe3O4@WO3@GdF3:Eu3+ heterostructures, which can enhance the luminescence by LSPR effects of WO3, is demonstrated. It is proposed that the LSPR of WO3 is the primary reason for the enhanced luminescence of Fe3O4@GdF3:Eu3+. Moreover, saturation magnetization did not significantly decline on introducing WO3 with LSPR effect. This research conclusion can solve the problems faced by magnetic–luminescent bimodal imaging materials and promote the application of this type of composite materials in tumor therapy and optical confocal microscopy technology.
1. Introduction
In recent years, researchers have found that magnetic–luminescent bi-functional nanoparticles can provide high-resolution, high-contrast images for precision medicine, and are crucial for imaging applications.1–3 Among them, the design and synthesis of Fe3O4@REL (Rare Earth Luminescence) magnetic–luminescent bi-functional nanoparticles has become the focus of current research.4–8 For example, a literature9 report has described magnetic resonance and photo-thermal bimodal imaging materials based on Fe3O4@NaYF4:Yb,Er nanoparticles. Fe3O4@NaYF4:Yb,Tm nanoparticle composite has been used as a three-mode imaging agent for magnetic resonance, fluorescence, positron emission tomography and single photon emission computed tomography.10 Although the research on magnetic–luminescent bi-functional Fe3O4@REL nanoparticles has made some progress, there is still a problem of weak luminescence intensity, which limits its further application.Motivated by this situation, extensive efforts have been made to enhance the emission intensity, such as modulating host materials and dopant concentrations, coating protective shells and coupling with noble metals. Unfortunately, the magnetic core and the luminescent shell layer are still in direct contact, the magneto-optical quenching effect is difficult to avoid and the actual enhancement effect of the luminescence intensity is not significant. In addition, the target position of the doped element (Gd3+,11 Mn2+![[thin space (1/6-em)]](https://www.rsc.org/images/entities/char_2009.gif) 12 and Li+
12 and Li+![[thin space (1/6-em)]](https://www.rsc.org/images/entities/char_2009.gif) 13) is difficult to control. Inert intermediate barrier materials (such as SiO2,14 C15 and PMMA16) were introduced into the Fe3O4@REL magnetic–luminescent bi-functional nanocomposites to prevent the direct contact between the magnetic core and the luminescent shell, so that the magneto-optical quenching effect was reduced and the luminescence intensity of the nanoparticles was enhanced to a certain extent. However, the enhancement effect of luminescence intensity is limited because the inert isolation layer lacks chemical activity, and it is difficult to meet the application requirements of clinical medicine.
13) is difficult to control. Inert intermediate barrier materials (such as SiO2,14 C15 and PMMA16) were introduced into the Fe3O4@REL magnetic–luminescent bi-functional nanocomposites to prevent the direct contact between the magnetic core and the luminescent shell, so that the magneto-optical quenching effect was reduced and the luminescence intensity of the nanoparticles was enhanced to a certain extent. However, the enhancement effect of luminescence intensity is limited because the inert isolation layer lacks chemical activity, and it is difficult to meet the application requirements of clinical medicine.
By introducing protective shells such as noble metals (Ag/Au), luminescence can be enhanced due to localized surface plasmon resonance (LSPR).17 However, as the common surface plasma materials, the precious metals (such as Au and Ag) are limited due to the energy band structure of the metal itself, and the high carrier concentration. The regulation of the LSPR peak can only be realized by changing the morphology of the metal nanoparticles, and hence, the practical application of metal nanoparticles is difficult.18 Limited precious metal resources and high price limits its application in clinical medicine, and hardly satisfies biological applications.
Recently, some researches have reported that the LSPR phenomena can also occur on various nonmetal nanostructures of heavily doped nonstoichiometric semiconductors, such as Cu2−xS, WO3−x, and MoO3−x.19–21 LSPR band and intensity of semiconductors can be easily controlled via adjusting the stoichiometric ratios, vacancy, or dopant concentrations, as well as phase structures.22 Among the plasmonic semiconductor nanostructures, tungsten oxide nanoparticles (WO3), made via a facile solvothermal method, possess an intense LSPR band across the visible and NIR regions due to abundant oxygen vacancies on their surface.23 Such a broad plasmonic absorption of WO3 offers a unique opportunity to gain deeper understanding on the influence of LSPR on the photon absorption and emission processes of the luminescent nanoparticles within the same plasmonic nanostructure.
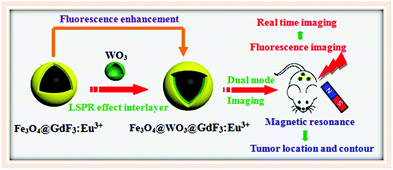
For the first time, we demonstrate the nonmetallic plasmon induced enhancement of luminescence in a core–shell structure consisting of Fe3O4 as the core, GdF3:Eu3+ as the luminescence layer and WO3 as the plasmonic layer. Compared with Fe3O4@GdF3:Eu3+, Fe3O4@WO3@GdF3:Eu3+ exhibits enhancement on the emission originating from the 5D0–7F1/7F2 transition of Eu3+ ions. We propose that this enhancement of luminescence is caused via LSPR-induced plasmonic energy conversion. In this process, WO3 converts the NIR energy of incident photons into LSPR oscillation energy that subsequently transfers to the adjacent GdF3:Eu3+, thus substantially enhancing the luminescence intensity based on the plasmon-enhanced localized electric fields and the photo-thermally improved electron population (Fig. 1). This finding provides new ideas for the emission intensity of magnetic–luminescent bifunctional nanocomposites to be further enhanced through the LSPR effect.
2. Experimental section
2.1 Chemicals and materials
Rare earth oxides (Gd2O3, Eu2O3 99.99%) were purchased from Science and Technology Parent Company of Changchun Institute of Applied Chemistry. Ferric chloride hexahydrate (purity ≥ 99.0%, FeCl3·6H2O), sodium acetate (purity ≥ 99.0%, CH3COONa), ethylene glycol (purity 96.0%, EG), and poly(ethylene glycol) (PEG Mw = 20![[thin space (1/6-em)]](https://www.rsc.org/images/entities/char_2009.gif) 000) were purchased from Beijing Chemical Reagent Limited China. Sodium tungstate dihydrate (Na2WO3·2H2O, purity 99%) was purchased from Tianjin Kemiou Chemical Reagent Co. Ltd (Tianjin, China). Hexadecyltrimethyl ammonium bromide (C19H42BrN, CTAB, purity 99%), sodium hydroxide (NaOH, purity 99%), concentrated hydrochloric acid (HCl, 38%), and ammonium hydroxide (NH3·H2O, AR) were purchased from Kaixin Chemical Reagent Co. Ltd (Hunan, China). Ammonium fluoride (NH4F) was purchased from Beijing Chemical Works. All the above chemical reagents were of analytical grade and used without further purification. Rare earth salts (Gd(NO3)3, Eu(NO3)3) were prepared by dissolving the corresponding rare earth oxides (Gd2O3, Eu2O3, 99.99%) in nitric acid and evaporating their solutions.
000) were purchased from Beijing Chemical Reagent Limited China. Sodium tungstate dihydrate (Na2WO3·2H2O, purity 99%) was purchased from Tianjin Kemiou Chemical Reagent Co. Ltd (Tianjin, China). Hexadecyltrimethyl ammonium bromide (C19H42BrN, CTAB, purity 99%), sodium hydroxide (NaOH, purity 99%), concentrated hydrochloric acid (HCl, 38%), and ammonium hydroxide (NH3·H2O, AR) were purchased from Kaixin Chemical Reagent Co. Ltd (Hunan, China). Ammonium fluoride (NH4F) was purchased from Beijing Chemical Works. All the above chemical reagents were of analytical grade and used without further purification. Rare earth salts (Gd(NO3)3, Eu(NO3)3) were prepared by dissolving the corresponding rare earth oxides (Gd2O3, Eu2O3, 99.99%) in nitric acid and evaporating their solutions.
2.2 Characterization
X-ray diffraction (XRD) patterns of the samples were measured using an AXS D8 Advance diffractometer (Bruker, Bremen, Germany) with Cu Kα radiation (λ = 0.15406 nm) at 40 kV and 40 mA. Scanning electronic microscopy (SEM) images were recorded on a Hitachi S-4800 microscope. The morphologies and structures of the as-prepared samples were inspected using a JEM 2010 transmission electron microscope (TEM). The photoluminescence (PL) excitation and emission spectra were recorded on a Hitachi F-4500 spectrofluorimeter equipped with a 150 W xenon lamp as the excitation source. Magnetization measurements were performed on an MPMSSQUID XL superconducting quantum interference device (SQUID) magnetometer at 300 K. Absorbance by treated cells in the MTT assay was measured using an RT-6000 microplate reader (Rayto, USA).2.3 Synthesis of the Fe3O4@WO3 core–shell structured nanocomposites
Magnetic Fe3O4 nanoparticles were prepared by the solvothermal method.24 WO3 was layered on the surface of the magnetic Fe3O4 nanoparticles using a direct precipitation method. In a typical procedure, 0.1 g of the as-prepared Fe3O4 nanoparticles was dispersed in 75 mL of CTAB (0.364 g) solution. The mixture was sonicated for 15 min, followed by the addition of 50 mL of Na2WO3·2H2O (3.3 g) solution. Then, hydrochloric acid and ammonia solution were added with constant stirring to adjust the pH value to 9, followed by stirring for 4 h at room temperature. The resulting products were separated with a magnet, thoroughly washed several times with ethanol and deionized water, and dried at 60 °C overnight. The dried particles were then calcinated for 2 h at 300 °C. The resulting products were the Fe3O4@WO3 core–shell structured nanoparticles.2.4 Synthesis of the Fe3O4@WO3@GdF3:Eu3+ core–shell-structured nanoparticles
GdF3:Eu3+ luminescent shell was coated on Fe3O4@WO3 nanoparticles by a direct precipitation method. In a typical procedure, 0.1 g of the as-prepared Fe3O4@WO3 nanoparticles were dispersed in 3.2 mL of Gd(NO3)3 and 1.2 mL of Eu(NO3)3 solutions. The mixture was sonicated for 20 min, followed by the addition of 10 mL of 0.6 mol L−1 NH4F solution and then, this mixture was heated to 75 °C under vigorous mechanical stirring. After 2 h, the resultant products were separated with a magnet, thoroughly washed with ethanol and deionized water several times, and further dried at 60 °C overnight. Finally, Fe3O4@WO3@GdF3:Eu3+ nanocomposites were obtained.2.5 MTT assays
To test the cytotoxicity of Fe3O4@WO3@GdF3:Eu3+ nanoparticles, we performed an MTT assay using MCF-7 cells, which are common representative cancer cells.14 MCF-7 cells were cultured in 96-well microtiter plates and incubated at 37 °C in a 5% CO2 atmosphere for 24 h. MCF-7 cells were incubated with culture medium containing Fe3O4@WO3@GdF3:Eu3+ (0, 0.5, 1, 5, 10, and 15 mg mL−1) for 24 h. Next, we added 100 μL of MTT solution (0.5 mg mL−1) to each well. After 4 h, the remaining MTT solution was removed, and 150 μL of dimethyl sulfoxide was added to each well to dissolve the formazan crystals. Absorbance was measured at 490 nm with the RT 6000 microplate reader. The % cell viability was determined as follows:| % cell viability = (absorbance of treated cells)/(absorbance of control) × 100. |
The experiments were conducted in triplicate and data were represented as mean ± standard deviation.
3. Results and discussion
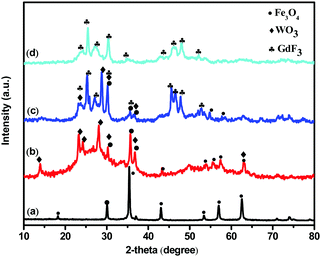
To clarify the influence of WO3 LSPR on the luminescent behavior of magnetic–luminescent bi-functional nanocomposites, a Fe3O4@WO3@GdF3:Eu3+ heterostructure nanoparticle was designed. First, hydroxyl-functional magnetic Fe3O4 hydrophilic nanoparticles as the core were synthesized by a solvothermal method. Then, the as-prepared cores were used as seeds to fabricate core–spacer nanoparticles of Fe3O4@WO3via homogeneous coating. Following this, CTAB on the surface of core–spacer nanoparticles of Fe3O4@WO3 was washed off using a faintly acidic solution to realize the modulation of surface chemical ligands. To introduce nanocrystalline GdF3:Eu3+ core–spacer, the nanoparticles of Fe3O4@WO3 were functionalized with amino groups (–NH2) by adding CTAB, which has the ability to concentrate Gd3+ on the Fe3O4@WO3 surface. Then, the GdF3 shell was fabricated on the Fe3O4@WO3 surface by adding NH4F under the help of CTAB, which acts as a dispersant in aqueous solution.The X-ray diffraction (XRD) pattern of the Fe3O4@WO3@GdF3:Eu3+ nanoparticles shows three sets of characteristic peaks, belonging to cubic spinel Fe3O4, hexagonal WO3, and orthorhombic GdF3, respectively (Fig. 2). Scanning electron microscopic (SEM) images display pure Fe3O4 (Fig. 3a) with a mean particle size of 150 nm and a rough surface. After surface modification by adding the WO3 shell, the Fe3O4@WO3 nanoparticles retained their spherical morphology with a lack of aggregation and smoother and very dense surface (Fig. 3b).
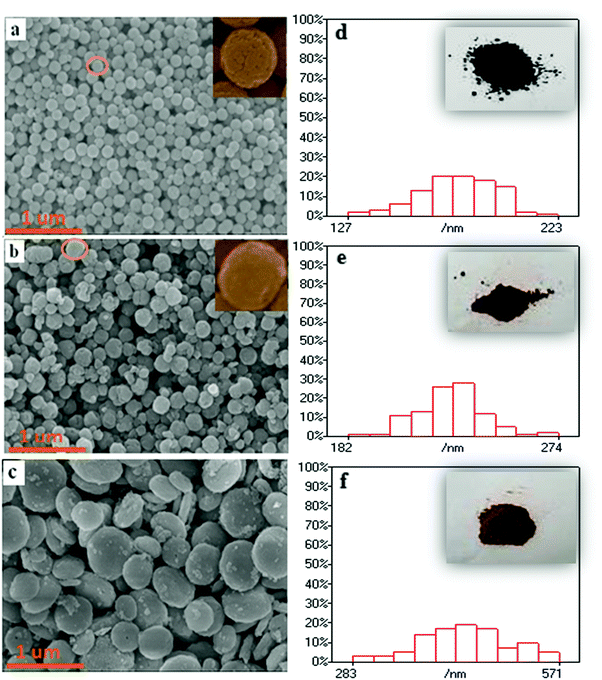 | ||
| Fig. 3 SEM images and the scale bar of Fe3O4 (a and d); Fe3O4@WO3 (b and e); Fe3O4@WO3@GdF3:Eu3+ (c and f) (insets: photographs of Fe3O4, Fe3O4@WO3, and Fe3O4@WO3@GdF3:Eu3+ powders). | ||
Compared with Fe3O4, the particle size of Fe3O4@WO3 increased significantly and was about 250 nm. As shown in the insets of Fig. 3(d–f), the color of Fe3O4@WO3 powder is lighter than that of Fe3O4 powder. These results suggested that the WO3 spacer layer was uniformly deposited on the Fe3O4 nanoparticles. After surface modification by adding the GdF3:Eu3+ shell layer, the Fe3O4@WO3@GdF3:Eu3+ nanoparticles retained their spherical morphology with a lack of aggregation and a rough surface (Fig. 3(c)). The color of the Fe3O4@WO3@GdF3:Eu3+ nanoparticles became lighter. Compared with Fe3O4@WO3, the particle size of Fe3O4@WO3@GdF3:Eu3+ increased significantly and was about 400 nm. These results suggested that the GdF3:Eu3+ phosphor layer was uniformly deposited on the Fe3O4@WO3 nanoparticles. The analysis results of XRD, SEM, and photographs of the powders proved that Fe3O4@WO3@GdF3:Eu3+ nanoparticles were successfully produced.
TEM images of the Fe3O4@WO3@GdF3:Eu3+ nanoparticles are shown in Fig. 4(a and b). TEM observations revealed that the as-prepared Fe3O4@WO3@GdF3:Eu3+ nanoparticles appear spherical. The core–shell structure could be clearly distinguished because of the different color contrast between the cores and shells. The average diameter of the Fe3O4@WO3@GdF3:Eu3+ nanoparticles was about 400 nm, and the shell showed a gray color. Moreover, the distinct lattice fringes in the high-resolution TEM image (Fig. 4i) confirmed the successful crystallization of GdF3 and WO3 on the surface of Fe3O4, which was in good agreement with the wide-angle XRD results (Fig. 1). The spacing in the shell region was about 0.3800 nm and 0.1487 nm, for the (002) and (420) planes of WO3 and GdF3, respectively, versus about 0.2518 nm in the core region, corresponding to the (311) plane of Fe3O4. To further identify the structure of the Fe3O4@WO3@GdF3:Eu3+ nanocomposites, the corresponding EDX mapping of Fe3O4@WO3@GdF3:Eu3+ sample was recorded to analyze the elements, as shown in Fig. 4(c–h). Fig. 4(c–h) represent the mapping of Fe, O, W, Gd, F and Eu elements, respectively. It can be seen that all the elements are distributed homogeneously in the sample. The selected-area electron diffraction (SAED, the inset of Fig. 4i) reveals the polycrystalline feature of the as-prepared product. From EDX mapping and TEM, we further confirmed the formation of Fe3O4@WO3@GdF3:Eu3+ nanocomposites.
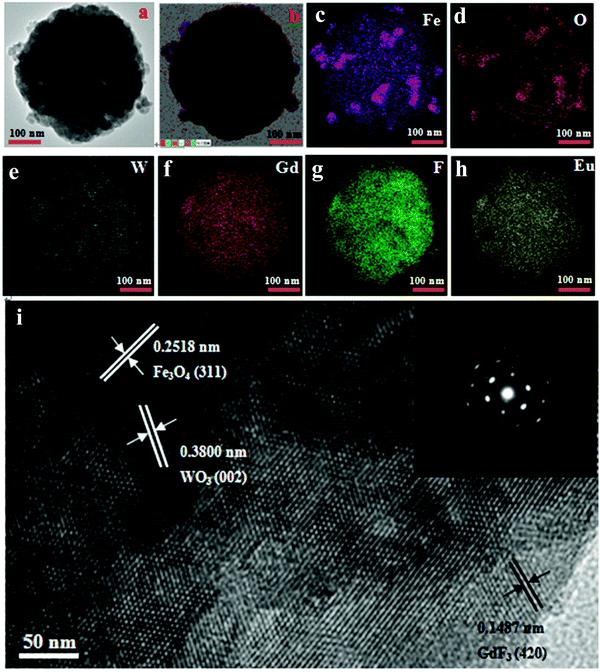 | ||
| Fig. 4 (a and b) TEM images of Fe3O4@WO3@GdF3:Eu3+ nanocomposites and high magnification (i); (c–h) energy dispersive X-ray (EDX) mapping of Fe3O4@WO3@GdF3:Eu3+ nanocomposites. | ||
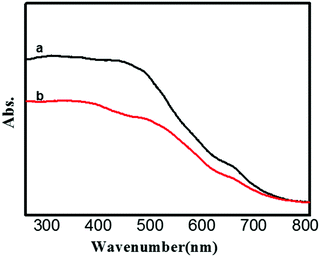
Fig. 5 presents the comparison UV-vis absorption spectra of the Fe3O4@WO3 and Fe3O4@WO3@GdF3:Eu3+. The UV-vis absorption spectra of plasmonic Fe3O4@WO3 and Fe3O4@WO3@GdF3:Eu3+ nanoparticles exhibit distinct absorption bands located at around 691 nm and 700 nm, respectively. These observations are in accordance with the intrinsic optical property of WO3 reported in the literature,23 originating from intense LSPR absorption of the WO3. The LSPR of WO3 can be maintained for at least three months at room temperature and atmospheric pressure, even though this property originates from the oxygen vacancies.
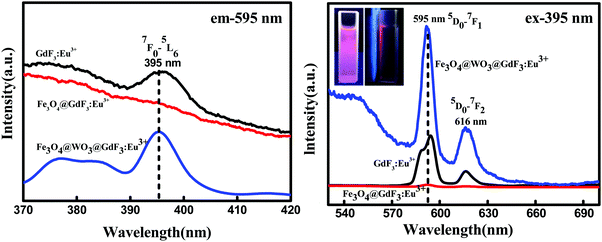
To investigate the luminescence properties of the nanoparticles, we recorded these spectra at room temperature. In the excitation spectra (Fig. 6), which were monitored with the emission of Eu3+ at an excitation wavelength of 595 nm, we observed a strong excitation peak at 395 nm that can be assigned to the energy level transition of 7F0 → 5L6 of Eu3+. In the emission spectra (Fig. 6) obtained by excitation at 395 nm, the strongest emission (at 595 nm) was due to the 5D0 → 7F1 forced electric dipole transition, and the other emission bands observed at 616 nm were due to 5D0 → 7F2 transition. Additionally, as shown in Fig. 6, we can see the increase in intensity for Fe3O4@WO3@GdF3:Eu3+, which may be due to the following reasons: first, the shielding effect of the homogeneously coated WO3 spacer prevents the direct contact between magnetic materials and luminescent materials, and thus effectively reduces the quenching effect of magnetic–luminescence. In addition, when there is external light radiation, the WO3 spacer layer produces the plasma resonance,21,22 so that the electromagnetic field of WO3 is redistributed. The surface plasma resonance of WO3 is represented by the absorption of ultraviolet visible light.23 Notably, the Fe3O4@WO3@GdF3:Eu3+ nanoparticles still displayed an intense LSPR absorption band at 400–700 nm (Fig. 5). Upon 395 nm excitation, WO3 serves as the “plasmonic antenna” to locally concentrate the UV energy near the WO3 spacer layer, and then resonantly transfers this energy to the adjoining GdF3:Eu3+ nanoparticles (Fig. 6).24 Therefore, the GdF3:Eu3+ near the Fe3O4@WO3@GdF3:Eu3+ interface would experience a far more intense excitation electric field based on the surface enhancement effect, which could promote electron population on the excited-state energy levels of Eu3+ ions, thus resulting in enhanced luminescence.24 Moreover, the LSPR-enhanced localized electric field can interact with the emission electric field of GdF3:Eu3+ and enhance the emission electric field of WO3 and GdF3:Eu3+ interface.24 From all the above discussions, we have faith in speculating that the enhancement in luminescence intensity obtained in our study comes from the shielding effect of the homogeneously coated WO3 spacer. LSPR of WO3 shell also greatly contributes to the enhancement mechanisms owing to local electric field amplification. The quantum yield of Fe3O4@GdF3:Eu3+ and Fe3O4@WO3@GdF3:Eu3+ was also measured, which was 0.23 and 1.36, respectively. This further proves that the luminescence intensity of Fe3O4@GdF3:Eu3+ is enhanced by WO3. In addition, luminescence was also demonstrated by the photos taken by a digital camera with and without an external magnetic field. Fig. 6 (inset) shows the corresponding luminescence photos of the solutions before applying magnetic field (left) and in the presence of a magnet (right), confirming the photoluminescence upon irradiation by light (395 nm). From these results it can be concluded that the Fe3O4@WO3@GdF3:Eu3+ nanocomposites exhibit visible light emission that can be used for fluorescent imaging of cells and tissues.
Magnetic measurements showed that pure Fe3O4, Fe3O4@WO3, and Fe3O4@WO3@GdF3:Eu3+ had magnetization saturation values of 71.4, 39.1 and 24.5 emu g−1, respectively (Fig. 7). It is noteworthy that the Fe3O4@WO3@GdF3:Eu3+ retained strong magnetization, indicating its suitability for magnetic targeting and separation as a drug carrier. Saturation magnetization of the Fe3O4@WO3@GdF3:Eu3+ nanocomposites occurred at 24.5 emu g−1, which is smaller than that of the Fe3O4@WO3 nanoparticles. This is likely due to the decreased proportion of Fe3O4 in the nanocomposites. Moreover, the Fe3O4@WO3@GdF3:Eu3+ nanocomposites showed fast response to the external magnet (Fig. 7). When an external magnetic field (magnet) was applied, the magnetic nanoparticles rapidly concentrated on the wall of the bottle on the side of the magnet, and the solution quickly cleared. Compared with Fe3O4 and Fe3O4@WO3 nanoparticles, the magnetic saturation intensity of Fe3O4@WO3@GdF3:Eu3+ nanoparticles was low; hence, within the same time, Fe3O4@WO3@GdF3:Eu3+ nanoparticles slowly concentrated on the wall of the bottle on the side of the magnet, and the solution clarified slowly. The solution of Fe3O4@WO3@GdF3:Eu3+ was brown even after the addition of external magnet. These results indicate that the Fe3O4@WO3@GdF3:Eu3+ nanocomposites possess excellent magnetic responsivity, which is important for their practical application.
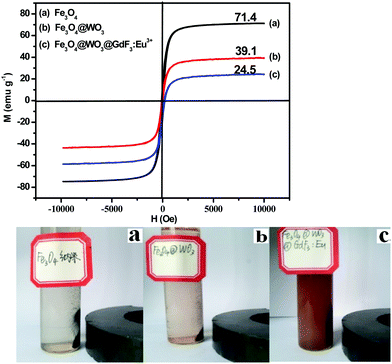 | ||
| Fig. 7 Magnetic hysteresis loops of pure Fe3O4 (a), Fe3O4@WO3 (b), and Fe3O4@WO3@GdF3:Eu3+ (c). Photographs of Fe3O4@WO3@GdF3:Eu3+ nanoparticles dispersed in aqueous solution. | ||
Fig. 8 shows the percentage viability of MCF-7 cells treated with the PEG solvent and Fe3O4@WO3@GdF3:Eu3+ nanoparticles at different concentrations. The viability is 89% up to 15 mg mL−1 concentration. These results indicate that the nanocarrier almost has no cytotoxicity or side effects in living cells (Fig. 8) because Fe3O4, WO3 and GdF3:Eu3+ have good biocompatibility.
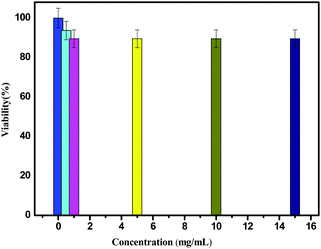 | ||
| Fig. 8 The percentage viability of MCF-7 treated with the Fe3O4@WO3@GdF3:Eu3+ nanoparticles at different concentrations. | ||
4. Conclusions
In summary, we report a facile method for the preparation of core–shell structured Fe3O4@WO3@GdF3:Eu3+ bifunctional nanocomposites. The nanocomposites have high emission intensity and magnetisation saturation value. Compared with Fe3O4@GdF3:Eu3+, the luminescence intensity of Fe3O4@WO3@GdF3:Eu3+ nanocomposites increased significantly. Therefore, the as-prepared Fe3O4@WO3@GdF3:Eu3+ core–shell structured bifunctional nanocomposites can be feasibly applied to simultaneous cell imaging and target drug delivery.Conflicts of interest
There are no conflicts to declare.Acknowledgements
This study was supported by National Natural Science Foundation of China (51704116), Hunan Province Natural Science Foundation of China (2018JJ3252, 2018JJ3250), the Scientific Research Project of Hunan Province Department of Education (16B136) and China Postdoctoral Science Foundation (2017M 612582).References
- G. L. Fu, S. T. Sanjay, M. W. Dou and X. J. Li, Nanoparticle-mediated Photothermal Effect Enables a New Method for Quantitative Biochemical Analysis Using a Thermometer, Nanoscale, 2016, 8(10), 5422–5427 RSC.
- X. Cui, D. Mathe, N. Kovács, I. Horvath and M. Jauregui-Osoro, Synthesis, Characterization and Application of Core–shell Co0.16Fe2.84O4@NaYF4 (Yb, Er) and Fe3O4@NaYF4 (Yb, Tm) Nanoparticle as Tri-modal (MRI, PET/SPECT and Optical) Imaging Agents, Bioconjugate Chem., 2016, 27(2), 319–328 CrossRef CAS PubMed.
- L. Cheng, C. Wang, X. Ma, Q. Wang and Y. Cheng, Multifunctional Upconversion Nanoparticles for Dual-modal Imaging-guided Stem Cell Therapy Under Remote Magnetic Control, Adv. Funct. Mater., 2013, 23(3), 272–280 CrossRef CAS.
- U. Kostiv, V. Patsula, M. Šlouf, I. M. Pongrac, S. Škokić, M. D. Radmilović, I. Pavičić, I. V. Vrček, S. Gajović and D. Horák, Physico-chemical Characteristics, Biocompatibility, and MRI Applicability of Novel Monodisperse PEG-modified Magnetic Fe3O4 & SiO2 Core–shell Nanoparticles, RSC Adv., 2017, 7, 8786–8797 RSC.
- N. Francolon, D. Boyer and F. Leccia, Preparation of Core/Shell NaYF4:Yb,Tm@dendrons Nanoparticles with Enhanced UpconversionLuminescence for in Vivo Imaging, Nanomedicine, 2016, 12(7), 2107–2113 CrossRef CAS PubMed.
- Y. Yuan, Z. Ding, J. Qian, J. Zhang and J. Xu, Casp3/7-instructed Intracellular Aggregation of Fe3O4Nanoparticles Enhances T2 MR Imaging of Tumor Apoptosis, Nano Lett., 2016, 16, 2686–2691 CrossRef CAS PubMed.
- H. Q. Liu, J. Y. Han, C. McBean, C. C. S. Lewis, P. K. Routh, M. Cotlet and S. S. Wong, Synthesis-driven, Structure-dependent Optical Behavior in Phase-tunable NaYF4:Yb,Er-based Motifs and Associated Heterostructures, Phys. Chem. Chem. Phys., 2017, 19, 2153–2167 RSC.
- H. Suo, F. F. Hu, X. Q. Zhao, Z. Y. Zhang, T. Li, C. K. Duan, M. Yin and C. F. Guo, All-in-one Thermometer-heater Up-converting Platform YF3:Yb3+,Tm3+ Operating in The First Biological Window, J. Mater. Chem. C, 2017, 5, 1501–1507 RSC.
- G. Hu, N. Li and J. Tang, A General and Facile Strategy to Fabricate Multifunctional nanoprobes for simultaneous 19F magnetic resonance imaging, optical/thermal Imaging and Photothermal Therapy, ACS Appl. Mater. Interfaces, 2016, 8(35), 22830–22835 CrossRef CAS PubMed.
- X. Cui, D. Mathe and N. Kovács, Synthesis, Characterization, and Application of Core–Shell Co0.16Fe2.84O4@NaYF4(Yb,Er) and Fe3O4@NaYF4(Yb,Tm) Nanoparticle as Trimodal (MRI, PET/SPECT, and Optical) Imaging Agents, Bioconjugate Chem., 2015, 27(2), 319–324 CrossRef PubMed.
- T. Wu, H. Y. Pan, R. B. Chen, D. Luo, H. Zhang, Y. Shen, B. Lu, J. Huang, Y. H. Li and L. Wang, Enhanced Photoluminescence of Fe3O4@Y2O3:Eu3+ Bifunctional Nanoparticles by the Gd3+ Co-doping, J. Alloys Compd., 2016, 666, 507–512 CrossRef CAS.
- Z. L. Qin, S. A. Du, Y. Luo, Z. J. Liao, F. Zuo, J. B. Luo and D. Liu, Hydrothermal Synthesis of Superparamagnetic and Red Luminescent Bifunctional Fe3O4@Mn2+-Doped NaYF4:Yb/Er core@shell Monodisperse Nanoparticles and Their Subsequent Ligand Exchange in Water, Appl. Surf. Sci., 2016, 378, 174–180 CrossRef CAS.
- H. T. V. Hong, T. S. Atabaev, N. D. Nguyen, Y. H. Hwang and H. K. Kim, Luminescent Core–Shell Fe3O4@Gd2O3:Er3+,Li+ Composite Particles With Enhanced Optical Properties, J. Sol–Gel Sci. Technol., 2014, 71(3), 391–395 CrossRef.
- P. Jing, Q. Wang, B. C. Liu, G. R. Xu, Y. B. Zhang, J. Zhang and G. H. De, Controlled Fabrication of Bi-functional Fe3O4@SiO2@Gd2O3:Yb,Er Nanoparticles and Their Magnetic, Up-conversion Luminescent Properties, RSC Adv., 2014, 4, 44575–44582 RSC.
- J. X. Yang, X. W. Yang and H. Yang, Preparation and Properties of Multifunctional Fe@C@Y2O3:Eu3+ Nanocomposites, J. Alloys Compd., 2012, 512(1), 190–194 CrossRef CAS.
- Q. Ma, W. Yu, X. Dong, J. Wang and G. Liu, Janus Nanobelts: Fabrication, Structure and Enhanced Magnetic-Fluorescent Bifunctional Performance, Nanoscale, 2014, 6(5), 2945–2952 RSC.
- X. Chen, D. L. Zhou, W. Xu, J. Y. Zhu, G. C. Pan, Z. Yin, H. Wang, Y. S. Zhu, S. B. Cui and H. W. Song, Fabrication of Au–Ag Nanocage@NaYF4@NaYF4:Yb,Er Core–Shell Hybrid and Its Tunable Upconversion Enhancement, Sci. Rep., 2017, 7, 41079–41084 CrossRef CAS PubMed.
- Z. J. Wang, C. Wang, Q. Y. Han, G. Wang, M. D. Zhang, J. Zhang, W. Gao and H. R. Zheng, Metal-enhanced Upconversion Luminescence of NaYF4:Yb/Er with Ag Nanoparticles, Mater. Res. Bull., 2017, 88, 182–187 CrossRef CAS.
- K. Yamada, T. Hirose, T. Kuzuya and Y. Hamanaka, Plasmonic enhancement of third-order nonlinear optical susceptibilities in self-doped Cu2−xS nanoparticles, Opt. Mater. Express, 2016, 6(12), 3838–3842 CrossRef.
- O. Balitskii, D. Moszyński and Z. Abbas, Aqueous Processable WO3−x Nanocrystals with Solution Tunable Localized Surface Plasmon Resonance, RSC Adv., 2016, 6, 59050–59054 RSC.
- H. Su, H. Zhang, X. Tang and Y. Jing, Effects of MoO3 and WO3 Additives on Densification and Magnetic Properties of Highly Permeable NiCuZn Ferrites, Mater. Chem. Phys., 2007, 102(2–3), 271–274 CrossRef CAS.
- X. J. Tan, L. Z. Wang, C. Cheng, X. F. Yan, B. Shen and J. L. Zhang, Plasmonic MoO3−x@MoO3 Nanosheets for Highly Sensitive SERS Detection Through Nanoshell-isolated Electromagnetic Enhancement, Chem. Commun., 2016, 52, 2893–2896 RSC.
- Q. Huang, S. Hu, J. Zhuang and X. Wang, MoO(3−x)-based Hybrids with Tunable Localized Surface Plasmon Resonances: Chemical Oxidation Driving Transformation from Ultrathin Nanosheets to Nanotubes, Chemistry, 2012, 18(48), 15283–15286 CrossRef CAS PubMed.
- Z. Zhang, L. Yang, Y. R. Fang, B. S. Cao, J. D. Huang, K. C. Liu and B. Dong, Near-infrared-plasmonic energy upconversion in a nonmetallic heterostructure for efficient H2 evolution from ammonia borane, Adv. Sci., 2018, 1800748 CrossRef PubMed.
| This journal is © The Royal Society of Chemistry and the Centre National de la Recherche Scientifique 2019 |

