Synthesis, characterization and properties of tropine-based ionic liquids gels
Juan
Teng
 ,
Min
Lin
,
Jing
Gao
,
Min
Lin
,
Jing
Gao
 ,
Xuezhi
Dai
 ,
Xianqiu
Lan
and
Hang
Song
*
School of Chemical Engineering, Sichuan University, Chengdu 610065, China. E-mail: 714433744@qq.com; 1554065674@qq.com; 1248381392@qq.com; xuezhidai@outlook.com; 13699006688@163.com; hangsong@vip.sina.com; Tel: +86 28 85405221
First published on 14th November 2018
Abstract
A new type of tropine-based ionic liquid (IL) gels were synthesized and characterized by Fourier transform infrared spectra (FT-IR), elemental analysis (EA), X-ray diffraction (XRD), thermogravimetric analysis (TGA), scanning electron microscopy (SEM) and zeta potential measurements, and the swelling behavior of ionic liquid (IL) gels were further investigated. FT-IR, EA and XRD indicated the successful synthesis of IL gels, TGA analysis showed that the IL gels had good thermal stability, SEM showed that the introduction of ILs made the gel surface rough, and increased the specific surface area. The swelling values of IL gels were well correlated by the second-order kinetics equation with the correlation coefficients of at least 0.99. Furthermore, the IL gels were used as adsorbent to adsorb bovine albumin (BSA), the maximum adsorption capacity was up to 700 mg g−1.
Introduction
IL is room temperature molten salt with good thermal stability, low saturated vapor pressure and structural stability.1 There are many reports on the use of ILs for adsorption. As hydrophilic ILs are soluble in water, they are used for adsorption needs to be fixed to the water insoluble carrier in order to achieve the purpose of solid–liquid separation. Common carriers are silica gel,2–4 magnetic Fe3O4 particles,5–7 carbon nanotubes,8,9 PVC10 and graphene.11,12 These materials are rigid materials, and when coupled with ILs, coupling agents are required to connect the carrier and the ILs.13 When these carriers are used to immobilize ILs, the existing problem is the low loading capacity and that affects the final adsorption capacity.Gels have unique water absorption, water retention and bionic characteristics. Gels were widely used in industrial, agricultural, pharmaceutical and bio-engineering materials and other fields.14 Recently, modified gels have been reported and used as separation media in protein absorption,15,16 and showed satisfactory performance. ILs gels were used to modified carbon nanotubes17 and absorption dyes.18
BSA is the main component of bovine plasma protein, accounting for about 42% of total plasma protein.19 The structure of BSA is similar to that of human serum albumin (HSA).20 Therefore, BSA is often widely used as a protein model for in vitro studies, which requires isolation of protein samples. However, the currently studied materials21–23 have low adsorption capacity for proteins, generally ranging from a few milligrams to tens of milligrams of protein per gram of material, and have poor biocompatibility.24–27
Very recently, tropine-based ILs have been synthesized by us and successfully used to extract active ingredients from Chinese medicine28 or to separate proteins.29 In this study, tropine-based ILs were constructed into gels to obtain a new type of separation media. FT-IR, EA, XRD, TGA, SEM and zeta potential were used to characterize the synthesized IL gels. Moreover, the swelling behavior of IL gels were investigated and corrected by Fick model and second-order model. The synthesized IL gel was used for BSA adsorption.
Experiment section
Chemicals
Tropine was purchased from Huawen Chemical Co., Ltd. (Zhengzhou, China). 2,2′-Azobisisobutyronitrile (AIBN), allyl chloride, ethyl acetate, methanol, ethanol, acetone, N,N-methylene-bis-acrylamide (MBA), dichloromethane tripotassium phosphate and dipotassium hydrogenphosphate were purchased from Chengdu Kelong chemical reagent factory (Chengdu, China). BSA was purchased from Shanghai Boao Biotechnology Co., Ltd. (Shanghai, China). All solvents and reagents used were of analytical grade or higher. The deionized water was prepared in lab using a Millipore ultra-pure water system (0.4 mm filter, Bedford, MA).Instrumentation and analytical methods
FT-IR, EA, XRD, TGA, SEM and zeta potential methods were used to characterize the ILs and IL gels. Infrared L1600300 Spectroscopy (PerkinElmer, USA) was used to record FT-IR spectra in the range of 4000–400 cm−1 with KBr pellets. Elemental analysis data were obtained from EA3000 elemental analyzer (EuroVector Instruments and Software, Italy). XRD patterns were recorded on a D8 X-ray diffractometer equipped with accessional analytical system (Bruke, Germany). TGA was performed on a TGA calorimeter (Mettler Toledo) with a heating rate of 10 °C min−1 from 30 to 800 °C under nitrogen. Morphology of gel was observed with JSM-7500F (JEOL Co., Japan) SEM, the gels were sprayed with gold and observed, and the acceleration voltage was 5.0 kV to 10.0 kV. The values of zeta potential and surface charge distribution of IL gels were determined by Zetasizer Nano ZS (Malvern, UK).Synthesis of ILs gels
The synthesis route of tropine-based IL monomer is illustrated in Fig. 1(a), briefly, 10 g tropine and 6.5 g chloropropene (the molar ratio of tropine: chloropropene was 1![[thin space (1/6-em)]](https://www.rsc.org/images/entities/char_2009.gif) :
:![[thin space (1/6-em)]](https://www.rsc.org/images/entities/char_2009.gif) 1.2) were taken in a 100 mL single-necked flask with 30 mL ethyl acetate as solvent. The flask was sealed and the contents reacted in dark for 24 h at room temperature. The white crude product obtained was washed 3 times with 30 mL of ethyl acetate after reaction, and dried in vacuum for 24 h at 80 °C, then the white tropine-based ILs ([ATropine]+[Cl]−) was obtained with a yield of 96%.
1.2) were taken in a 100 mL single-necked flask with 30 mL ethyl acetate as solvent. The flask was sealed and the contents reacted in dark for 24 h at room temperature. The white crude product obtained was washed 3 times with 30 mL of ethyl acetate after reaction, and dried in vacuum for 24 h at 80 °C, then the white tropine-based ILs ([ATropine]+[Cl]−) was obtained with a yield of 96%.
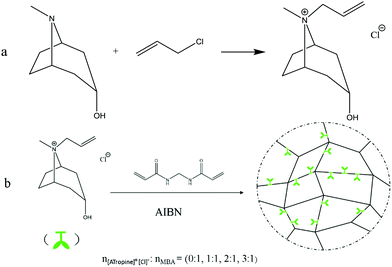 | ||
| Fig. 1 The synthesis route of IL gels (green bud-like icon represents [ATropine]+[Cl]−, the line connecting this structure was one or more MBA molecules, they polymerize to form a network structure). | ||
The synthesis route of ILs gels is depicted in Fig. 1(b), briefly, a certain amount of [ATropine]+[Cl]−, MBA (as cross-linking agent), AIBN (as initiator, accounted for 10% of the total mass of reactants) and methanol (as solvent) were taken in a 100 mL three-necked flask and were reacted at 50 °C for 6 h. After the reaction, the crude white gel was washed 3 times with 30 mL ethanol, and dried by vacuum freezing drying method, after which the gels were obtained. Four gels (Gel 0, Gel a, Gel b, Gel c) with different compositions were synthesized under the same procedure except that different molar ratio of [ATropine]+[Cl]−: MBA was used (the molar ratio of [ATropine]+[Cl]−: MBA were 0![[thin space (1/6-em)]](https://www.rsc.org/images/entities/char_2009.gif) :
:![[thin space (1/6-em)]](https://www.rsc.org/images/entities/char_2009.gif) 1, 1
1, 1![[thin space (1/6-em)]](https://www.rsc.org/images/entities/char_2009.gif) :
:![[thin space (1/6-em)]](https://www.rsc.org/images/entities/char_2009.gif) 1, 2
1, 2![[thin space (1/6-em)]](https://www.rsc.org/images/entities/char_2009.gif) :
:![[thin space (1/6-em)]](https://www.rsc.org/images/entities/char_2009.gif) 1, 3
1, 3![[thin space (1/6-em)]](https://www.rsc.org/images/entities/char_2009.gif) :
:![[thin space (1/6-em)]](https://www.rsc.org/images/entities/char_2009.gif) 1, respectively).
1, respectively).
Determination of swelling ratio
The equilibrium swelling rate of aerogels in solvent was measured by gravimetric method. A certain amount of gel was weighed in the solvent, allowed to swell for 24 h at room temperature; after removing the gel, the moisture on the surface of the gel was removed carefully with filter paper. The weight of the swollen gel was M1 (g), and after freeze drying, the weight was M0 (g) The swelling ratio can be calculated according to the following equation:30| W (%) = M1/M0 × 100% | (1) |
Adsorption experiment
A certain amount of IL gels as adsorbent was weighed and loaded into a 50 mL Erlenmeyer flask with a certain volume of BSA standard solution. The Erlenmeyer flask was sealed and oscillated at a constant temperature gas bath oscillator (140 rpm) at a desired temperature and time. Then the oscillation was stopped to allow the solution to settle down sufficiently, and the upper clear solution was sampled and centrifuged. The UV-visible absorbance of the upper solution was measured at a wavelength of 278 nm. The adsorption amount of IL gels can be calculated as follow:| Q = (C0 − C1)V/m | (2) |
Results and discussion
FT-IR analysis
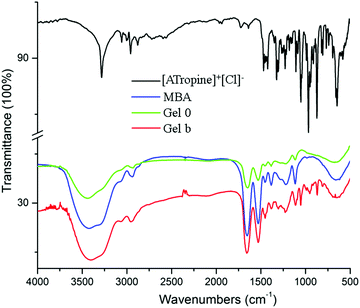
Gel 0, Gel b, [ATropine]+[Cl]− and MBA were characterized by FT-IR, the results were shown in Fig. 2. The main characteristic peak of Gel 0 was the symmetrical bending vibration of C![[double bond, length as m-dash]](https://www.rsc.org/images/entities/char_e001.gif) O at 1650 cm−1, the strong peak at 1530 cm−1 was the symmetrical bending vibration of N–H, which was peculiar to N–H trans-conformation. These peaks can also be found in the corresponding position in Gel b, which indicated that the MBA component was involved in the formation of Gel b. Comparing Gel 0 and Gel b, the peak of the anti-symmetrical stretching vibration of Gel 0 at 2916 cm−1 methylene produces a blue shift; this was because methylene groups in the cationic components of the tropine ILs and methylene groups of MBA influences by loss of charge. The C–H antisymmetric stretching vibration of methylene produces a blue shift. The introduction of ILs enhances the peaks at 1450 cm−1 and 1296 cm−1. The biggest difference between Gel b and Gel 0 was that a new peak appears below 1200 cm−1; for example, the new peak at 1042 cm−1 was the symmetrical bending vibration of O–H. Comparing Gel b and [ATropine]+[Cl]−, Gel b at 3700 cm−1 to 3300 cm−1 has stretching vibration peaks of N–H instead of [ATropine]+[Cl]− at 3274 cm−1, which has stretching vibration peaks of O–H. Meanwhile, for [ATropine]+[Cl]−, stretching vibration peak of
O at 1650 cm−1, the strong peak at 1530 cm−1 was the symmetrical bending vibration of N–H, which was peculiar to N–H trans-conformation. These peaks can also be found in the corresponding position in Gel b, which indicated that the MBA component was involved in the formation of Gel b. Comparing Gel 0 and Gel b, the peak of the anti-symmetrical stretching vibration of Gel 0 at 2916 cm−1 methylene produces a blue shift; this was because methylene groups in the cationic components of the tropine ILs and methylene groups of MBA influences by loss of charge. The C–H antisymmetric stretching vibration of methylene produces a blue shift. The introduction of ILs enhances the peaks at 1450 cm−1 and 1296 cm−1. The biggest difference between Gel b and Gel 0 was that a new peak appears below 1200 cm−1; for example, the new peak at 1042 cm−1 was the symmetrical bending vibration of O–H. Comparing Gel b and [ATropine]+[Cl]−, Gel b at 3700 cm−1 to 3300 cm−1 has stretching vibration peaks of N–H instead of [ATropine]+[Cl]− at 3274 cm−1, which has stretching vibration peaks of O–H. Meanwhile, for [ATropine]+[Cl]−, stretching vibration peak of ![[double bond, length as m-dash]](https://www.rsc.org/images/entities/char_e001.gif) C–H at 3030 cm−1 disappears; it also showed that [ATropine]+[Cl]− participates in the polymerization reaction.
C–H at 3030 cm−1 disappears; it also showed that [ATropine]+[Cl]− participates in the polymerization reaction.
Elemental analysis
The Elemental analysis results are shown in Table 1. It can be seen that as the content of [ATropine]+[Cl]− in the reaction formula increases, the amount of [ATropine]+[Cl]− component increases first and then decreases. When the formula [ATropine]+[Cl]−![[thin space (1/6-em)]](https://www.rsc.org/images/entities/char_2009.gif) :
:![[thin space (1/6-em)]](https://www.rsc.org/images/entities/char_2009.gif) MBA = 2
MBA = 2![[thin space (1/6-em)]](https://www.rsc.org/images/entities/char_2009.gif) :
:![[thin space (1/6-em)]](https://www.rsc.org/images/entities/char_2009.gif) 1, ILs accounted for the largest mass fraction of the gel was obtained, which was 51.59%. When the ratio of [ATropine]+[Cl]− and MBA in the formulation increased from 2
1, ILs accounted for the largest mass fraction of the gel was obtained, which was 51.59%. When the ratio of [ATropine]+[Cl]− and MBA in the formulation increased from 2![[thin space (1/6-em)]](https://www.rsc.org/images/entities/char_2009.gif) :
:![[thin space (1/6-em)]](https://www.rsc.org/images/entities/char_2009.gif) 1 to 3
1 to 3![[thin space (1/6-em)]](https://www.rsc.org/images/entities/char_2009.gif) :
:![[thin space (1/6-em)]](https://www.rsc.org/images/entities/char_2009.gif) 1, the proportion of ILs in the fraction of the ILs gel obtained decreased from 51.59% to 43.07%. This may be because as the proportion of addition of [ATropine]+[Cl]− increases, part of the [ATropine]+[Cl]− preferentially polymerizes but with only a small amount of MBA into polymer molecules. Since the content of ILs component in the molecule predominates, the formed polymer molecules had a linear non-reticulated structure and had a relatively high polarity, thereby dissolving in a solvent. This part of the polymer molecule dissolved in the solvent consumes [ATropine]+[Cl]−, so that the mass fraction of ILs in the polymer molecule precipitated from the solvent was lowered.
1, the proportion of ILs in the fraction of the ILs gel obtained decreased from 51.59% to 43.07%. This may be because as the proportion of addition of [ATropine]+[Cl]− increases, part of the [ATropine]+[Cl]− preferentially polymerizes but with only a small amount of MBA into polymer molecules. Since the content of ILs component in the molecule predominates, the formed polymer molecules had a linear non-reticulated structure and had a relatively high polarity, thereby dissolving in a solvent. This part of the polymer molecule dissolved in the solvent consumes [ATropine]+[Cl]−, so that the mass fraction of ILs in the polymer molecule precipitated from the solvent was lowered.
| ILs Gel | ILs (g) | MBA (g) | AIBN (g) | Mass ratio of ILs |
|---|---|---|---|---|
| Gel 0 | 0 | 1 | 0.02 | 0 |
| Gel a | 1 | 1 | 0.20 | 37.17% |
| Gel b | 2 | 1 | 0.30 | 51.59% |
| Gel c | 3 | 1 | 0.40 | 43.07% |
XRD diffraction spectral analysis
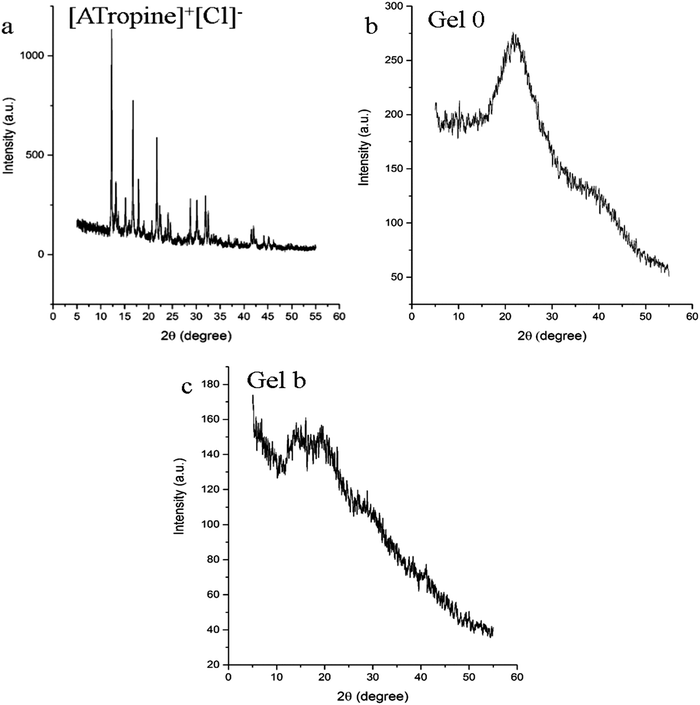
Fig. 3 is the XRD diagram of [ATropine]+[Cl]−, Gel 0 and Gel b. There were significant peaks in the XRD pattern of [ATropine]+[Cl]− (Fig. 3a), and the half-width was small, indicating that [ATropine]+[Cl]− has a clear crystal structure. The XRD pattern of Gel 0 (Fig. 3b) has a broad peak at 2θ equals 22°, and two broad peaks appear at 2θ of 10–20 °C in the XRD diagram of Gel b (Fig. 3c). This change may be caused by the introduction of ILs. Fig. 3b and c both demonstrate that the synthesized IL gels did not have crystallinity, and the difference between [ATropine]+[Cl]− and gels spectra proves the successful synthesis of the IL gels.Thermodynamic properties
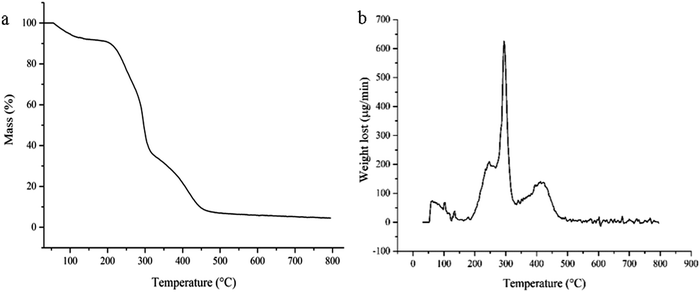
The TGA and DTG test results of ILs Gel b are shown in Fig. 4a and b, respectively. It can be seen from Fig. 4(a and b) that there are three major weightlessness peaks. Firstly, the mass lost is the amount of water in the gel at less than 100 °C, accounted for about 5% of the total weight which indicates that the synthesized ILs gel has strong water absorption. Secondly, the amino groups in the gel began to break down when the temperature increased to 200 °C, at the same time a small amount of quaternary ammonium salt cation degradation generated volatile components; a weightlessness peak occurred when the temperature reached about 245 °C. When the temperature exceeded 250 °C, the degradation rate speeded up, a large number of MBA components and quaternary ammonium salts began to degrade, a maximum weightlessness peak appeared at about 285 °C. Finally, the carbon skeleton of the gel began to collapse when the temperature was about 320 °C, then followed a step-down weightlessness rate until the temperature reached about 450 °C, and a weightlessness peak appeared at about 425 °C. When the temperature exceeded 460 °C, the weightlessness balance was achieved, hydrogel basic weightlessness exhausted. This was similar to the trend reported in the literature.31Surface structure analysis
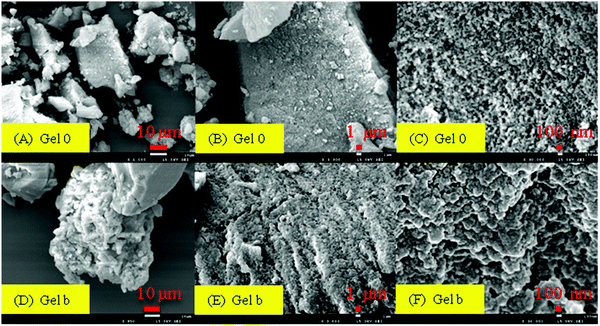
Fig. 5 are the SEM photos of ILs gels. (A), (B), (C) are the SEM images of Gel 0 and (D), (E), (F) are the SEM images of Gel b. Comparing (A), (B) and (D), (E), it can be found that the surface of Gel 0 is relatively smooth. After the introduction of ILs into the gel, the gel surface became evidently more rough, complex and porous.Zeta potential analysis
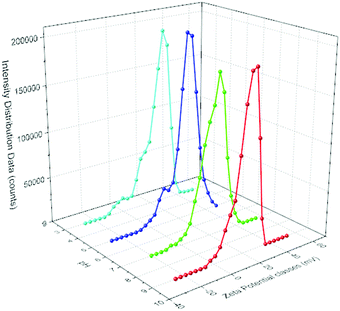
Fig. 6 shows the zeta potential of IL gels saturated by water with different pH values. It was found that the pH had no significant effect on the Zeta potential and charged nature of IL gels. In all cases, the IL gels were electropositive, the reason may be that [ATropine]+[Cl]− was a strong electrolyte, and the IL gels will partially ionize in water, thus the gel bulk with tropine-based cations is electropositive. At pH of 3, 5, 7, 9, the zeta potentials were +29.44 mV, +25.70 mV, +25.85 mV, +27.12 mV, respectively. Namely, the effect of pH on the ionization degree of IL gels was not significant, so the change in the magnitude of the electropositive charge at different pH value was not significant.Swelling behavior
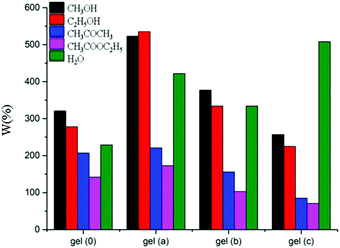
In general, the swelling behaviour is a result of the increasing distance between the nodes of polymer network.32Fig. 7 shows the swelling behaviour of the four IL gels in different solvents. Because the four IL gels obtained are hydrophilic gels, the structural units [ATropine]+[Cl]− and MBA of the gel polymer molecules, which are rich in solitary electrons, easily form hydrogen bonds with water, methanol, and ethanol molecules having large polarity. Therefore, the IL gels show a relatively high swelling ratio in these solvents, while the swelling ratio in acetone and ethyl acetate is relatively small. In addition, the introduction of [ATropine]+[Cl]− can increase the swelling ratio of IL gels in the strong polar solvent. For instance, the swelling ratio of IL gels in water follows the order Gel c > Gel a > Gel b > Gel 0.The swelling or contraction process of the gel mainly reflects the hydrophilic groups in the gel, or the interaction of the hydrophobic groups with the solvent. If the hydrophilic group forms a hydrogen bond with the solvent, the solvent easily penetrates into the gel, which means that the gel has a large swelling ability in such a solvent; in contrast, if the hydrophilic group is incapable of forming hydrogen bonds with a solvent, the swelling ability of the gel in such a solvent is small.33 Moreover, the amount of the initiator is different, and the chain length of the synthesis is different, which also causes the difference in swelling ability; the crosslinking density also has a certain influence on the swelling ability of the gel. However, the reason for different trends of swelling ratio in water and in alcohols is still unclear.
The swelling dynamics is used to describe the swelling rate of gel. The data can be fitted with the empirical equation to obtain more information about the swelling process. The most commonly used swell dynamics models are the Fick model (eqn (3))34 and the second-order dynamics model (eqn (4)):35
| Wt = Kpt0.5 | (3) |
| t/W = 1/KsWe2 + t/W∞ | (4) |
The dynamics experiment was carried out in 0.01 M phosphate buffer (PBS). Fig. 8(a) shows the change in IL gels swelling ratio as a function of time. The variation in swelling behaviours of IL gels in PBS is the same as that in water, the swelling ratio follows the order Gel c > Gel a > Gel b > Gel 0.
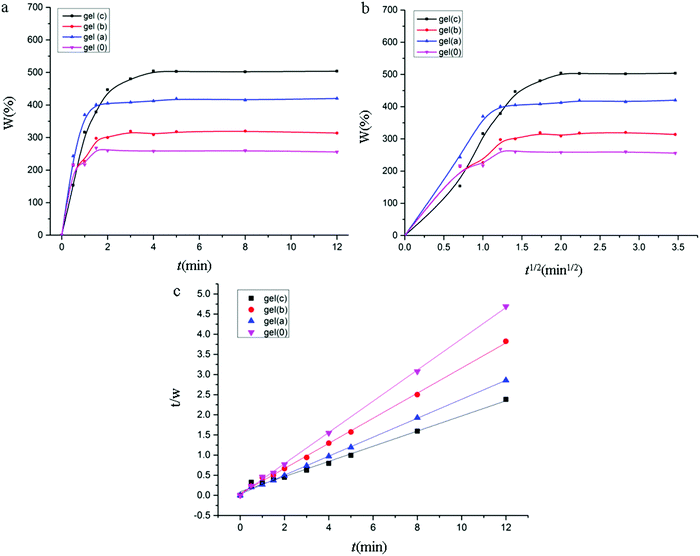 | ||
| Fig. 8 (a) The time dependence of swelling ratio for IL gels. (b) The fitted plots of Fick model. (c) The fitted plots of second-order dynamics model. | ||
To further discuss the swelling behaviour of IL gels, the swelling data were fitted by Fick model and second-order dynamics model, the fitted plots are shown in Fig. 8(b and c), respectively, and the fitted parameters are listed in Table 2.
| Sample | R 2 | |
|---|---|---|
| Fick model | Second-rate model | |
| Gel 0 | 0.9885 | 0.9911 |
| Gel a | 0.9904 | 0.9986 |
| Gel b | 0.9920 | 0.9993 |
| Gel c | 0.9945 | 0.9995 |
From Fig. 8(b), the swelling behaviour can be well described by the Fick function only before the swelling reaches equilibrium. The expression of the Fick model is that the diffusion coefficient is constant, but in the early and late swelling, the diffusion coefficient of the solvent in the different swelling ratio of the gel is variable, so the Fick model did not describe the swelling of the gel well. Fig. 8(c) showed that the swelling data of IL gels can be well fitted with the second-order dynamics model in the whole range. It can be seen from Table 2 that the swelling data of IL gels can be well correlated by both Fick model and second-order dynamics model, but the second-rate model can provide more ideal correlation results with R2 above 0.99.
Study and optimization of adsorption conditions
The effects of adsorption temperature, BSA initial concentration, solid–liquid ratio, pH value and adsorption time on the adsorption capacity of ILs Gel (b) are shown in Tables 3–6 as an example, respectively.| Entry | BSA initial concentration (mg mL−1) | Adsorbent temperature (°C) | Adsorption time (h) | Solid–liquid ratio (g L−1) | pH | Adsorbing capacity (mg g−1) |
|---|---|---|---|---|---|---|
| 1 | 0.6 | 25 | 4 | 2.5 | 7.2 | 73.3 |
| 2 | 1.0 | 25 | 4 | 2.5 | 7.2 | 236.7 |
| 3 | 1.2 | 25 | 4 | 2.5 | 7.2 | 351.6 |
| 4 | 1.4 | 25 | 4 | 2.5 | 7.2 | 471.2 |
| 5 | 1.6 | 25 | 4 | 2.5 | 7.2 | 583.9 |
| 6 | 2.0 | 25 | 4 | 2.5 | 7.2 | 724.4 |
| 7 | 2.2 | 25 | 4 | 2.5 | 7.2 | 731.8 |
| 8 | 2.4 | 25 | 4 | 2.5 | 7.2 | 733.1 |
| 9 | 2.6 | 25 | 4 | 2.5 | 7.2 | 734.5 |
| Entry | BSA initial concentration (mg mL−1) | Adsorbent temperature (°C) | Adsorption time (h) | Solid–liquid ratio (g L−1) | pH | Adsorbing capacity (mg g−1) |
|---|---|---|---|---|---|---|
| 1 | 2.2 | 25 | 4 | 1.0 | 7.2 | 567.8 |
| 2 | 2.2 | 25 | 4 | 2.0 | 7.2 | 558.1 |
| 3 | 2.2 | 25 | 4 | 2.5 | 7.2 | 541.2 |
| 4 | 2.2 | 25 | 4 | 4.0 | 7.2 | 439.4 |
| 5 | 2.2 | 25 | 4 | 5.0 | 7.2 | 369.8 |
| 6 | 2.2 | 25 | 4 | 7.5 | 7.2 | 278.7 |
| 7 | 2.2 | 25 | 4 | 10.0 | 7.2 | 201.3 |
| 8 | 2.2 | 25 | 4 | 12.5 | 7.2 | 168.5 |
| Entry | BSA initial concentration (mg mL−1) | Adsorbent temperature (°C) | Adsorption time (h) | Solid–liquid ratio (g L−1) | pH | Adsorbing capacity (mg g−1) |
|---|---|---|---|---|---|---|
| 1 | 2.2 | 25 | 4 | 2.5 | 2 | 68.9 |
| 2 | 2.2 | 25 | 4 | 2.5 | 3 | 278.8 |
| 3 | 2.2 | 25 | 4 | 2.5 | 4 | 540.2 |
| 4 | 2.2 | 25 | 4 | 2.5 | 5 | 698.1 |
| 5 | 2.2 | 25 | 4 | 2.5 | 6 | 491.4 |
| 6 | 2.2 | 25 | 4 | 2.5 | 7 | 446.7 |
| 7 | 2.2 | 25 | 4 | 2.5 | 8 | 382.5 |
| 8 | 2.2 | 25 | 4 | 2.5 | 9 | 271.8 |
| 9 | 2.2 | 25 | 4 | 2.5 | 10 | 245.6 |
| 10 | 2.2 | 25 | 4 | 2.5 | 11 | 223.9 |
| Entry | BSA initial concentration (mg mL−1) | Adsorbent temperature (°C) | Adsorption time (h) | Solid–liquid ratio (g L−1) | pH | Adsorbing capacity (mg g−1) |
|---|---|---|---|---|---|---|
| 1 | 2.2 | 25 | 0.5 | 2.5 | 5 | 509.2 |
| 2 | 2.2 | 25 | 1 | 2.5 | 5 | 625.7 |
| 3 | 2.2 | 25 | 1.5 | 2.5 | 5 | 653.1 |
| 4 | 2.2 | 25 | 2 | 2.5 | 5 | 709.6 |
| 5 | 2.2 | 25 | 2.5 | 2.5 | 5 | 711.3 |
| 6 | 2.2 | 25 | 3 | 2.5 | 5 | 713.4 |
| 7 | 2.2 | 25 | 3.5 | 2.5 | 5 | 714.8 |
| 8 | 2.2 | 25 | 4 | 2.5 | 5 | 715.2 |
The structure of proteins is sensitive to temperature and can change drastically with a slight change in temperature, so 25 °C was selected as the experimental temperature.
According to Table 3, with the increase of the BSA initial concentration, the adsorption capacity of IL Gel (b) first rapidly increases, and finally stabilizes after the BSA initial concentration of about 2.2 mg mL−1. At the low BSA concentration, the adsorbent has abundant adsorption sites, which enables most BSA to be adsorbed, but the total capacity of BSA is limited, so the adsorption amount is low.36 Therefore, the BSA initial concentration of 2.2 mg mL−1 is used for further investigations.
It can be seen from Table 4 that the solid–liquid ratio has a significant influence on the adsorption capacity. As the solid–liquid ratio increases, the adsorption capacity of IL gels steeply decreases after the solid–liquid ratio of about 2.5 g L−1. Although the increase in the solid–liquid ratio provides many adsorption sites, there are still many adsorption sites that are not adsorbed after the adsorption of BSA in the solution is completed. Thus, the solid–liquid ratio of 2.5 g L−1 was selected for further investigations.
In general, the pH has two main effects on the adsorption process: one is to change the surface charge properties and change the amount of adsorbent, the second is to change the surface charge properties and change the amount of protein. According to Table 5, in the range of pH 2–10, the adsorption amount of IL gels for BSA increases first and then decreases with the increase of pH value. When the pH is 5, the adsorption amount reaches the maximum. Considering that the isoelectric point of BSA is 5, and the adsorption effect of IL gels on BSA is good and did not destroy the protein activity, the experiment was carried out with the pH 5. As the pH changed, the charged amount of BSA in the solution changed, and the interaction between BSA and the IL gels also changed, so that the adsorption amount of BSA by the IL gels changes. Since the pH value of the solution will affect the conformation of the protein to certain extent, the peracid and alkali would destroy the natural activity of the protein. In addition, when the pH was lower or higher than the isoelectric point of the protein, the adsorption capacity was lowered due to the electrostatic repulsion. When the pH was equal to the isoelectric point of the protein, there was no net charge on the protein, and the adsorption effect was the best, which was similar to the results in the literature.36,37 Therefore, pH = 5 was selected for further investigations.
Table 6 shows that the adsorption time of the adsorbing capacity of BSA increases first and then stabilizes. Although IL gels provide many sites of adsorption, BSA proteins still take some time to occupy the active site. Considering that the adsorption equilibrium was attained in about 2 h, it was selected as the adsorption time for further investigations.
In the same optimization condition of 25 °C coupled with the BSA initial concentration of 2.2 mg mL−1, the solid–liquid ratio of 2.5 g L−1, the pH value of 5 and the adsorption time of 2 h, the adsorption capacity was up to 312.4 mg g−1, 715.3 mg g−1 and 728.5 mg g−1 for ILs gel (a), (b) and (c), respectively.
Compared with other reported adsorbent materials as summarized in Table 7, the synthesized IL gels exhibit comparable high adsorption capacity. It can be explained as follows: IL gels are hydrophilic gels, which have the characteristics of rapid water absorption and swelling properties, so that the adsorbed substrate can enter the interior of the gel adsorbent with the solution of fast and low resistance, so as to interact with the adsorption site inside the gel.
Conclusions
Four IL gels were synthesized and characterized by FT-IR, EA, XRD, TGA, SEM and zeta potential experiments. FT-IR, EA and XRD results indicated the successful synthesis of IL gels. The TGA-DTG analysis showed that the IL gels have good thermal stability below 200 °C, they begin to decompose at more than 200 °C and fully decompose at 425 °C. SEM characterization showed that Gel 0 has a smooth surface, and the introduction of IL components made the gel surface rough and porous. The effect of pH on the ionization degree of IL gel was not significant, therefore, the change of electric charge at each pH value was not significant. The synthesized IL gels were applied to adsorb BSA, and the single factor conditions were optimized with the maximum adsorption capacity reaching over 700 mg g−1. These IL gels are expected to be used as new separation media for separation and adsorption, and the results can provide important information for the development of ILs- or gel-based composite.Conflicts of interest
There are no conflicts to declare.References
- M. Petkovic, K. R. Seddon, L. P. N. Rebelo and C. S. Pereira, Chem. Soc. Rev., 2011, 40(3), 1383–1403 RSC.
- L. Ge, H. Huang, Y. S. Qin, F. Xia and K. D. Yang, Adsorption, 2016, 22(7), 871–878 CrossRef CAS.
- L. Sheikhian, Desalin. Water Treat., 2016, 57(18), 8447–8453 CrossRef CAS.
- W. Zhang, X. T. Feng, Y. Alula and S. Yao, Food Chem., 2017, 230, 637–648 CrossRef CAS PubMed.
- S. Kamran, G. Absalan and M. Asadi, Amino Acids, 2015, 47(12), 2483–2493 CrossRef CAS PubMed.
- S. Kamran, M. Asadi and G. Absalan, Anal. Methods, 2014, 6(3), 798–806 RSC.
- A. Pourjavadi, S. H. Hosseini, M. Doulabi, S. M. Fakoorpoor and F. Seidi, ACS Catal., 2012, 2(6), 1259–1266 CrossRef CAS.
- A. Mariñoa, Y. Leivaa, K. Bolañosa, O. García-Beltránb and E. Nagles, J. Electroanal. Chem., 2015, 759, 153–157 CrossRef.
- P. Tamilarasan and S. Ramaprabhu, RSC Adv., 2015, 5(44), 35098–35106 RSC.
- X. W. Chen and Y. J. Liu, Sci. Sin.: Chim., 2010, 40(1), 63–69 Search PubMed.
- P. Tamilarasan and S. Ramaprabhu, RSC Adv., 2016, 6(4), 3032–3040 RSC.
- W. F. Zhao, Y. S. Tang, J. Xi and J. Kong, Appl. Surf. Sci., 2015, 326, 276–284 CrossRef CAS.
- H. Wu, S. Yao, G. F. Qian, T. Yao and H. Song, J. Chromatogr. A, 2015, 1418, 150–157 CrossRef CAS PubMed.
- A. B. Hu, H. Zhou, Z. Q. Pan and Q. R. Cheng, J. Porous Mater., 2016, 23, 663–669 CrossRef CAS.
- M. Advincula, X. W. Fan, J. Lemons and R. Advincula, Colloids Surf., B, 2005, 42, 29–43 CrossRef CAS PubMed.
- E. A. G. Kalaf, R. Flores, J. G. Bledsoe and S. A. Sell, Mater. Sci. Eng., C, 2016, 63, 198–210 CrossRef PubMed.
- X. Fan and L. Wang, Tribol. Int., 2015, 88, 179–188 CrossRef CAS.
- S. Marullo, C. Rizzo, N. T. Dintcheva, F. Giannici and F. D'Anna, J. Colloid Interface Sci., 2018, 517, 182–193 CrossRef CAS PubMed.
- L. Guo, A. G. Liu and Z. H. Hu, Food Sci., 2009, 21, 489–492 Search PubMed.
- Q. Q. Yang, J. G. Liang and H. Y. Han, J. Phys. Chem. B, 2009, 113, 10454–10458 CrossRef CAS PubMed.
- W. Nicole, L. Yan and D. Joachim, Polymer, 2013, 3(27), 1–15 Search PubMed.
- L. Zhu, X. Y. Liu and T. Chen, Appl. Surf. Sci., 2012, 258, 7126–7134 CrossRef CAS.
- C. L. Dai, Y. J. Wan and X. Hou, Carbohydr. Polym., 2012, 87, 2338–2343 CrossRef CAS.
- L. J. Zhang, Y. W. Xu and H. L. Yao, et al. , Chem. – Eur J., 2009, 15(39), 10158–10166 CrossRef CAS PubMed.
- J. Yang, G. L. Yang and H. Y. Liu, et al. , J. Appl. Polym. Sci., 2011, 119(1), 412–418 CrossRef CAS.
- N. Avcibasi, M. Uygun and M. E. Corman, et al. , Appl. Biochem. Biotechnol., 2010, 162(8), 2232–2243 CrossRef CAS PubMed.
- T. S. Anirudhan and P. Senan, Chem. Eng. J., 2011, 168(2), 678–690 CrossRef CAS.
- J. Lu, H. Song, Y. Yang, G. F. Qian, L. R. Nie and S. Yao, J. Mol. Liq., 2015, 209, 648–656 CrossRef CAS.
- H. R. Wu, S. Yao, G. F. Qian, T. Yao and H. Song, J. Chromatogr. A, 2015, 1418, 150–157 CrossRef CAS PubMed.
- E. A. G. Kalaf, R. Flores, J. G. Bledsoe and S. A. Sell, Mater. Sci. Eng., C, 2016, 63, 198–210 CrossRef PubMed.
- R. N. Su, M. X. Xie, H. J. Li and Q. L. Deng, Chin. J. Chromatogr., 2016, 34(6), 545–549 CrossRef CAS.
- X. Y. Hua, Y. S. Wang, P. Z. Zhao and J. H. Zhu, Petrochem. Technol., 2008, 37(7), 681–684 CAS.
- S. J. Zeng, Y. Y. Yan and Q. Shen, J. Cellul. Sci. Technol., 2007, 15(2), 45–48 CAS.
- Y. Z. Wan, Y. L. Wang and G. X. Cheng, Acta Mater. Compositae Sin., 2002, 19(4), 33–37 CAS.
- C. N. Ofner and H. Schott, J. Pharm. Sci., 1986, 75(8), 7990–7996 CrossRef.
- L. Chen, X. J. Huang, Y. Zhang and D. X. Yuan, J. Chromatogr. A, 2015, 1403, 37–44 CrossRef CAS PubMed.
- J. Hu, S. J. Li and B. Liu, Biochem. Eng. J., 2005, 23, 259–263 CrossRef CAS.
- K. Sedigheh, A. Mozaffar and A. Ghodratollah, Microchim. Acta, 2013, 180, 41–48 CrossRef.
- J. Chen, Y. Z. Wang, Y. H. Huang, K. J. Xu, N. Li, Q. Wen and Y. G. Zhou, Analyst, 2015, 140, 3474–3483 RSC.
- R. M. Gholam, M. Sedigheh, H. Hamed, D. Farshad and S. Mohammad, Carbohydr. Polym., 2016, 147, 379–391 CrossRef PubMed.
- N. Sahiner and S. Demirci, J. Appl. Polym. Sci., 2016, 133(22), 43478–43491 CrossRef.
| This journal is © The Royal Society of Chemistry and the Centre National de la Recherche Scientifique 2019 |

