DOI:
10.1039/C8NJ04028A
(Paper)
New J. Chem., 2019,
43, 413-426
Highly effective inhibition of mild steel corrosion in HCl solution by using pyrido[1,2-a]benzimidazoles
Received
9th August 2018
, Accepted 19th November 2018
First published on 20th November 2018
Abstract
The inhibition performance of three pyrido[1,2-a]benzimidazoles, namely, benzo[4,5]imidazo[1,2-a]pyridine (BIP), 2-methylbenzo[4,5]imidazo[1,2-a]pyridine (MBIP), and 2-(trifluoromethyl)benzo[4,5]imidazo[1,2-a]pyridine (TBIP), for steel corrosion in hydrochloric acid solution were researched through a weight loss test, electrochemical techniques, surface morphology (SEM, XPS) studies, and theoretical methods. The experimental results revealed that TBIP, BIP, and MBIP had excellent inhibition performance, and their maximum inhibition efficiencies at 0.25 mmol L−1 were 95.48%, 97.65%, and 98.96%, respectively. The properties of these inhibitors are considered to be mixed-type, and their adsorption mode belongs to the Langmuir isothermal type. The formation and properties of an adsorbed film on a steel surface were investigated using scanning electron microscopy (SEM) and X-ray photoelectron spectroscopy (XPS). Quantum chemical calculations provided insightful quantitative information to conclude the correlation between the molecular structures and inhibition performance. Molecular dynamics (MD) simulations were carried out to explore the configurationally adsorption behavior of these pyrido[1,2-a]benzimidazoles on Fe(110) surface, and the binding energy of these three inhibitors followed the order MBIP > BIP > TBIP, which is consistent with the experimental evaluation results.
Introduction
As an important structural material, mild steel has been extensively applied in construction and other industrial fields owing to its remarkable mechanic performance. However, mild steel is an active metal material, which is extremely sensitive to corrosion in HCl solution, and this can result in huge economic losses and potential environmental problems under acidic conditions.1–3 A practical and effective solution to this problem is to use synthetic organic corrosion inhibitors due to their easy synthesis, remarkable inhibition effect, and economic advantages. Generally, most effective inhibitors are heterocyclic compounds bearing larger electronegative atoms (i.e., N, O, S, and P), polar functional groups, and conjugated double bonds.4–7 Several organic heterocyclic compounds, such as Schiff bases,8 quinolones,9 thioureas,10 pyridines,11 and benzimidazoles,12 have been reported as some of the most effective acidic corrosion inhibitors. These molecules replace the water molecules adsorbed on the steel surface, and form an adsorption film with physical or chemical properties on a metallic surface. Various corrosion inhibitors have been developed to reduce the gap between corrosion protection tests and the actual steel protection. Nevertheless, the pursuit of practical corrosion inhibitors is still in its early phases and further investigation is needed to adequately understand the mechanism of inhibitor action. Different inhibitor platforms are needed to prevent mild steel corrosion in a hydrochloric acid medium, which makes the exploitation of the late-model chemical class of corrosion inhibitors for mild steel protection a high priority. Considering that benzimidazole and pyridine show good inhibition efficiency in hydrochloric acid solution,8,12 we envisioned that the combination of benzimidazole and pyridine might provide a new corrosion inhibitor platform. In this context, we report here our endeavors toward the development of pyrido[1,2-a]benzimidazoles as a highly effective inhibitor platform for mild steel corrosion in HCl solution.
In this paper, three pyrido[1,2-a]benzimidazoles, namely, benzo[4,5]imidazo[1,2-a]pyridine (BIP), 2-(trifluoromethyl)-benzo[4,5]imidazo[1,2-a]pyridine (TBIP), and 2-methyl-benzo[4,5]imidazo[1,2-a]pyridine (MBIP), were designed and smoothly synthesized by using a modified synthetic procedure for pyrido[1,2-a]benzimidazole synthesis. For the first time pyrido[1,2-a]benzimidazoles were found to be potential inhibitors for mild steel corrosion in acid solution, and they were selected as corrosion inhibitors mainly based on the following factors: (1) able to be easily synthesized at low cost; (2) contain multiple active centers and aromatic rings system; (3) have a special affinity to inhibit corrosion metals in acidic solutions; (4) have bulky steric hindrance. Here, the inhibition action of the studied inhibitors for mild steel in 1 mol L−1 HCl solution was studied using a weight loss method, potentiodynamic polarization, and electrochemical impedance spectroscopy (EIS) techniques. Scanning electron microscopy (SEM) and X-ray photoelectron spectroscopy (XPS) were used to test and verify the formation and properties of an adsorbed film on the steel surface. By calculating the electronic structure property of the inhibitor molecule, the inhibition mechanism of the inhibitors with mild steel was considered using a quantum chemical calculation method. Moreover, molecular dynamics simulations were employed to ascertain the adsorption behaviour of the inhibitors on Fe(110) surface. Our efforts should lead to a better comprehension of the elements controlled by their structural units, and might shed new light on the design of efficient corrosion inhibitors.
Experimental
Inhibitor synthesis and characterization
The pyrido[1,2-a]benzimidazoles were synthesized in the laboratory following the reported procedure in the literature,13 and the synthetic procedure is shown in Fig. 1. The pyrido[1,2-a]benzimidazoles synthetic procedure possesses many advantages, such as using molecular oxygen as a green oxidant, readily available starting materials, and high regioselectivity. The molecular structures of the inhibitors were confirmed by their spectroscopic and spectrometric data (1H NMR, 13C NMR, IR), as shown below.
 |
| | Fig. 1 Synthetic route of the studied pyrido[1,2-a]benzimidazoles. | |
Benzo[4,5]imidazo[1,2-a]pyridine (BIP).
1H NMR (400 MHz, CDCl3): δ/ppm = 8.47 (d, J = 6.8 Hz, 1H), 7.94 (d, J = 8.4 Hz, 1H), 7.90 (d, J = 9.2 Hz, 1H), 7.54 (t, J = 7.6 Hz, 1H), 7.46–7.37 (m, 2H), 6.85 (t, J = 6.6 Hz, 1H); 13C NMR (100 MHz, CDCl3): δ/ppm = 148.4, 144.3, 129.2, 128.7, 125.5, 125.0, 120.9, 119.8, 117.7, 110.3, 110.1; IR (film): νmax = 2983, 2359, 1737, 1503, 1464, 1373, 1238, 938, 847, 763, 730 cm−1.
2-Methylbenzo[4,5]imidazo[1,2-a]pyridine (MBIP).
1H NMR (400 MHz, CDCl3): δ/ppm = 8.22 (s, 1H), 7.93 (d, J = 8.0 Hz, 1H), 7.84 (d, J = 8.0 Hz, 1H), 7.62 (d, J = 9.2 Hz, 1H), 7.51 (t, J = 7.8 Hz, 1H), 7.37–7.29 (m, 2H), 2.41 (s, 3H); 13C NMR (100 MHz, CDCl3): δ/ppm = 147.6, 144.4, 132.5, 128.3, 125.1, 122.5, 120.6, 119.8, 119.6, 117.1, 110.2, 17.9; IR (film): νmax = 3036, 2981, 2358, 1737, 1511, 1460, 1417, 1373, 1306, 1236, 1044, 938, 847, 814, 749, 729 cm−1.
2-(Trifluoromethyl)benzo[4,5]imidazo[1,2-a]pyridine (TBIP).
1H NMR (400 MHz, CDCl3): δ/ppm = 8.82 (s, 1H), 8.00–7.96 (m, 2H), 7.81 (d, J = 9.6 Hz, 1H), 7.64–7.55 (m, 2H), 7.47 (t, J = 7.6 Hz, 1H); 13C NMR (100 MHz, CDCl3): δ/ppm = 147.4, 144.8, 128.6, 126.5, 124.6 (q, J = 2.5 Hz), 124.4 (q, J = 5.7 Hz), 123.4 (q, J = 269.1 Hz), 122.1, 120.4, 118.6, 114.3 (q, J = 34.2 Hz); IR (film): νmax = 2985, 2359, 1736, 1462, 1373, 1319, 1240, 1128, 1046, 847, 753, 679 cm−1.
Materials and electrolytes
The elemental composition of the mild steel materials used for the experiments was as follows (wt%): 0.076 C, 0.025 Si, 0.174 Mn, 0.012 P, 0.005 S, and the balance Fe. The steel materials used for the electrochemical experiments and surface analysis were sized 1.8 × 0.6 × 0.4 cm and 1.0 × 1.0 × 0.1 cm, respectively. For the electrochemical experiments, the electrodes retained a working area of 0.2 cm2, and then the non-working surface was encapsulated with epoxy resin. Prior to the measurements, SiC abrasive papers with different grades were used to polish the electrode working surface, which was then washed with ethanol and dried with cold air. Analytical grade 37% hydrochloric acid and ultrapure water were used to formulate 1 mol L−1 HCl test solutions. The concentration of pyrido[1,2-a]benzimidazoles ranged from 0.10 mmol L−1 to 0.25 mmol L−1 for the test solutions.
Weight loss experiments
Weight loss tests were performed under the condition of different concentrations of BIP, MBIP, and TBIP inhibitors in 1 mol L−1 HCl medium at room temperature [(30 ± 0.1) °C] for 72 h. After the corrosion test was completed, the specimen's surface was carefully rinsed with ultrapure water, dried and weighed. In order to obtain the average weight loss reduction error, three parallel experiments were carried out in each group with a standard deviation of less than 7% (Fig. 2), indicating that the experiment was reproducible. The corrosion rate (v) was obtained from the average of the three parallel experimental data.5,14 Besides, the effect of temperature (30 °C to 60 °C) on the corrosion inhibition performance of BIP, MBIP, and TBIP was also considered by the weight loss method.
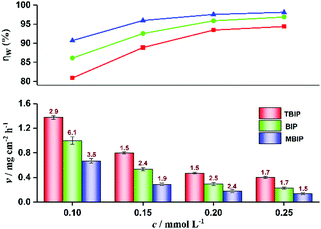 |
| | Fig. 2 Variation of corrosion rate and inhibition efficiency with different concentrations of TBIP, BIP, and MBIP by weight loss test. Error bars ( ) represent the standard deviations (%). ) represent the standard deviations (%). | |
Electrochemical measurements
A CHI 760E electrochemical analyzer was used to carry out the experiments, with a standard three-electrode system: mild steel as the working electrode, a large platinum plate as the auxiliary electrode, and a saturated calomel electrode (SCE) as the reference electrode. Polarization curves were measured in the potential range from −760 to −210 mV (vs. SCE) with a scan rate of 1 mV s−1, and EIS measurements were performed at EOCP in the frequency range from 100 kHz to 100 mHz with a sinusoidal potential perturbation of 5 mV. The EIS data were fitted with Zsimpwin software to obtain the corresponding impedance parameters and equivalent circuit. All the electrochemical tests were measured at room temperature.
Surface morphology investigation: SEM and XPS
The surface morphologies of the steel specimens after immersion in 1 mol L−1 HCl solution without and with 0.25 mmol L−1 pyrido[1,2-a]benzimidazoles at 30 °C were observed by SEM and XPS. The SEM study was conducted on a SUPR™55 instrument (Zeiss, Germany) at 2k× magnification. The X-ray photoelectron spectroscopy (XPS) spectra tests were recorded using a Thermo VG Scientific ESCALAB 250 spectrometer with a monochromatic Mg Kα X-ray source. The XPS spectra were fitted by XPS PEAK 4.1 software with a reference value of C 1s peak at 284.6 eV.15
Quantum chemical calculations
Quantum chemical calculations were performed using density function theory (DFT) at the B3LYP/6-31G(d,p) level within the Gaussian 09 program package.16 Generally, the calculated quantum chemical parameters, such as the energy of the lowest unoccupied molecular orbital (ELUMO), energy of the highest occupied molecular orbital (EHOMO), energy gap (ΔE = ELUMO − EHOMO), fraction of electrons transferred (ΔN), Mülliken charges, and natural bond orbital (NBO) charges, were used to analyze the relationship between the adsorption activity of the corrosion inhibitors and the corrosion resistance of the steel.
Molecular dynamics simulation
The interaction of the studied molecules with the Fe(110) surface was investigated by MD simulations using Materials Studio5.0 software. The iron crystal was imported and cleaved along the (110) plane and a slab of 5 Å was employed. Here, the Fe(110) surface was chosen due to its packed surface and better stabilization. The Fe(110) surface was then amplified to a (10 × 10) supercell to provide a large surface for the interaction inhibitors, and a zero thickness vacuum slab was established. A supercell with a = b = 24.82 Å, c = 25.14 Å, containing 500H2O, 5H3O+, 5Cl−, and a tested inhibitor molecule was built. The simulation process was conducted in a simulation box (24.82 Å × 24.82 Å × 43.21 Å) by COMPASS force field with 1.0 fs time steps and 500 ps of simulation time at ambient temperature (∼25 °C) under a macro canonical ensemble (NVT). The interaction energy and binding energy of the inhibitor molecules with the Fe(110) surface can be expressed by eqn (1) and (2), respectively:14| | | Einteraction = Etotal − (Esurface+solution + Einhibitor) | (1) |
| | | Ebinding = −Einteraction | (2) |
where Etotal is the total energy of the entire system, Esurface+solution represents the total energy of the Fe(110) surface and the solution without the inhibitor, and Einhibitor is the energy of the free inhibitor molecule.
Results and discussion
Weight loss study
Weight loss is one of the simpler monitoring methods for evaluating the inhibition performance of corrosion inhibitors, and has high reliability. Fig. 2 displays the corrosion rate (v) and inhibition efficiency (ηw) of the steel in 1 mol L−1 HCl with different concentrations of BIP, MBIP, and TBIP. The values of v and ηw were calculated by the following equations:| |  | (3) |
| |  | (4) |
where v is corrosion rate, W1 and W2 are the weight of steel before and after immersion, s is the exposed area of steel, t is the immersion time, and v0 and v represent the corrosion rate without and with inhibitors, respectively. As seen in Fig. 2, the values of v are significantly reduced and ηw increases after adding any of the inhibitors under study. At 0.25 mmol L−1, the maximum ηw values of TBIP, BIP, and MBIP were 94.39%, 96.86%, and 98.11%, respectively, and the v value follows the order of v(MBIP) < v(BIP) < v(TBIP). The results indicated that the presence of pyrido[1,2-a]benzimidazoles compounds could efficiently restrain the steel corrosion in HCl solution, and the highest ηw of MBIP in the given studied inhibitors was attributed to the existence of an electron-donating –CH3 group. The adsorption mechanism between the pyrido[1,2-a]benzimidazoles inhibitors and steel surface will be further clarified in the quantum chemical calculations section.
Effect of temperature
In order to understand the inhibition mechanism of temperature on corrosion inhibition, weight loss measurements were applied for the steel in 1.0 mol L−1 HCl without and with 0.25 mmol L−1 pyrido[1,2-a]benzimidazoles inhibitor at a temperature range of 30 °C to 60 °C (Table 1). As illustrated in Table 1, the v value increased significantly with increasing temperature in the uninhibited and inhibited solutions, which is attributed to the desorption of adsorbed inhibitor molecules at elevated temperatures, resulting in exposure to corrosive media with a large metal surface area, leading to the efficiency of the inhibitor decreasing. That means TBIP, BIP, and MBIP are temperature-dependent inhibitors. Furthermore, it was find that MBIP had a higher inhibition efficiency than TBIP and BIP at any temperature tested.
Table 1 Weight loss results of mild steel in 1 mol L−1 HCl with 0.25 mmol L−1 inhibitors at different temperatures
|
T (°C) |
TBIP |
BIP |
MBIP |
|
v (mg cm−2 h−1) |
η
w (%) |
v (mg cm−2 h−1) |
η
w (%) |
v (mg cm−2 h−1) |
η
w (%) |
| 30 |
0.403 |
94.39 |
0.226 |
96.86 |
0.136 |
98.11 |
| 40 |
0.999 |
90.37 |
0.696 |
93.29 |
0.459 |
95.57 |
| 50 |
2.150 |
84.21 |
1.616 |
88.13 |
1.030 |
92.43 |
| 60 |
4.069 |
77.35 |
3.402 |
81.06 |
2.567 |
85.71 |
In addition, kinetic analysis was performed to better understand the effect of temperature on the inhibition mechanism. The activation energy (Ea) can be obtained from the Arrhenius eqn (5):
| |  | (5) |
where
vcorr is the corrosion rate,
R is gas constant,
T is the absolute temperature, and
A represents pre-exponential factor. The Arrhenius plots of the steel in the test solutions are shown in
Fig. 3. The value of
Ea can be obtained from the Arrhenius plots line slope, as shown in
Table 2. As depicted in
Table 2, all the regression coefficients are almost close to unity, indicating that the corrosion of mild steel in 1 mol L
−1 HCl solution can follow the kinetic model. It is noteworthy that the values of
Ea in the presence of studied inhibitors were obviously higher than those of the uninhibited values, which may be related to the phenomenon of physical adsorption occurring on the steel surface formed by the electrostatic characteristics, which has been reported in the literature.
17,18 The activation enthalpy and entropy (Δ
H*, Δ
S*) of the corrosion process were calculated by the transition state
eqn (6), and the results are shown in
Table 2:
| |  | (6) |
where
h is Planck's constant and
N is Avogadro's number. A plot of ln(
vcorr/
T)
vs. 1/
T for mild steel in the test solutions at the experimental temperatures is given in
Fig. 4. Observing the data in
Table 2, it can be found that the Δ
H* values are positive, which indicates that the activation process is a corrosive endothermic process, and the hindered dissolution of metal in the inhibitor solution occurs.
18 The higher values of Δ
S* in the presence of pyrido[1,2-
a]benzimidazoles may be caused by the adsorption of inhibitor molecules, which could be considered as a quasi-substitution process between the inhibitor molecules and the water molecules at the solution and metal interface.
17,18
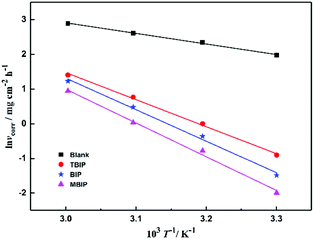 |
| | Fig. 3 Arrhenius plots of ln![[thin space (1/6-em)]](https://www.rsc.org/images/entities/char_2009.gif) vcorrvs. 1/T for steel in 1 mol L−1 HCl in the absence and presence of inhibitors. vcorrvs. 1/T for steel in 1 mol L−1 HCl in the absence and presence of inhibitors. | |
Table 2 Activation parameters for the steel dissolution in 1 mol L−1 HCl without and with inhibitors
| Inhibitors |
R
2
|
E
a (kJ mol−1) |
ΔH* (kJ mol−1) |
ΔS* (J mol−1 K−1) |
| Blank |
0.996 |
25.36 |
22.72 |
−153.99 |
| TBIP |
0.997 |
64.72 |
62.08 |
−47.82 |
| BIP |
0.994 |
75.46 |
72.82 |
−16.93 |
| MBIP |
0.993 |
80.83 |
78.12 |
−3.69 |
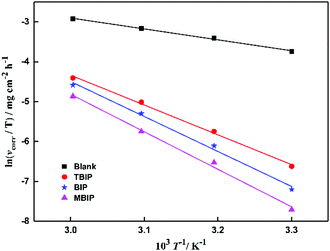 |
| | Fig. 4 Arrhenius plots of ln(vcorr/T) vs. 1/T for steel in 1 mol L−1 HCl in the absence and presence of inhibitors. | |
Adsorption isotherms
Generally, adsorption isotherms can give basic information about the adsorption behavior of an inhibitor by fitting the relation function between the surface coverage and concentration. Although there are many isotherms models in the literature, the most widely employed in corrosion inhibition studies are the Langmuir, Temkin, and Frumkin isotherms, which can be calculated by the following equations:| |  | (7) |
| | | Temkin: exp(fθ) = Kadsc | (8) |
| |  | (9) |
where c is the inhibitor concentration, θ represents the surface coverage, which was calculated according to eqn (4), f is the factor of energetic inhomogeneity, and Kads is the adsorption equilibrium constant. Fig. 5 shows the plots obtained from eqn (7)–(9), where the correlation coefficient R2 of the Langmuir isotherm (Fig. 5a) is above 0.99, which is better than for the Temkin isotherm (Fig. 5b) and Frumkin isotherm (Fig. 5c). From this observation, it was found that the Langmuir adsorption calculated by eqn (7) best fits the data from the weight loss test, with a linear regression coefficient (R2) close to 1 (Table 3), which suggests that the experimental data are well described by the Langmuir isotherm. The standard adsorption free energy (ΔG0ads) values were calculated by eqn (10):| | ΔG0ads = −RT![[thin space (1/6-em)]](https://www.rsc.org/images/entities/char_2009.gif) ln(55.5Kads) ln(55.5Kads) | (10) |
where T and R represent the thermodynamic temperature and gas constant, respectively. The ΔG0ads values of the three inhibitors were calculated and listed in Table 3 as −36.33, −37.64, and −38.51 kJ mol−1, respectively. As already reported previously,19–21 ΔG0ads values around −20 kJ mol−1 or less are related to the electrostatic interaction of positively charged inhibitor molecules and negatively charged metal surfaces, belonging to physisorption. On the contrary, values around −40 kJ mol−1 may involve the formation of chemical bonds between the inhibitor molecules and metal surface through electron sharing or transfer, thus belonging to chemisorption.4,21 According to the actual value of ΔG0ads for the inhibitors in this work (−36.33 to −38.51 kJ mol−1), the adsorption of corrosion inhibitors on the steel surface consists of physical adsorption and chemical adsorption interaction rather than a single adsorption action. Besides, the values of Kads follows the order of MBIP > BIP > TBIP, and MBIP shows the maximum negative value of ΔG0ads, further illustrating that MBIP to BIP and MBIP are more capable of adsorption on a metal surface. Also, the strong interaction between inhibitors and mild steel can be ascribed to the existence of nitrogen heteroatoms, electron-donating groups, and π-electrons in the MBIP molecules.
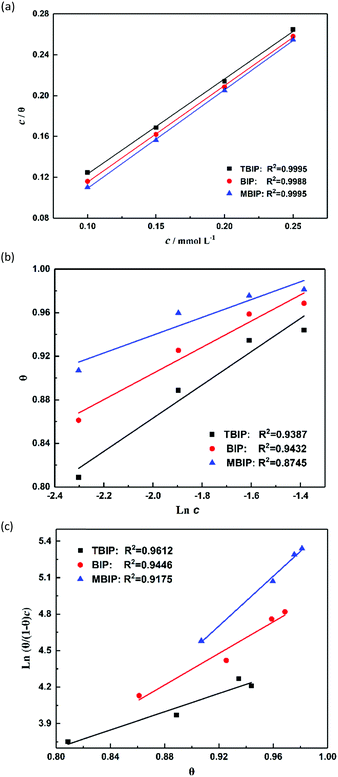 |
| | Fig. 5 Plots of (a) Langmuir, (b) Temkin, and (c) Frumkin isotherms for the adsorption of inhibitors on the surface of mild steel in 1 mol L−1 HCl. | |
Table 3 Thermodynamic parameters of the inhibitors on mild steel surface in 1 mol L−1 HCl solution
| Inhibitors |
R
2
|
Slope |
K
ads (104) |
ΔG0ads (kJ mol−1) |
| TBIP |
0.9995 |
0.933 |
3.30 |
−36.33 |
| BIP |
0.9988 |
0.945 |
4.79 |
−37.64 |
| MBIP |
0.9995 |
0.965 |
7.84 |
−38.51 |
Potentiodynamic polarization curves
The polarization curves of mild steel in 1 mol L−1 HCl solution with and without pyrido[1,2-a]benzimidazoles inhibitors are shown in Fig. 6. Table 4 summarizes the calculated inhibition efficiency (η) and related electrochemical parameters obtained by Tafel extrapolation method. The inhibition efficiency was calculated by eqn (11) based on the measured icorr:| |  | (11) |
where, i0corr and icorr are the current density values of unprotected and protected steel in acidic solution, respectively. As illustrated in Fig. 6 and Table 4, all the polarization curves show a trend to the low current density direction with the use of TBIP, BIP, and MBIP inhibitors. In addition, the icorr values decreased rapidly and the inhibition efficiency increased with the increase in concentration. These results indicated that the three studied inhibitors have an inhibitive effect on the anodic dissolution and cathodic hydrogen evolution of the electrode. Besides, the cathodic polarization curves of the test were nearly parallel and did not change noticeably, indicating that the mechanism of the hydrogen evolution reaction was not affected by the pyrido[1,2-a]benzimidazoles inhibitors. The reduction of H+ ions available on the steel surface was due to the active sites of the hydrogen evolution reaction being inhibited by the inhibitor molecules attached to the metal surface. In the anodic region, the anode curves of TBIP and BIP became steep, before overlapping and intersecting with the blank hydrochloric curve at a value of −0.22 V vs. SCE. According to Zhang,4 this phenomenon at the anodic region means the dissolution rate of steel is faster than the formation of the protective film, causing the inhibitor molecules desorption on the steel surface. For MBIP at a concentration above 0.2 mmol L−1, the anodic curves also became steep, overlapping but not intersecting with the blank hydrochloric curve, demonstrating that MBIP adsorption is more stable on mild steel surfaces than TBIP and BIP.
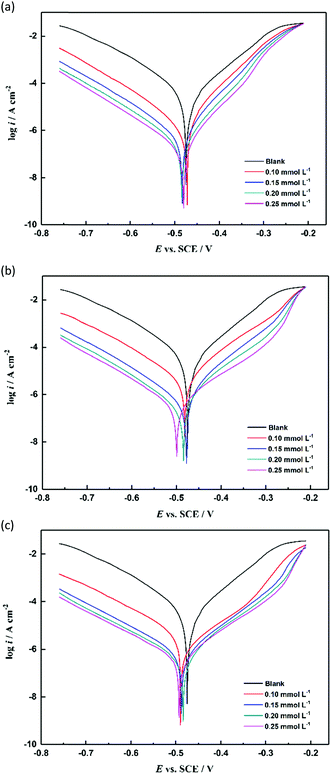 |
| | Fig. 6 Potentiodynamic polarization curves of mild steel in 1 mol L−1 HCl solution without and with different concentrations of inhibitors: (a) TBIP, (b) BIP, and (c) MBIP. | |
Table 4 Polarization curve parameters for the corrosion of mild steel in 1 mol L−1 HCl solution without and with different concentrations of inhibitors
| Inhibitors |
c (mmol L−1) |
E
corr (mV) |
i
corr (μA cm−2) |
β
a (mV dec−1) |
β
c (mV dec−1) |
η (%) |
| — |
Blank |
−474 |
649.57 |
117.2 |
−97.6 |
— |
|
|
| TBIP |
0.10 |
−472 |
151.62 |
111.0 |
−84.1 |
76.66 |
| 0.15 |
−483 |
65.47 |
120.9 |
−78.2 |
89.92 |
| 0.20 |
−485 |
38.12 |
117.2 |
−75.9 |
94.13 |
| 0.25 |
−481 |
29.36 |
119.8 |
−78.9 |
95.48 |
|
|
| BIP |
0.10 |
−482 |
97.40 |
113.5 |
−89.4 |
85.01 |
| 0.15 |
−477 |
46.31 |
113.1 |
−90.6 |
92.87 |
| 0.20 |
−484 |
25.27 |
116.3 |
−93.9 |
96.11 |
| 0.25 |
−499 |
15.26 |
121.9 |
−107.8 |
97.65 |
|
|
| MBIP |
0.10 |
−490 |
72.55 |
118.1 |
−113.6 |
88.83 |
| 0.15 |
−488 |
31.95 |
118.3 |
−90.0 |
95.08 |
| 0.20 |
−484 |
11.74 |
125.4 |
−93.6 |
98.19 |
| 0.25 |
−493 |
6.72 |
121.8 |
−106.4 |
98.96 |
Moreover, it is noteworthy that the η of the three pyrido[1,2-a]benzimidazoles followed the order of η(MBIP) > η(BIP) > η(TBIP), with the maximum inhibition efficiencies of 98.96%, 97.65%, and 96.48%, respectively (Table 4), and the experimental results were in accordance with those obtained by the weight loss method. Simultaneously, the potential of the studied inhibitors at any concentration was negatively shifted and less than 25 mV compared with the blank hydrochloric acid, showing that the three inhibitors studied mainly restrained the cathodic reaction and belonged to the mixed-type class of inhibitors. Other N/S-heterocyclic compounds with similar results for the corrosion of mild steel in acidic solution have been reported,22,23 Moreover, the βa and βc values were slightly changed after adding the inhibitor, which revealed that these adsorptive inhibitors can simply block the active reaction sites on the steel surface without effecting the corrosion mechanism of mild steel. In this way, it can be expected that the inhibition efficiency will increase as the inhibitor concentration increases.
Electrochemical impedance spectroscopy (EIS)
EIS measurements were performed to investigate the corrosion behavior of the uninhibited and inhibited steel. The Nyquist plots of steel with varying concentrations of TBIP, BIP, and MBIP in 1 mol L−1 HCl are shown in Fig. 7. As shown in Fig. 7, the diameters of the capacitive loop with either studied inhibitor were much larger than with the blank hydrochloric acid, and the inhibition strength was enhanced with increasing the concentration, indicating that the studied pyrido[1,2-a]benzimidazoles have a high inhibition ability. Besides, the Nyquist plots exhibit an approximately compressed semi-circle capacitive loop, which is usually considered to be caused by a “dispersion effect”.24–26 In general, this phenomenon may be caused by the surface roughness and other non-uniformities of metal electrodes. Also, according to the Bode plots in Fig. 8, the phase angles of the studied inhibitors show two peaks, indicating that there are two phase constants of these compounds and that the double-layer impedance does not show a perfect capacitance behavior. Besides, the absolute impedance increases significantly with the constant addition of the inhibitors, which is ascribed to the fact that the steel surface adsorbs more molecules at high concentrations, making the adsorption film thicker and causing the charge transport process to become more difficult. Considering the influence of the adsorption properties of the inhibitor on the charge transfer process, constant phase elements (CPEs) were applied to optimize the double-layer capacitor to obtain the ideal electrochemical process.10,27 The impedance of a CPE(ZCPE) is defined as follows:where Y0 is a proportionality coefficient, j is an imaginary number, and ω and n represent the angular frequency and phase shift, respectively.
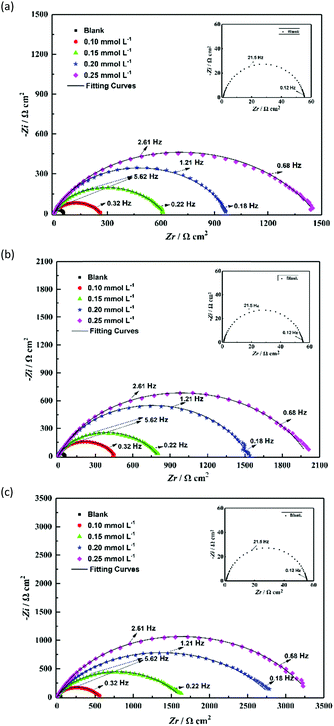 |
| | Fig. 7 Nyquist plots for mild steel in 1 mol L−1 HCl solution without and with different concentrations of inhibitors: (a) TBIP, (b) BIP, and (c) MBIP. | |
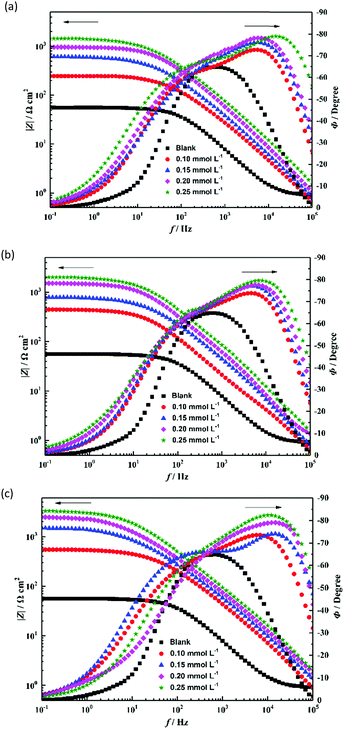 |
| | Fig. 8 Bode plots for mild steel in 1 mol L−1 HCl solution without and with different concentrations of inhibitors: (a) TBIP, (b) BIP, and (c) MBIP. | |
The corresponding two equivalent circuits in Fig. 9(a) and (b) were used to fit the impedance data. The fitted solid lines in Fig. 7 were fitted by the electric circuit in Fig. 9, which is consistent with the EIS experimental data, indicating that the equivalent circuits of the selection conform to the experimental requirements. The accuracy of the fitted data was evaluated using a chi-squared (χ2). Table 5 shows that the χ2 values were of the order of 10−3, indicating that the fitted data agree well with the experimental data. For example, the EIS result of TBIP was simulated by an equivalent circuit, as revealed in Fig. 9(b), with the obtained fitting curve illustrated in Fig. 10. The small values of χ2 (5.33 × 10⁻³) indicate a better fit.
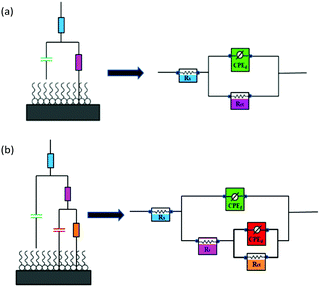 |
| | Fig. 9 Equivalent circuit used to fit the EIS experiment data: (a) without an inhibitor and (b) in the presence of an inhibitor. | |
Table 5 EIS parameters for the corrosion of mild steel in 1 mol L−1 HCl solution without and with different concentrations of inhibitors
| Inhibitors |
c (mmol L−1) |
R
s (Ω cm2) |
C
d (μF cm−2) |
n
d
|
R
ct (Ω cm2) |
C
f (μF cm−2) |
n
f
|
R
f (Ω cm2) |
χ
2 (×10−3) |
η
z
(%) |
| — |
Blank |
0.91 ± 0.04 |
161.0 ± 3.52 |
0.89 ± 0.04 |
55.6 ± 1.32 |
— |
— |
— |
|
— |
|
|
| TBIP |
0.10 |
0.21 ± 0.03 |
115.1 ± 2.61 |
0.66 ± 0.06 |
257.5 ± 4.54 |
14.1 ± 0.71 |
1.0 ± 0.02 |
5.0 ± 0.43 |
1.48 |
78.82 |
| 0.15 |
0.32 ± 0.05 |
92.9 ± 1.95 |
0.67 ± 0.03 |
606.1 ± 6.57 |
5.9 ± 0.41 |
0.99 ± 0.03 |
13.5 ± 0.78 |
3.25 |
91.03 |
| 0.20 |
0.86 ± 0.04 |
46.1 ± 1.07 |
0.70 ± 0.02 |
961.1 ± 8.23 |
4.0 ± 0.32 |
1.0 ± 0.02 |
19.5 ± 1.02 |
4.57 |
94.33 |
| 0.25 |
0.72 ± 0.03 |
28.2 ± 0.95 |
0.65 ± 0.03 |
1441.0 ± 9.46 |
2.5 ± 0.18 |
0.99 ± 0.04 |
28.9 ± 1.42 |
5.33 |
96.22 |
|
|
| BIP |
0.10 |
0.39 ± 0.04 |
103.9 ± 2.11 |
0.75 ± 0.04 |
442.2 ± 4.96 |
8.4 ± 0.53 |
1.0 ± 0.06 |
7.1 ± 0.51 |
2.53 |
87.63 |
| 0.15 |
0.58 ± 0.02 |
72.1 ± 1.43 |
0.66 ± 0.05 |
784.7 ± 6.62 |
4.7 ± 0.29 |
1.0 ± 0.02 |
21.8 ± 1.04 |
1.77 |
93.11 |
| 0.20 |
1.09 ± 0.04 |
32.9 ± 1.01 |
0.73 ± 0.03 |
1506.0 ± 9.22 |
2.8 ± 0.11 |
0.99 ± 0.03 |
23.5 ± 1.08 |
3.62 |
96.36 |
| 0.25 |
0.67 ± 0.05 |
22.7 ± 0.86 |
0.72 ± 0.02 |
1982.3 ± 9.87 |
2.1 ± 0.08 |
0.99 ± 0.03 |
28.1 ± 1.13 |
5.37 |
97.23 |
|
|
| MBIP |
0.10 |
0.27 ± 0.03 |
82.4 ± 1.21 |
0.65 ± 0.04 |
544.3 ± 5.02 |
6.8 ± 0.52 |
1.0 ± 0.04 |
15.4 ± 0.62 |
2.23 |
90.07 |
| 0.15 |
0.76 ± 0.02 |
49.1 ± 1.09 |
0.61 ± 0.03 |
1615.2 ± 8.34 |
3.1 ± 0.12 |
1.0 ± 0.02 |
15.7 ± 0.56 |
3.82 |
96.59 |
| 0.20 |
1.27 ± 0.03 |
24.9 ± 0.84 |
0.71 ± 0.02 |
2804.1 ± 10.03 |
1.6 ± 0.06 |
0.98 ± 0.03 |
24.3 ± 1.12 |
2.54 |
98.03 |
| 0.25 |
0.71 ± 0.04 |
19.7 ± 0.81 |
0.68 ± 0.03 |
3299.0 ± 12.45 |
1.8 ± 0.07 |
0.99 ± 0.02 |
40.9 ± 1.96 |
3.91 |
98.34 |
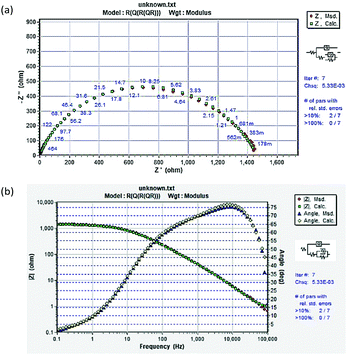 |
| | Fig. 10 Equivalent circuit fitting for mild steel in the presence of TBIP at 0.25 mmol L−1: (a) Nyquist plot and (b) Bode plot. | |
Based on the fitted lines and χ2 analysis, the equivalent circuits given in Fig. 9(a) and (b) were found to be sufficient and gave excellent fitting to the experimental EIS date. The fitted data based on the EIS measurements are listed in Table 5, where Rs is electrolyte resistance, Rct is charge transfer resistance, Rf is film resistance, and n is an exponent relevant to the phase shift. The CPEdl element can be substituted for the double-layer capacitance (Cd), which contains H2O and other ions adsorbed on steel surface, and CPEf reflects the film capacitance (Cf). The inhibition efficiency (ηz) can be expressed by eqn (13):
| |  | (13) |
where
R0p and
Rp represent the sum of
Rf and
Rct of the mild steel electrode without and with pyrido[1,2-
a]benzimidazoles inhibitors, respectively. According to
Table 5, the
Rf and
Rct values increased dramatically after adding the studied inhibitors, indicating that these compounds were adsorbed on the metal surface and thus effectively inhibited the charge transfer behavior. While, the values of
Cf and
Cd were gradually reduced with the constant addition of inhibitors, which is usually caused by a decrease in the local dielectric constant or the increase in the thickness of the electric double layer capacitor.
28–30 It may be that the inhibitor molecules gradually replaced the water molecules on the steel surface, forming a layer of dense protective film to prevent contact between the metal and acidic medium, thus preventing the occurrence of corrosion. In addition, another interesting finding in
Table 5 was that the
nd and
nf values are near unity, pointing to a capacitive interface. However, after the addition of the inhibitors, the
nd values decreased compared to the blank solution, which indicates an increase in heterogeneity resulting from the inhibitor's adsorption. However, the values of
nf showed no significant change, revealing that the corrosion reaction of the electrode surface was suppressed by the absorbed inhibitor film. Finally, it should be pointed out that with the addition of the inhibitors, the calculated
ηz of EIS increased, and the maximum
ηw reached 96.22% for TBIP, 97.23% for BIP, and 98.34% for MBIP at 0.25 mmol L
−1, respectively, which is consistent with the results from the weight loss test and the polarization curves.
Compared with the earlier studied imidazole derivative inhibitors by EIS method in 1 M HCl, as shown in Table 6, TBIP, BIP, and MBIP exhibited better corrosion inhibition behaviors. This phenomenon is related to the aromatic rings system and steric hindrance effect in their structures.
Table 6 Comparison of the inhibition efficiency of TBIP, BIP, and MBIP with the literature data as corrosion inhibitors for mild steel in 1 mol L−1 HCl solution
| Inhibitor |
c (mmol−1) |
η (%) |
Ref. |
| 2-(Trifluoromethyl)benzo[4,5]imidazo[1,2-a]pyridine |
0.2 |
94.3 |
This paper |
| Benzo[4,5]imidazo[1,2-a]pyridine |
0.2 |
96.4 |
This paper |
| 2-Methylbenzo[4,5]imidazo[1,2-a]pyridine |
0.2 |
98.0 |
This paper |
| 2-(Imidazol-2-yl)-pyridine |
0.2 |
90.3 |
1
|
| 2-Aminobenzimidazole |
0.5 |
47.1 |
4
|
| 2-Mercaptobenzimidazole |
0.5 |
92.0 |
12
|
| 2-(4-Pyridyl)-benzimidazole |
0.25 |
71.5 |
14
|
| 2-Aminomethyl benzimidazole |
0.5 |
56.8 |
19
|
| Bis(2-benzimidazolylmethyl)amine |
0.5 |
85.7 |
19
|
| 2-(Ethyllthio)-1,4,5-triphenyl-1H-imidazole |
1.0 |
73.5 |
22
|
| Bis-(2-benzimidazolylmethyl)oxide |
0.75 |
90.0 |
25
|
| 1,2-Bis-(2-benzimidazolyl)ethylene |
0.75 |
86.0 |
25
|
| 2-Aminomethylbenzimidazole |
1.0 |
56.3 |
26
|
| 2-Hydroxybenzimidazole |
1.0 |
45.5 |
26
|
| 2-(Benzylthio)-1,4,5-triphenyl-1H-imidazole |
1.0 |
84.0 |
28
|
Surface characterization: SEM and XPS
SEM was implemented to investigate the correlation between the surface properties of metals and the electrochemical corrosion behavior. Fig. 11 presents the SEM images of mild steel samples immersion in 1 mol L−1 HCl solution without and with 0.25 mmol L−1 pyrido[1,2-a]benzimidazoles for 36 h. Before soaking, the steel samples surface (Fig. 11a) was flat and smooth with only a few scratches produced by the polishing process. However, the uninhibited steel sample (Fig. 11b) was seriously corroded with large pits and cracks due to acid erosion. Moreover, in contrast, the surface of specimen (Fig. 11c–e) was relatively smooth and only a few shallow pitting corrosions occurred after adding the three inhibitors. In particular, the surface of steel protected by MBIP was the flattest and close to the sample polished surface. It can be deduced from these results that the three studied inhibitors can be stably adsorbed on steel surface to form a dense protective film, and the corrosion resistance of MBIP is stronger than that of the other two inhibitors.
 |
| | Fig. 11 SEM images of mild steel surfaces: (a) polished metal, (b) 1 mol L−1 HCl, (c) TBIP, (d) BIP, (e) MBIP. | |
With regard to the chemical composition of the adsorption layer, XPS tests were performed to study this in the presence of the best inhibitor (MBIP). Fig. 12(a–c) illustrate the high-resolution XPS spectra of specific elements (C, N, and Fe) protected layers. According to Fig. 12a, the C 1s spectra were fitted to three peaks. The small peak at 284.6 eV was ascribed to C–C, C![[double bond, length as m-dash]](https://www.rsc.org/images/entities/char_e001.gif) C, and C–H aromatic bonds, and another peak located at 286.7 eV was related to C–N and C
C, and C–H aromatic bonds, and another peak located at 286.7 eV was related to C–N and C![[double bond, length as m-dash]](https://www.rsc.org/images/entities/char_e001.gif) N bonds in pyrido[1,2-a]benzimidazole ring. The peak at 288.9 eV, which has a higher binding energy, was attributed to C
N bonds in pyrido[1,2-a]benzimidazole ring. The peak at 288.9 eV, which has a higher binding energy, was attributed to C![[double bond, length as m-dash]](https://www.rsc.org/images/entities/char_e001.gif) N+ structures and may be caused by the proton of the
N+ structures and may be caused by the proton of the ![[double bond, length as m-dash]](https://www.rsc.org/images/entities/char_e001.gif) N– structure in the pyrido[1,2-a]benzimidazole ring.31,32 N 1s peaks (Fig. 12b) at 399.7 eV, 400.8 eV, and 401.5 eV could be observed, with the first peak assigned to C–N and the unprotonated N atoms (
N– structure in the pyrido[1,2-a]benzimidazole ring.31,32 N 1s peaks (Fig. 12b) at 399.7 eV, 400.8 eV, and 401.5 eV could be observed, with the first peak assigned to C–N and the unprotonated N atoms (![[double bond, length as m-dash]](https://www.rsc.org/images/entities/char_e001.gif) N– structure),10,15 while the peak at 400.8 eV represents N–Fe groups due to the nitrogen atoms bonded to iron atoms. Actually, the coordination of a nitrogen atom with an iron atom (N–Fe) can produce a higher binding energy than an uncoordinated
N– structure),10,15 while the peak at 400.8 eV represents N–Fe groups due to the nitrogen atoms bonded to iron atoms. Actually, the coordination of a nitrogen atom with an iron atom (N–Fe) can produce a higher binding energy than an uncoordinated ![[double bond, length as m-dash]](https://www.rsc.org/images/entities/char_e001.gif) N– structure.15 The third peak at 401.5 eV was ascribed to the protonated nitrogen, which gives rise to positive polarization nitrogen atoms, leading to a larger binding energy.10 The Fe 2p3/2 (Fig. 12c) showed three peaks around 710.7 eV, 713.4 eV, and 715.2 eV. The first peak at 710.7 eV was attributed to ferric compounds, which came from Fe2O3 (i.e., Fe3+ oxide) and FeOOH (i.e., oxyhydroxide). Another peak appearing at 713.4 eV was due to the presence of FeCl3 in the hydrochloric acid solution, while the last peak at 715.2 eV was assigned to the satellite of Fe(III).32
N– structure.15 The third peak at 401.5 eV was ascribed to the protonated nitrogen, which gives rise to positive polarization nitrogen atoms, leading to a larger binding energy.10 The Fe 2p3/2 (Fig. 12c) showed three peaks around 710.7 eV, 713.4 eV, and 715.2 eV. The first peak at 710.7 eV was attributed to ferric compounds, which came from Fe2O3 (i.e., Fe3+ oxide) and FeOOH (i.e., oxyhydroxide). Another peak appearing at 713.4 eV was due to the presence of FeCl3 in the hydrochloric acid solution, while the last peak at 715.2 eV was assigned to the satellite of Fe(III).32
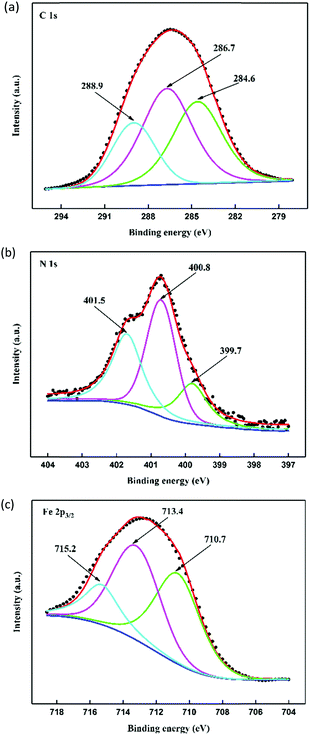 |
| | Fig. 12 High-resolution XPS spectra of (a) C 1s, (b) N 1s, and (c) Fe 2p3/2 for MBIP treated mild steel. | |
The XPS results showing the existence of nitrogen species illustrated that the chemical adsorption of MBIP inhibitor on steel surface was accompanied by physical adsorption, which the thermodynamic study confirmed. In addition, the Fe 2p3/2 analysis showed that the formation of a stable and insoluble layer (Fe2O3, FeOOH) makes the protected layer become more complete and it possesses excellent anti-corrosion ability.
Quantum chemical calculations
Quantum chemical calculations were performed to better study the structure–activity relationship between the molecular structure of the inhibitor and its inhibitory effect in this work. Fig. 13 displays an optimized molecular structure of TBIP, BIP, and MBIP. According to ref. 4, Mülliken charges and Fukui function are commonly used to analyze the adsorption-activated sites and the donor–acceptor electron interaction between inhibitor molecules and iron atoms. In that research, C and N atomic charges obtained by Mülliken charges were reported and these are listed in Table 7. It can be seen that the atoms with a larger negative change are C12, N19, N20, F22, F23 and F24 for TBIP, C12, C14, N20 and N21 for BIP, and C12, N19, N20 and C21 for MBIP, which are the main active atoms capable of forming coordinate bonds through the lone pair electrons and the empty d-orbital of iron atoms. Therefore, TBIP, BIP, and MBIP molecules can be efficiently adsorbed on steel surface by these active sites (C, F, and N) to restrain metallic corrosion. Whereas, Neodo et al. reported that N21 was protonated (pKaca. 4) and usually the affinity of the inhibitor was significantly reduced.33 Actually, the protonated inhibitor can be electrostatically adsorbed on the surface of negatively charged mild steel due to the specific adsorption of Cl− anions (physical adsorption), namely, protonated organic compounds can produce a synergistic effect with Cl−, and then the anodic dissolution reaction of iron can be prevented. Moreover, Fukui function f(r)+ and f(r)− were used to predict the selectivity of local sites, which are given by eqn (14) and (15):| | | fi(r)+ = qi(N + 1) − qi(N) | (14) |
| | | fi(r)− = qi(N) − qi(N − 1) | (15) |
where qi(N + 1), qi(N), and qi(N − 1) are the charges of atom i in the cationic, neutral, and anionic forms, respectively. The calculated results based on DFT for the three compounds are shown in Table 7. As a widely accepted view, the larger f(r)+ and f(r)− values imply higher acceptance and donation electronic capabilities, respectively. In all three inhibitor molecules, the larger f(r)+ values were found on C12, C13, and C15 atoms, which were capable of forming a back-donating bond due to accepting electrons from the steel surface. Whereas, the larger f(r)− were found on C1, C3, and N20 for TBIP, C1, C3, and N21 for BIP, and C1, C3, and N20 for MBIP, implying the better tendency of an atom in an inhibitor molecule to donate an electron to the metal surface. Compared with the other two compounds, the N20 atom in MBIP had a larger f(r)− value, which indicates that the N20 atom of TBIP is more prone to electrophilic attack and to form a coordination bond with iron atoms, leading to a higher inhibition efficiency.
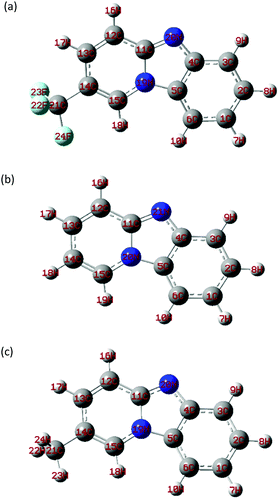 |
| | Fig. 13 Optimized structures of TBIP (a), BIP (b), and MBIP (c). | |
Table 7 Mulliken charge, f(r)+ and f(r)− for TBIP, BIP, and MBIP
| Compounds |
Atoms |
Mulliken charge charge |
f(r)+ |
f(r)− |
Atoms |
Mulliken charge |
f(r)+ |
f(r)− |
| TBIP |
C1 |
−0.1112 |
0.0380 |
0.1064 |
C14 |
−0.1205 |
0.0193 |
0.0595 |
| C2 |
−0.0904 |
0.0470 |
0.0056 |
C15 |
0.1385 |
0.1555 |
0.0516 |
| C3 |
−0.1203 |
0.0723 |
0.0996 |
N19 |
−0.6372 |
0.0279 |
0.0241 |
| C4 |
0.2098 |
−0.0030 |
−0.0085 |
N20 |
−0.5726 |
0.0709 |
0.1677 |
| C5 |
0.3009 |
−0.0087 |
0.0225 |
C21 |
0.7927 |
0.0043 |
−0.0005 |
| C6 |
−0.0853 |
0.0708 |
0.0538 |
F22 |
−0.2651 |
0.0188 |
0.0197 |
| C11 |
0.5224 |
−0.0150 |
0.0049 |
F23 |
−0.2634 |
0.0192 |
0.0201 |
| C12 |
−0.1311 |
0.1334 |
0.0593 |
F24 |
−0.2723 |
0.0147 |
0.0145 |
| C13 |
−0.0658 |
0.0911 |
0.0746 |
|
|
|
|
|
|
| BIP |
C1 |
−0.1127 |
0.0408 |
0.1052 |
C12 |
−0.1261 |
0.1239 |
0.0674 |
| C2 |
−0.0916 |
0.0457 |
0.0084 |
C13 |
−0.0675 |
0.1056 |
0.0651 |
| C3 |
−0.1225 |
0.0801 |
0.0960 |
C14 |
−0.1509 |
0.0089 |
0.0614 |
| C4 |
0.2136 |
−0.0040 |
−0.0125 |
C15 |
0.1384 |
0.1434 |
0.0647 |
| C5 |
0.2938 |
−0.0080 |
0.0264 |
N20 |
−0.6192 |
0.0269 |
0.0224 |
| C6 |
−0.0869 |
0.0773 |
0.0483 |
N21 |
−0.5791 |
0.0714 |
0.1777 |
| C11 |
0.5136 |
−0.0071 |
−0.0014 |
|
|
|
|
|
|
| MBIP |
C1 |
−0.1131 |
0.0419 |
0.0981 |
C12 |
−0.1298 |
0.1205 |
0.0655 |
| C2 |
−0.0923 |
0.0427 |
0.0105 |
C13 |
−0.087 |
0.1146 |
0.0557 |
| C3 |
−0.1227 |
0.0807 |
0.0937 |
C14 |
0.0562 |
0.0109 |
0.0693 |
| C4 |
0.2120 |
−0.0046 |
−0.0165 |
C15 |
0.1007 |
0.1299 |
0.0675 |
| C5 |
0.2941 |
−0.0085 |
0.0232 |
N19 |
−0.6241 |
0.0288 |
0.0259 |
| C6 |
−0.0873 |
0.0764 |
0.0486 |
N20 |
−0.5808 |
0.0707 |
0.1801 |
| C11 |
0.5139 |
−0.0045 |
−0.0064 |
C21 |
−0.3804 |
−0.0188 |
−0.0220 |
The electron distributions of the HOMO and LUMO of the frontier molecular orbitals are favorable for investigating the adsorption activity of inhibitor molecules, which is related to the molecular donor and accept electrons ability, respectively.4 The HOMO and LUMO diagrams of the three compounds presented in Fig. 14 all showed that the electron densities were distributed over the entire ring contained in the molecule. In MBIP, the –CH3 group at the 21-position makes little contribution to the HOMO, while it does not contribute to the LUMO, revealing that the –CH3 group tends to donate charges to the vacancy orbital of Fe through s-type HOMOs. The –CF3 group at the 21-position of TBIP does not seem to service the HOMO and LUMO, meaning that the –CF3 group is not involved in the role of donor–acceptor. Additionally, in the ESP map (Fig. 14), the electrostatic potential negative regions (shades of red/brownish yellow) associated with electrophilic attack are mainly located in the N atoms, –CF3 group, and phenyl ring. However, positive potential regions (shades of blue) are located around hydrogen atoms and the –CH3 group, which are possible sites for nucleophilic attack. Thus, it can be rationally concluded that these compounds have two or three major adsorption activity sites, bearing N atoms, a –CF3 group, and phenyl ring. The values of the quantum chemical parameters (EHOMO, ELUMO, and ΔE) are given in Table 8. Previous studies34,35 have reported that molecules with high EHOMO values give greater electron donation capabilities, and conversely, the lower the ELUMO values, the stronger the acceptance of electronic ability. As shown in Table 8, the EHOMO values obey the order: EHOMO,MBIP > EHOMO,BIP > EHOMO,TBIP, which is in the same order as the inhibition efficiency of η(MBIP) > η(BIP) > η(TBIP). This shows that there is a good correlation between η and EHOMO. While, the values of ELUMO obey the order: ELUMO,TBIP < ELUMO,MBIP < ELUMO,BIP, which is inconsistent with the results obtained by experiment, and may be affected by the complex interaction of the adsorption process.4 The other fundamental parameter in Table 8 is the separation energy (ΔE = ELUMO − EHOMO), which determines the adsorption activity of inhibitor molecules on a metal surface. The lower the ΔE value, the stronger the reactivity of the corrosion inhibitor is. According to Table 8, the ΔE values of different inhibitors decreased in the order: ΔEMBIP < ΔEBIP < ΔETBIP, which illustrated that the adsorption capacity of MBIP among the studied inhibitors is the most stable and possesses a higher anti-corrosion ability.
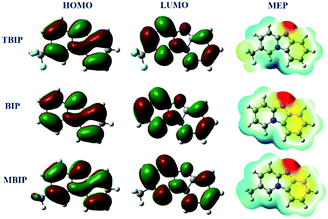 |
| | Fig. 14 The frontier orbital density distributions and 3D MEP plot of pyrido[1,2-a]benzimidazoles molecules. | |
Table 8 The calculated quantum chemical parameters for TBIP, BIP, and MBIP
| Compounds |
E
HOMO (eV) |
E
LUMO (eV) |
ΔE (eV) |
ΔN |
μ (D) |
| TBIP |
−5.86 |
−1.43 |
4.43 |
0.26 |
1.43 |
| BIP |
−5.47 |
−1.36 |
4.11 |
0.34 |
3.36 |
| MBIP |
−5.39 |
−1.39 |
4.00 |
0.36 |
3.77 |
The relationship between corrosion inhibition and the molecular structure can also be analyzed and predicted using the fraction of transfer electrons (ΔN). A perusal of the literature36 revealed that the work function (Φ) of a metal surface is an appropriate measure of its electronegativity, and the fraction of electrons (ΔN) can be calculated by eqn (16):
| |  | (16) |
where
χ and
η are the absolute electronegativity and global hardness, respectively, as indicated by
eqn (17) and (18):
| |  | (17) |
| |  | (18) |
In eqn (16), the value of ηFe is 0 eV and Φ obtained from DFT calculations was 4.82 eV for the Fe(110) plane. As reported previously,36 if ΔN > 0, the electrons transfer from the inhibitor to the metal and vice versa if ΔN < 0. As shown in Table 8, the three inhibitors have positive ΔN values, which mean the pyrido[1,2-a]benzimidazoles inhibitor molecule generates coordination bonds that donate electrons to the empty d-orbital of the Fe atom. The ability of the inhibitor molecule to donate electrons follows the order: ΔNMBIP > ΔNBIP > ΔNTBIP, which is consistent with the results obtained by the weight loss tests and electrochemical measurements. This result suggests that the ability of pyrido[1,2-a]benzimidazoles to inhibit metal corrosion depends on its high proportion of electrons donated to the metal. In addition, μ, which is regarded as an important index related to the inhibition efficiency, is another meaningful parameter in Table 8. The adsorption capacity of inhibitor molecules may be enhanced by a large value of μ though the electronic force.37 As shown in Table 8, the values of μ follow the order: μ(MBIP) > μ(BIP) > μ(TBIP), which is in agreement with the inhibition efficiency of the experimental chapters, and implies that the better inhibitive performance of pyrido[1,2-a]benzimidazoles is derived from intermolecular electrostatic force to some extent.
Molecular dynamics simulation
The adsorption behavior of the studied inhibitors on mild steel surface was also investigated using molecular dynamics simulation, which has emerged as a powerful tool to study the adsorption nature of inhibitor molecules on a metallic surface. In the geometric optimization process, atomic coordinates were adjusted based on the COMPASS force field38,39 until the total energy of a single structure was minimized. Also, a system containing 500 water molecules, 5H3O+, 5Cl−, and one molecule of the tested inhibitors was constructed to simulate the actual aggressive medium. After 500![[thin space (1/6-em)]](https://www.rsc.org/images/entities/char_2009.gif) 000 steps, the system reached equilibrium, which explains that both the temperature and energy reach balance. Fig. 15 represents the top and side views of the inhibitor molecules adsorbed on the Fe(110) surface. It can be clearly seen from Fig. 15 that the studied inhibitor was adsorbed on the Fe(110) surface almost parallel or flat when the system reached equilibrium, indicating that the inhibitor molecules has a strong interaction between active sites and iron atoms. Moreover, the interaction and binding energies of the adsorption of inhibitors on the Fe(110) surface were calculated and are listed in Table 8. Additionally, the binding energy values can also be used to explain the adsorption capabilities of the molecules. These displayed a higher value of binding energy, and the more stable adsorption of inhibitor molecules on the Fe surface. As shown in Table 9, it is quite clear that the Ebinding of the tested inhibitors and Fe(110) surface follows the order: MBIP > BIP > TBIP. This reflects that MBIP has a better capability for adsorption than the others, and these outcomes agree well with the experimental evaluation results as well as the inference of the quantum chemical calculations.
000 steps, the system reached equilibrium, which explains that both the temperature and energy reach balance. Fig. 15 represents the top and side views of the inhibitor molecules adsorbed on the Fe(110) surface. It can be clearly seen from Fig. 15 that the studied inhibitor was adsorbed on the Fe(110) surface almost parallel or flat when the system reached equilibrium, indicating that the inhibitor molecules has a strong interaction between active sites and iron atoms. Moreover, the interaction and binding energies of the adsorption of inhibitors on the Fe(110) surface were calculated and are listed in Table 8. Additionally, the binding energy values can also be used to explain the adsorption capabilities of the molecules. These displayed a higher value of binding energy, and the more stable adsorption of inhibitor molecules on the Fe surface. As shown in Table 9, it is quite clear that the Ebinding of the tested inhibitors and Fe(110) surface follows the order: MBIP > BIP > TBIP. This reflects that MBIP has a better capability for adsorption than the others, and these outcomes agree well with the experimental evaluation results as well as the inference of the quantum chemical calculations.
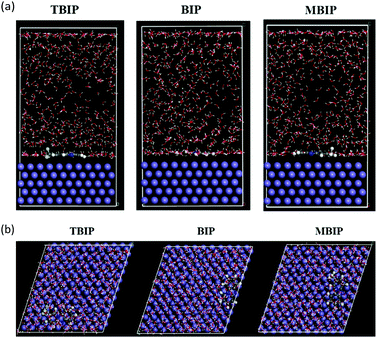 |
| | Fig. 15 Equilibrium adsorption configuration of the inhibitors: (a) side view and (b) top view. | |
Table 9 Interaction energy and binding energy values between the inhibitors and Fe(110) surface
| System |
E
Interaction (kJ mol−1) |
E
Binding (kJ mol−1) |
| Fe + TBIP + 500H2O + 5H3O+ + 5Cl− |
−800.01 |
800.01 |
| Fe + BIP + 500H2O + 5H3O+ + 5Cl− |
−889.58 |
889.58 |
| Fe + MBIP + 500H2O + 5H3O+ + 5Cl− |
−915.76 |
915.76 |
Fig. 16 shows the radial distribution functions of C, N, and F of the inhibitors and Fe atoms. It is generally believed that the peak values around 3.5 Å or less in a radial distribution function curve indicate that a chemical bond is formed between the atoms, whereas those of more than 3.5 Å are associated with the physical interaction.38 By careful inspection of Fig. 8, it can be seen that the peak distances of C, N, and F are within the range of 2.9 to 3.3 Å from the Fe surface. Following the literature value,38 one can conclude that the obtained range of peak distance represents the formation of a covalent bond, which occurs mostly due to chemisorption.
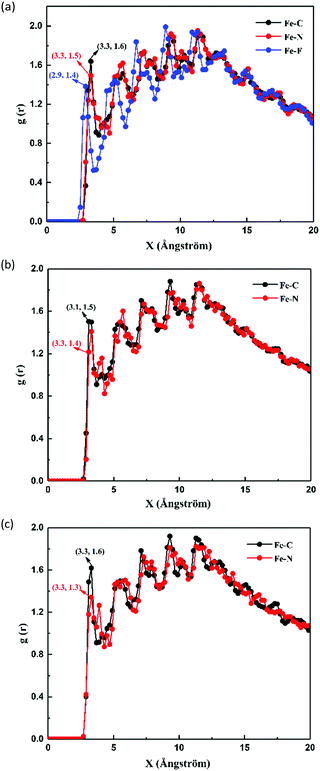 |
| | Fig. 16 Radial distribution functions of inhibitors adsorbed on the Fe(110) surface: (a) TBIP, (b) BIP, and (c) MBIP. | |
Conclusions
For the first time, pyrido[1,2-a]benzimidazoles were found to be effective inhibitors for mild steel corrosion in HCl solution. MBIP, BIP, and TBIP exhibited excellent inhibition performance, and their inhibition efficiency followed the order of η(MBIP) > η(BIP) > η(TBIP). Potentiodynamic polarization curve results showed that three compounds belonged to mixed-type inhibitors, which primarily inhibited cathodic reaction, and the adsorption on the steel surface followed a Langmuir adsorption isotherm with both physical adsorption and chemical adsorption. Surface morphology by SEM and XPS indicated that the adsorption film of pyrido[1,2-a]benzimidazoles on the steel surface effectively inhibited the corrosion process. Besides, the quantum chemical parameters proved that the adsorption activity centers were mainly phenyl ring and N atoms, which play an important role in the corrosion resistance of steel. MD simulations also revealed that the interaction and binding energies of the three studied inhibitors followed the order: MBIP > BIP > TBIP, which firmly supports the experimentally obtained results. This research gives an inspiration to design reasonable routes to modify the studied inhibitors to improve their inhibitive ability.
Conflicts of interest
There are no conflicts to declare.
Acknowledgements
This work was funded by the National Natural Science Foundation of China (21672046, 21372054, 21503056), and the Fundamental Research Funds for the Central Universities (HIT.NSRIF.201701).
Notes and references
- W. W. Zhang, H. L. Li, Y. W. Wang, Y. Liu, Q. Z. Gu and Y. C. Wu, New J. Chem., 2018, 42, 12649–12665 RSC.
- N. Soltani, M. Behpour, E. E. Oguzie, M. Mahluji and M. A. Ghasemzadeh, RSC Adv., 2015, 5, 11145–11162 RSC.
- P. Singh, V. Srivastava and M. A. Quraishi, J. Mol. Liq., 2016, 216, 164–173 CrossRef CAS.
- W. W. Zhang, R. Ma, S. Li, Y. Liu and L. Niu, Chem. Res. Chin. Univ., 2016, 32, 827–837 CrossRef CAS.
- C. Verma, L. O. Olasunkanmi, I. B. Obot, E. E. Ebenso and M. A. Quraishi, RSC Adv., 2016, 6, 53933–53948 RSC.
- L. O. Olasunkanmi, I. B. Obot, M. M. Kabanda and E. E. Ebenso, J. Phys. Chem. C, 2015, 119, 16004–16019 CrossRef CAS.
- H. Elmsellem, N. Basbas, A. Chetouani, A. Aouniti, S. Radi, M. Messali and B. Hammouti, Port. Electrochim. Acta, 2014, 32, 77–108 CrossRef.
- M. Behpour and S. M. Ghoreishi,
et al.
, Corros. Sci., 2010, 52, 4046–4057 CrossRef CAS.
- W. W. Zhang, R. Ma, H. H. Liu, Y. Liu, S. Li and L. Niu, J. Mol. Liq., 2016, 222, 671–679 CrossRef CAS.
- X. Li, S. Deng and H. Fu, Corros. Sci., 2012, 52, 280–288 CrossRef.
- W. W. Zhang, H. J. Li, Y. W. Wang, Y. Liu and Y. C. Wu, Mater. Corros., 2018, 69, 1638–1648 CrossRef CAS.
- M. Mahdavian and S. Ashhari, Electrochim. Acta, 2010, 55, 1720–1724 CrossRef CAS.
- Y. J. Xie, J. Wu, X. Z. Che, Y. Chen, H. W. Huan and G. J. Deng, Green Chem., 2016, 18, 667–671 RSC.
- F. Zhang, Y. M. Tang, Z. Y. Cao, W. H. Jing, Z. L. Wu and Y. Z. Chen, Corros. Sci., 2012, 61, 1–9 CrossRef CAS.
- A. Zarrouk, B. Hammouti, T. Lakhlifi and F. Bentiss, Corros. Sci., 2015, 90, 572–584 CrossRef CAS.
-
M. J. Frisch, G. W. Trucks, H. B. Schlegel, G. E. Scuseria, M. A. Robb, J. R. Cheeseman, G. Scalmani, V. Barone, B. Mennucci, G. A. Petersson, H. Nakatsuji, M. Caricato, X. Li, H. P. Hratchian, A. F. Izmaylov, J. Bloino, G. Zheng, J. L. Sonnenberg, M. Hada, M. Ehara, K. Toyota, R. Fukuda, J. Hasegawa, M. Ishida, T. Nakajima, Y. Honda, O. Kitao, H. Nakai, T. Vreven, J. A. Montgomery, Jr., J. E. Peralta, F. Ogliaro, M. Bearpark, J. J. Heyd, E. Brothers, K. N. Kudin, V. N. Staroverov, T. Keith, R. Kobayashi, J. Normand, K. Raghavachari, A. Rendell, J. C. Burant, S. S. Iyengar, J. Tomasi, M. Cossi, N. Rega, J. M. Millam, M. Klene, J. E. Knox, J. B. Cross, V. Bakken, C. Adamo, J. Jaramillo, R. Gomperts, R. E. Stratmann, O. Yazyev, A. J. Austin, R. Cammi, C. Pomelli, J. W. Ochterski, R. L. Martin, K. Morokuma, V. G. Zakrzewski, G. A. Voth, P. Salvador, J. J. Dannenberg, S. Dapprich, A. D. Daniels, O. Farkas, J. B. Foresman, J. V. Ortiz, J. Cioslowski and D. J. Fox, Gaussian 09, Revision D.01, Gaussian, Inc., Wallingford, CT, 2010 Search PubMed.
- E. A. Noor and A. H. Al-Moubaraki, Mater. Chem. Phys., 2008, 110, 145–154 CrossRef CAS.
- J. Aljourani, K. Raeissi and M. A. Golozar, Corros. Sci., 2009, 51, 1836–1843 CrossRef CAS.
- Y. M. Tang, F. Zhang, S. Hu, Z. Cao, Z. Wu and W. Jing, Corros. Sci., 2013, 74, 271–282 CrossRef CAS.
- S. A. Abd El-Maksoud and A. S. Fouda, Mater. Chem. Phys., 2005, 93, 84–90 CrossRef CAS.
- M. D. Gurudatt and K. N. Mohana, Ind. Eng. Chem. Res., 2014, 53, 2092–5105 CrossRef.
- L. Afia, N. Rezki, M. R. Aouad, A. Zarrouk, H. Zarrok, R. Salghi, B. Hammouti, M. Messali and S. S. Al-Deyab, Int. J. Electrochem. Sci., 2013, 8, 4346–4360 CAS.
- O. Krim, A. Elidrissi, B. Hammouti and A. Ouslim, Chem. Eng. Commun., 2009, 193, 1536–1546 CrossRef.
- R. Yildiz, A. Donerb, T. Doganc and I. Dehria, Corros. Sci., 2014, 82, 125–132 CrossRef CAS.
- A. Dutta, S. K. Saha, P. Banerjee and D. Sukul, Corros. Sci., 2015, 98, 541–550 CrossRef CAS.
- K. F. Khaled, Electrochim. Acta, 2003, 48, 2493–2503 CrossRef CAS.
- A. H. El-Askalany, S. I. Mostafa, K. Shalabi, A. M. Eid and S. Shaaban, J. Mol. Liq., 2016, 223, 497–508 CrossRef CAS.
- D. B. Hmamou, R. Salghi, A. Zarrouk, M. R. Aouad, O. Benali, H. Zarrok, M. Messali, B. Hammouti, M. Bouachrine and E. E. Ebenso, Ind. Eng. Chem. Res., 2013, 52, 14315–14327 CrossRef CAS.
- K. Vimal Kumar and B. V. Appa Rao, New J. Chem., 2017, 41, 6278–6289 RSC.
- L. Niu, Y. Yin, W. Guo, M. Lu, R. Qin and S. Chen, J. Mater. Sci., 2009, 44, 4511–4521 CrossRef CAS.
- H. Ouici, M. Tourabi, O. Benali, C. Selles, C. Jama, A. Zarrouk and F. Bentiss, J. Electroanal. Chem., 2017, 803, 125–134 CrossRef CAS.
- Y. Guo, M. Gao, H. F. Wang and Z. Y. Liu, Int. J. Electrochem. Sci., 2017, 12, 1401–1420 CrossRef CAS.
- S. Neodo, D. Carugo, J. A. Wharton and K. R. Stokes, J. Electroanal. Chem., 2013, 695, 38–46 CrossRef CAS.
- W. W. Zhang, H. J. Li, M. R. Wang, L. J. Wang, F. Shang and Y. C. Wu, J. Phys. Chem. C, 2018, 122, 25349–25364 CrossRef CAS.
- W. W. Zhang, H. J. Li, Y. C. Wu, Q. Luo, H. H. Liu and L. Niu, Chem. Res. Chin. Univ., 2018, 34, 817–822 CrossRef CAS.
- S. K. Saha and P. Banerjee, Mater. Chem. Front., 2018, 2, 1674–1691 RSC.
- W. Li, Q. He, C. Pei and B. Hou, Electrochim. Acta, 2007, 52, 6386–6394 CrossRef CAS.
- N. K. Gupta, C. Verma, R. Salghi, H. Lgaz, A. K. Mukherjee and M. A. Quraishi, New J. Chem., 2017, 41, 13114–13129 RSC.
- A. Dutta, S. K. Saha, U. Adhikari, P. Banerjee and D. Sukul, Corros. Sci., 2017, 123, 256–266 CrossRef CAS.
|
| This journal is © The Royal Society of Chemistry and the Centre National de la Recherche Scientifique 2019 |
Click here to see how this site uses Cookies. View our privacy policy here.  *a
*a

 ) represent the standard deviations (%).


![[thin space (1/6-em)]](https://www.rsc.org/images/entities/char_2009.gif) vcorrvs. 1/T for steel in 1 mol L−1 HCl in the absence and presence of inhibitors.
vcorrvs. 1/T for steel in 1 mol L−1 HCl in the absence and presence of inhibitors.


![[thin space (1/6-em)]](https://www.rsc.org/images/entities/char_2009.gif) ln(55.5Kads)
ln(55.5Kads)


![[double bond, length as m-dash]](https://www.rsc.org/images/entities/char_e001.gif) C, and C–H aromatic bonds, and another peak located at 286.7 eV was related to C–N and C
C, and C–H aromatic bonds, and another peak located at 286.7 eV was related to C–N and C![[double bond, length as m-dash]](https://www.rsc.org/images/entities/char_e001.gif) N bonds in pyrido[1,2-a]benzimidazole ring. The peak at 288.9 eV, which has a higher binding energy, was attributed to C
N bonds in pyrido[1,2-a]benzimidazole ring. The peak at 288.9 eV, which has a higher binding energy, was attributed to C![[double bond, length as m-dash]](https://www.rsc.org/images/entities/char_e001.gif) N+ structures and may be caused by the proton of the
N+ structures and may be caused by the proton of the ![[double bond, length as m-dash]](https://www.rsc.org/images/entities/char_e001.gif) N– structure in the pyrido[1,2-a]benzimidazole ring.31,32 N 1s peaks (Fig. 12b) at 399.7 eV, 400.8 eV, and 401.5 eV could be observed, with the first peak assigned to C–N and the unprotonated N atoms (
N– structure in the pyrido[1,2-a]benzimidazole ring.31,32 N 1s peaks (Fig. 12b) at 399.7 eV, 400.8 eV, and 401.5 eV could be observed, with the first peak assigned to C–N and the unprotonated N atoms (![[double bond, length as m-dash]](https://www.rsc.org/images/entities/char_e001.gif) N– structure),10,15 while the peak at 400.8 eV represents N–Fe groups due to the nitrogen atoms bonded to iron atoms. Actually, the coordination of a nitrogen atom with an iron atom (N–Fe) can produce a higher binding energy than an uncoordinated
N– structure),10,15 while the peak at 400.8 eV represents N–Fe groups due to the nitrogen atoms bonded to iron atoms. Actually, the coordination of a nitrogen atom with an iron atom (N–Fe) can produce a higher binding energy than an uncoordinated ![[double bond, length as m-dash]](https://www.rsc.org/images/entities/char_e001.gif) N– structure.15 The third peak at 401.5 eV was ascribed to the protonated nitrogen, which gives rise to positive polarization nitrogen atoms, leading to a larger binding energy.10 The Fe 2p3/2 (Fig. 12c) showed three peaks around 710.7 eV, 713.4 eV, and 715.2 eV. The first peak at 710.7 eV was attributed to ferric compounds, which came from Fe2O3 (i.e., Fe3+ oxide) and FeOOH (i.e., oxyhydroxide). Another peak appearing at 713.4 eV was due to the presence of FeCl3 in the hydrochloric acid solution, while the last peak at 715.2 eV was assigned to the satellite of Fe(III).32
N– structure.15 The third peak at 401.5 eV was ascribed to the protonated nitrogen, which gives rise to positive polarization nitrogen atoms, leading to a larger binding energy.10 The Fe 2p3/2 (Fig. 12c) showed three peaks around 710.7 eV, 713.4 eV, and 715.2 eV. The first peak at 710.7 eV was attributed to ferric compounds, which came from Fe2O3 (i.e., Fe3+ oxide) and FeOOH (i.e., oxyhydroxide). Another peak appearing at 713.4 eV was due to the presence of FeCl3 in the hydrochloric acid solution, while the last peak at 715.2 eV was assigned to the satellite of Fe(III).32


![[thin space (1/6-em)]](https://www.rsc.org/images/entities/char_2009.gif) 000 steps, the system reached equilibrium, which explains that both the temperature and energy reach balance. Fig. 15 represents the top and side views of the inhibitor molecules adsorbed on the Fe(110) surface. It can be clearly seen from Fig. 15 that the studied inhibitor was adsorbed on the Fe(110) surface almost parallel or flat when the system reached equilibrium, indicating that the inhibitor molecules has a strong interaction between active sites and iron atoms. Moreover, the interaction and binding energies of the adsorption of inhibitors on the Fe(110) surface were calculated and are listed in Table 8. Additionally, the binding energy values can also be used to explain the adsorption capabilities of the molecules. These displayed a higher value of binding energy, and the more stable adsorption of inhibitor molecules on the Fe surface. As shown in Table 9, it is quite clear that the Ebinding of the tested inhibitors and Fe(110) surface follows the order: MBIP > BIP > TBIP. This reflects that MBIP has a better capability for adsorption than the others, and these outcomes agree well with the experimental evaluation results as well as the inference of the quantum chemical calculations.
000 steps, the system reached equilibrium, which explains that both the temperature and energy reach balance. Fig. 15 represents the top and side views of the inhibitor molecules adsorbed on the Fe(110) surface. It can be clearly seen from Fig. 15 that the studied inhibitor was adsorbed on the Fe(110) surface almost parallel or flat when the system reached equilibrium, indicating that the inhibitor molecules has a strong interaction between active sites and iron atoms. Moreover, the interaction and binding energies of the adsorption of inhibitors on the Fe(110) surface were calculated and are listed in Table 8. Additionally, the binding energy values can also be used to explain the adsorption capabilities of the molecules. These displayed a higher value of binding energy, and the more stable adsorption of inhibitor molecules on the Fe surface. As shown in Table 9, it is quite clear that the Ebinding of the tested inhibitors and Fe(110) surface follows the order: MBIP > BIP > TBIP. This reflects that MBIP has a better capability for adsorption than the others, and these outcomes agree well with the experimental evaluation results as well as the inference of the quantum chemical calculations.


