Avidin-adsorbed peptide–calcium phosphate composites exhibiting high biotin-binding activity†
Suzuka
Kojima
 ab,
Fukue
Nagata
b,
Masahiko
Inagaki
b,
Shinichi
Kugimiya
a and
Katsuya
Kato
*b
aMaterials Chemistry Course, Graduate School of Engineering, Aichi Institute of Technology, 1247 Yachigusa, Yakusa-cho, Toyota, Aichi 470-0392, Japan. E-mail: suzuka-kojima@aist.go.jp
bNational Institute of Advanced Industrial Science and Technology, 2266-98, Anagahora, Shimo-Shidami, Moriyama-ku, Nagoya, Aichi 463-8560, Japan. E-mail: katsuya-kato@aist.go.jp; Fax: +81 52 736 7405; Tel: +81 52 736 7551
First published on 19th November 2018
Abstract
Techniques harnessing the strong interactions of the avidin–biotin system are frequently used in biosensing and protein separation. Hydroxyapatite (Ca10(PO4)6(OH)2, HAp) is a calcium phosphate compound known to have a strong affinity for various proteins. In this study, the adsorption ability of avidin on composites and its binding activity to biotin were investigated using two types of poly(L-glutamic acid)-containing calcium phosphate composites (pGlu-HAp). The morphologies of pGlu-HAp including poly(α-glutamic acid) and poly(γ-glutamic acid) showed plate-like and sheet-like particles, respectively, due to the effects of the peptide structure. Furthermore, these particles exhibited the high adsorption capacity of avidin; the maximum adsorption amounts for poly(α-glutamic acid)-HAp and poly(γ-glutamic acid)-HAp were 776 and 302 μg mg−1 HAp, respectively. In addition, the equilibrium data for the adsorption of avidin on two pGlu-HAp-fitted Langmuir isotherm models correspond to a monolayer. The difference in the amount of adsorbed avidin on the two pGlu-HAp composites was influenced by the density of the carboxyl groups in pGlu-HAp. This revealed that avidin adsorbed on pGlu-HAp was able to bind four biotin molecules, and biotinylated protein was separated from protein mixtures by avidin-adsorbed pGlu-HAp. These results indicate that these particles would be appropriate in the development of biosensing and bioseparation tools.
1. Introduction
Biosensors have a range of applications in various fields such as biotechnology and environmental sciences, and proteins, including enzymes and antibodies, have been widely used as important elements in biosensors.1–5 For example, enzyme immunoassays and enzyme-linked immunosorbent assays, designated as immunoassays, are techniques that detect and quantify small amounts of chemicals using enzyme-based or antibody-based biosensors.6,7The avidin–biotin system has unique properties and uses in the field of biotechnology. Avidin is a basic protein, and each of the four subunits within it has one binding site for biotin. An objective protein separation from the protein mixture is difficult; therefore, specific proteins are detected using antibodies and target probes. Biotin labelling occurs independently of the structure and function of the target reagent; in other words, protein separation can be safely performed via the biotinylation process. The materials functionalised with the avidin–biotin system have potential applications in drug delivery, marker systems and enzyme immunoassays because of the strong and highly selective interaction between avidin and biotin.8–12
Calcium phosphate, especially hydroxyapatite (Ca10(PO4)6(OH)2, HAp), is an inorganic constituent of bone and tooth; therefore, HAp has excellent biocompatible, bioactive and ecological properties. In particular, HAp holds an important position among biosensing and immunoassay technology for its strong affinity to proteins or enzymes.13–15 Jeon et al. reported a method for the covalent conjugation of the hydrophobic surface protein, lipase, on HAp. The lipase-conjugated HAp showed higher activity than the free form of lipase and is suitable as a supporting material in biocatalyst immobilization.16 Ding et al. presented gold/HAp hybrid nanomaterials, and it is expected that these materials would act as a new piezoelectric immunosensor for the detection of α-fetoprotein.17 For the development of highly sensitive biosensors, it is necessary to develop the proteins adsorbed on HAp with relatively high selectivity and potential stability for protein adsorption.
The synthesis of calcium phosphate composites with polymers has been widely developed.18 Xu et al. synthesized HAp/Au/polyelectrolyte hybrid materials with hollow hierarchical structures. These hybrid microparticles exhibited highly attractive properties for drug delivery.19 Jiang et al. produced hierarchical hollow HAp microspheres using polyaspartic acid via hydrothermal processes. They suggested that the main role of polyaspartic acid in the formation of hollow HAp microspheres and hollow HAp could be its selective adsorption of the heavy metal ion Pb2+.20 We have previously reported peptide-containing calcium phosphate particles (peptide–HAp) with high selectivities for protein adsorption.21 This selective adsorption of proteins was the result of electrostatic interactions between peptide–HAp and the protein, and the peptide–HAp was expected to be adapted for application in devices in biosensing and immunoassays.
In our previous report, avidin adsorbed on mesoporous silica was observed to bind to only two biotin molecules per avidin molecule.22 In the present study, two types of poly(L-glutamic acid) with a carboxyl group, poly(α-glutamic acid) and poly(γ-glutamic acid), were chosen for the synthesis of poly(L-glutamic acid)-containing HAp (pGlu-HAp), and their adsorption capacities for avidin on composites and their binding ability to biotin were evaluated. Furthermore, to confirm the effects of the difference in the structure of the peptides, the particle morphologies and adsorption behaviour of the proteins for each pGlu-HAp material were analysed. In addition, we investigated the selective binding ability of the biotinylated protein to avidin adsorbed on pGlu-HAp from the mixture of biotin-labelled and unlabelled protein.
2. Experimental
2.1 Materials
All chemicals were of analytical reagent grade and were used without further purification. poly(L-glutamic acid sodium salt) (α-pGlu; molecular weight (Mw) > 12![[thin space (1/6-em)]](https://www.rsc.org/images/entities/char_2009.gif) 000) was sourced from Peptide Institute, Inc. (Osaka, Japan). Poly-γ-glutamic acid (γ-pGlu; Mw = 200
000) was sourced from Peptide Institute, Inc. (Osaka, Japan). Poly-γ-glutamic acid (γ-pGlu; Mw = 200![[thin space (1/6-em)]](https://www.rsc.org/images/entities/char_2009.gif) 000–500
000–500![[thin space (1/6-em)]](https://www.rsc.org/images/entities/char_2009.gif) 000), calcium acetate monohydrate ((CH3COO)2Ca·H2O), diammonium hydrogen phosphate ((NH4)2HPO4), avidin from egg white (isoelectric point (pI) = 10, Mw = 67
000), calcium acetate monohydrate ((CH3COO)2Ca·H2O), diammonium hydrogen phosphate ((NH4)2HPO4), avidin from egg white (isoelectric point (pI) = 10, Mw = 67![[thin space (1/6-em)]](https://www.rsc.org/images/entities/char_2009.gif) 000 Da) and sodium chloride (NaCl) were purchased from Wako Pure Chemical Industries (Osaka, Japan). Biotin (5-fluorescein) conjugate (biotin–FITC; Mw = 645), human serum albumin (HSA; pI = 4.7, Mw = 66
000 Da) and sodium chloride (NaCl) were purchased from Wako Pure Chemical Industries (Osaka, Japan). Biotin (5-fluorescein) conjugate (biotin–FITC; Mw = 645), human serum albumin (HSA; pI = 4.7, Mw = 66![[thin space (1/6-em)]](https://www.rsc.org/images/entities/char_2009.gif) 400 Da), transferrin human (pI = 5.2–5.9, Mw = 76
400 Da), transferrin human (pI = 5.2–5.9, Mw = 76![[thin space (1/6-em)]](https://www.rsc.org/images/entities/char_2009.gif) 500 Da) and transferrin–biotin labelled human were obtained from Sigma Aldrich Co. (St. Louis, MO). N-Hydroxysuccinimide (NHS; Mw = 115.1), 1-ethyl-3-(3-dimethylaminopropyl)carbodiimide hydrochloride (EDC; Mw = 191.7) and 5-aminofluorescein (Mw = 347.3) were purchased from Tokyo Kasei Kogyo Co. (Tokyo, Japan). NanoBio Blocker was received from Nano Bio Tech Co. (Tokyo, Japan). EzApply, EzStain Aqua, EzStandard Prestain Blue and e-PAGEL were obtained from ATTO Co. (Tokyo, Japan). The Bio-Rad Protein Assay was purchased from Bio-Rad Laboratories (Hercules, CA).
500 Da) and transferrin–biotin labelled human were obtained from Sigma Aldrich Co. (St. Louis, MO). N-Hydroxysuccinimide (NHS; Mw = 115.1), 1-ethyl-3-(3-dimethylaminopropyl)carbodiimide hydrochloride (EDC; Mw = 191.7) and 5-aminofluorescein (Mw = 347.3) were purchased from Tokyo Kasei Kogyo Co. (Tokyo, Japan). NanoBio Blocker was received from Nano Bio Tech Co. (Tokyo, Japan). EzApply, EzStain Aqua, EzStandard Prestain Blue and e-PAGEL were obtained from ATTO Co. (Tokyo, Japan). The Bio-Rad Protein Assay was purchased from Bio-Rad Laboratories (Hercules, CA).
2.2 Synthesis of pGlu-HAp particles
Poly(α-glutamic acid) or poly(γ-glutamic acid) with 10, 20 or 30 mg of each peptide was dissolved in 15 mM of (CH3COO)2Ca solution (200 mL).20 After stirring for 30 min at 20 °C, 9 mM of (NH4)2HPO4 solution (200 mL) was added to the mixture to set the Ca/P molar ratio to 1.67. After the reaction temperature was increased to 60 °C at a heating rate of 1 °C min−1, this mixture was stirred for a further 3 h at 60 °C, and the pH was recorded during this reaction. Particles were collected by centrifugation at 6000 rpm for 10 min, and the obtained materials were washed with deionised water and freeze-dried.2.3 Characterization of synthesized pGlu-HAp
The morphologies of pGlu-HAp were visualised by field-emission scanning electron microscopy (FE-SEM; S-4300, Hitachi Ltd, Tokyo, Japan) at an accelerating voltage of 10.0 kV and then by transmission electron microscopy (TEM; JEM-2010, JEOL Ltd, Tokyo, Japan) operated at 200 kV. To determine the specific surface area and pore volume, synthesized pGlu-HAp was measured by the Brunauer–Emmett–Teller (BET; TriStar 3000, Shimadzu Co., Kyoto, Japan) method and by obtaining nitrogen (N2) adsorption and desorption isotherms, respectively. The pore size distribution was obtained using the Barrett–Joyner–Halenda (BJH) method. To confirm the crystallinity of the precipitates, powder X-ray diffraction (XRD) analysis was performed with a RINT2000/PC (Rigaku Co., Tokyo, Japan) using CuKα radiation generated at 40 kV and 30 mA. The 2θ range was from 3.0° to 60.0° with a scanning speed of 2.0° min−1. The Ca/P molar ratio was determined using inductively coupled plasma optical emission spectrometry (ICP-OES; IRIS Advantage, Thermo Fisher Scientific Inc., Waltham, MA). To confirm the presence of peptide and HAp in pGlu-HAp, Fourier transform infra-red (FT-IR; FT/IR-4700, JASCO Co., Tokyo, Japan) spectroscopy was carried out according to the attenuated total reflection method. The presence of peptide in pGlu-HAp was confirmed using scanning transmission electron microscopy (STEM; JEOL JEM-2100 Plus instrument, JEOL Ltd, Tokyo, Japan) at a voltage of 200 kV. The peptide content in the pGlu-HAp composites was determined by thermogravimetry and differential thermal analysis (TG–DTA) using a Thermo Plus TG 8120 (Rigaku Co., Tokyo, Japan). TG–DTA measurements were carried out at a range of temperatures between room temperature and 1000 °C at a heating rate of 10 °C min−1. The surface potential of the particles was calculated with a ζ-potential analyser (ELSZ-1000, Otsuka Electronics Co., Tokyo, Japan). All the samples were suspended in 10 mM phosphate buffer with pH 7.0 by sonication for 3 min before the ζ-potential analysis.2.4 Protein adsorption on pGlu-HAp
Protein adsorption experiments were performed using avidin, HSA and transferrin. Proteins were dissolved in 10 mM phosphate buffer (pH 7.0). Six types of pGlu-HAp samples (5 mg) and 1 mL of protein solution (500 μg mL−1) were mixed. After stirring overnight at 20 °C, the supernatant was separated by centrifugation at 14![[thin space (1/6-em)]](https://www.rsc.org/images/entities/char_2009.gif) 000 rpm for 5 min. The protein in the supernatant was evaluated by the Bradford protein assay using UV-vis spectroscopy (λ = 595 nm) (Infinite F200 PRO, Tecan Group Ltd, Männedorf, Switzerland). Following this, the amount of avidin adsorbed on pGlu-HAp was calculated as follows:
000 rpm for 5 min. The protein in the supernatant was evaluated by the Bradford protein assay using UV-vis spectroscopy (λ = 595 nm) (Infinite F200 PRO, Tecan Group Ltd, Männedorf, Switzerland). Following this, the amount of avidin adsorbed on pGlu-HAp was calculated as follows: | (1) |
2.5 Adsorption behaviour of avidin on pGlu-HAp
The adsorption capacity of avidin in pGlu-HAp can be expressed by an adsorption isotherm. In this study, equilibrium data were analysed using Langmuir and Freundlich isotherm models.23–26 The equilibrium data were fitted to two common isotherm models to observe the interaction between avidin and pGlu-HAp.The Langmuir isotherm model refers to monolayer adsorption on the surface of pGlu-HAp and can be expressed as follows:
 | (2) |
The Freundlich isotherm model is used to describe heterogeneous systems. The equation assumes an empirical equation and is described by the following equation:
 | (3) |
2.6 Determination of the density of the carboxyl group in pGlu-HAp
Each pGlu-HAp (1 mg) was added to a mixture of 500 μL of EDC solution (42.9 mg/3 mL in 10 mM phosphate buffer at pH 7.0) and 500 μL of NHS solution (5.1 mg/3 mL in the same buffer) and stirred for 3 h at 20 °C. After centrifugation at 14![[thin space (1/6-em)]](https://www.rsc.org/images/entities/char_2009.gif) 000 rpm for 5 min, the precipitant was washed three times with the same phosphate buffer. The solid material was separated by centrifugation at 14
000 rpm for 5 min, the precipitant was washed three times with the same phosphate buffer. The solid material was separated by centrifugation at 14![[thin space (1/6-em)]](https://www.rsc.org/images/entities/char_2009.gif) 000 rpm for 5 min and added to 500 μL of the buffer. The suspension was mixed with 500 μL of 5-aminofluorescein solution (8 μg mL−1), and the mixture was stirred in the dark overnight at 20 °C. Following this, the precipitant was collected by centrifugation at 14
000 rpm for 5 min and added to 500 μL of the buffer. The suspension was mixed with 500 μL of 5-aminofluorescein solution (8 μg mL−1), and the mixture was stirred in the dark overnight at 20 °C. Following this, the precipitant was collected by centrifugation at 14![[thin space (1/6-em)]](https://www.rsc.org/images/entities/char_2009.gif) 000 rpm for 5 min, washed with the buffer, and resuspended in 1 mL of the buffer. To measure the carboxyl group density in the precipitant, the excitation and emission wavelengths were set to 494 and 521 nm, respectively.
000 rpm for 5 min, washed with the buffer, and resuspended in 1 mL of the buffer. To measure the carboxyl group density in the precipitant, the excitation and emission wavelengths were set to 494 and 521 nm, respectively.
2.7 Conformational changes in avidin adsorbed on pGlu-HAp
To investigate the conformational changes in avidin adsorbed on pGlu-HAp, the fluorescence of tryptophan residues was confirmed. The pGlu-HAp sample (1 mg) was mixed with 1 mL of avidin solution (500 μg mL−1 in 10 mM phosphate buffer at pH 7.0). After stirring the mixture overnight at 20 °C, the fluorescence of the tryptophans in avidin was measured using a spectrofluorophotometer (RF-5300PC, Shimadzu Co., Kyoto, Japan). The fluorescence emission spectra were measured using excitation and fluorescence wavelengths of 280 and 300–500 nm, respectively.2.8 Binding activity of biotin to avidin adsorbed on pGlu-HAp particles
Different amounts of avidin (from 100 μg to the maximum adsorption capacity) were adsorbed on each pGlu-HAp during the overnight stirring at 20 °C. After removal of the supernatant, 1 mL of the five-fold diluted blocking reagent (NanoBio Blocker) was added to the precipitant. The mixture was again stirred overnight at 20 °C and centrifuged at 14![[thin space (1/6-em)]](https://www.rsc.org/images/entities/char_2009.gif) 000 rpm for 5 min. The precipitant was washed with 10 mM phosphate buffer (pH 7.0), and the solid material was mixed with different volumes of biotin–FITC (20 μg mL−1). After incubation for 3 h at 4 °C, the supernatant was obtained by centrifugation at 14
000 rpm for 5 min. The precipitant was washed with 10 mM phosphate buffer (pH 7.0), and the solid material was mixed with different volumes of biotin–FITC (20 μg mL−1). After incubation for 3 h at 4 °C, the supernatant was obtained by centrifugation at 14![[thin space (1/6-em)]](https://www.rsc.org/images/entities/char_2009.gif) 000 rpm for 5 min. Finally, the binding activity of biotin to avidin was analysed using excitation and emission wavelengths of 485 and 535 nm, respectively.
000 rpm for 5 min. Finally, the binding activity of biotin to avidin was analysed using excitation and emission wavelengths of 485 and 535 nm, respectively.
2.9 Selective binding of biotinylated protein from the protein mixtures by avidin adsorbed on pGlu-HAp
To adsorb avidin onto the particles, α-pGlu-HAp (1 mg) was added to 1 mL of avidin solution (700 μg mL−1), and the mixture was stirred overnight at 20 °C. The precipitate was separated by centrifugation at 14![[thin space (1/6-em)]](https://www.rsc.org/images/entities/char_2009.gif) 000 rpm for 5 min and mixed with 1 mL of the five-fold diluted blocking reagent (NanoBio Blocker) overnight at 20 °C. After centrifugation at 14
000 rpm for 5 min and mixed with 1 mL of the five-fold diluted blocking reagent (NanoBio Blocker) overnight at 20 °C. After centrifugation at 14![[thin space (1/6-em)]](https://www.rsc.org/images/entities/char_2009.gif) 000 rpm for 5 min, the obtained solid material was washed with 10 mM phosphate buffer (pH 7.0) following which the composites were added to 1 mL of the protein mixture including HSA and transferrin–biotin (B–T) (100 μg of each protein), and the suspension was stirred overnight at 20 °C. The supernatant was obtained by centrifugation at 14
000 rpm for 5 min, the obtained solid material was washed with 10 mM phosphate buffer (pH 7.0) following which the composites were added to 1 mL of the protein mixture including HSA and transferrin–biotin (B–T) (100 μg of each protein), and the suspension was stirred overnight at 20 °C. The supernatant was obtained by centrifugation at 14![[thin space (1/6-em)]](https://www.rsc.org/images/entities/char_2009.gif) 000 rpm for 5 min. The proteins were analysed on 10% sulphate-polyacrylamide gel electrophoresis (SDS-PAGE; WSE-1100, ATTO Co., Tokyo, Japan) and visualised by staining with EzStain Aqua (ATTO Co., Tokyo, Japan).
000 rpm for 5 min. The proteins were analysed on 10% sulphate-polyacrylamide gel electrophoresis (SDS-PAGE; WSE-1100, ATTO Co., Tokyo, Japan) and visualised by staining with EzStain Aqua (ATTO Co., Tokyo, Japan).
3. Results and discussion
3.1 Morphologies of the synthesized pGlu-HAp particles
To confirm the effects of the difference in the structure of the peptides, the morphologies of peptide–HAp were observed using FE-SEM and TEM. The FE-SEM and TEM images of the morphologies of α-pGlu-HAp (30 mg) and γ-pGlu-HAp (30 mg) particles are shown in Fig. 1(A and B) and (a and b), respectively. α-pGlu-HAp (30 mg) exhibited plate-like particles with sizes of approximately 60 × 30 × 20 nm, whereas γ-pGlu-HAp (30 mg) showed sheet-like particles with sizes of approximately 100 × 100 × 10 nm. Additionally, Fig. S1 and S2 (ESI†) show the FE-SEM and TEM images of α-pGlu-HAp and γ-pGlu-HAp containing different amounts of peptides (10 and 20 mg). From these results, it can be considered that the particles grow plate-like or sheet-like structures according to an increase in the amount of peptides in pGlu-HAp.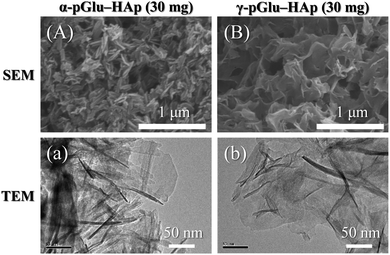 | ||
| Fig. 1 FE-SEM (A and B) and TEM (a and b) images of the peptide–HAp particles: (A and a) α-pGlu-HAp (30 mg) and (B and b) γ-pGlu-HAp (30 mg). | ||
The formation mechanism of these unique morphologies was analysed by measuring the pH value during the synthesis of α-pGlu-HAp (30 mg) and γ-pGlu-HAp (30 mg), as shown in Fig. S3 (ESI†). In the synthesis process of α-pGlu-HAp (30 mg), the change in pH from 6.5 to 6.0 was approximately 10 min shorter than that of γ-pGlu-HAp (30 mg). These results indicate that the pGlu-HAp particles–including α-pGlu easily formed HAp particles. In conclusion, it can be considered that peptides play a key role in the crystal growth of peptide–HAp composites27–29 and the morphology of peptide–HAp is greatly influenced by the difference in the structure and amount of peptides.
The surface properties of pGlu-HAp were characterised from the BET surface area and BJH pore size distribution. Fig. S4 (ESI†) shows the pore size distribution curves and the N2 adsorption–desorption isotherms of α-pGlu-HAp (10, 20 and 30 mg) and γ-pGlu-HAp (10, 20 and 30 mg) particles, and indicates type IV isotherms. The specific surface areas of α-pGlu-HAp (10, 20 and 30 mg) were 111, 120 and 128 m2 g−1, respectively (Table 1). In the case of γ-pGlu-HAp (10, 20 and 30 mg), the specific surface areas were 125, 135 and 108 m2 g−1, respectively. The pore volumes of α-pGlu-HAp (10, 20 and 30 mg) and γ-pGlu-HAp (10, 20 and 30 mg) were 0.59, 0.59, 0.85, 0.65, 0.68 and 0.66 cm3 g−1, respectively. From these results, no significant difference of the surface properties was observed in any of the particles.
| Sample | Surface areaa (m2 g−1) | Pore volumea (cm3 g−1) | Amount of peptideb (mg) | Ca/P molar ratioc | ζ-Potentiald (mV) |
|---|---|---|---|---|---|
| a The Brunauer–Emmett–Teller surface area and pore volume were obtained from the N2 adsorption–desorption isotherms using the Barrett–Joyner–Halenda method. b The relative amount of peptide in pGlu-HAp was estimated through thermogravimetry. c The molar ratios of calcium to phosphate were determined by inductively coupled plasma optical emission spectrometry. d The ζ-potentials of pGlu-HAp (dispersed in 10 mM phosphate buffer at pH 7.0) surfaces were determined by the electrophoretic light scattering method. | |||||
| α-pGlu-HAp (10 mg) | 111 | 0.59 | 6.2 | 1.55 | −37.3 |
| α-pGlu-HAp (20 mg) | 120 | 0.59 | 11 | 1.57 | −44.6 |
| α-pGlu-HAp (30 mg) | 128 | 0.85 | 18 | 1.56 | −51.4 |
| γ-pGlu-HAp (10 mg) | 125 | 0.65 | 5.4 | 1.53 | −37.6 |
| γ-pGlu-HAp (20 mg) | 135 | 0.68 | 14 | 1.56 | −50.6 |
| γ-pGlu-HAp (30 mg) | 108 | 0.66 | 21 | 1.55 | −51.4 |
3.2 Characterization of pGlu-HAp
The XRD patterns of the pGlu-HAp composites are shown in Fig. 2. For pGlu-HAp, α-pGlu-HAp (10, 20 and 30 mg) and γ-pGlu-HAp (10, 20 and 30 mg), as shown in Fig. 2(a–f), the diffraction peaks at 2θ = 26.0°, 31.8°, 32.2°, 32.8°, 34.0°, 39.8°, 46.6°, 49.5° and 53.3° can be attributed to the (002), (211), (112), (300), (202), (310), (222), (213) and (004) planes of HAp, respectively.28–31 The diffraction peaks for all the pGlu-HAp composites became broader with an increasing amount of peptide in pGlu-HAp, indicating that the crystallinity of the pGlu-HAp samples was lowered. Additionally, no peaks attributed to octacalcium phosphate (2θ = 4.7°) were detected. From these results, we considered that the calcium phosphates prepared were low-crystallinity HAp.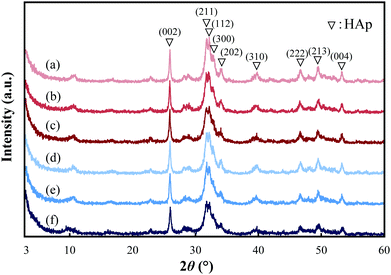 | ||
| Fig. 2 XRD patterns of pGlu-HAp: (a) α-pGlu-HAp (10 mg), (b) α-pGlu-HAp (20 mg), (c) α-pGlu-HAp (30 mg), (d) γ-pGlu-HAp (10 mg), (e) γ-pGlu-HAp (20 mg) and (f) γ-pGlu-HAp (30 mg). | ||
The molar ratios of calcium to phosphate (Ca/P) in pGlu-HAp were estimated by ICP-OES (Table 1). The Ca/P molar ratios were 1.55, 1.57 and 1.56 and 1.53, 1.56 and 1.55 for α-pGlu-HAp (10, 20 and 30 mg) and γ-pGlu-HAp (10, 20 and 30 mg), respectively. These values were lower than 1.67, the stoichiometric value of HAp, and were independent of the peptide structure and the amount of peptide.13 Furthermore, the low crystallinity of pGlu-HAp corresponded with the XRD data.
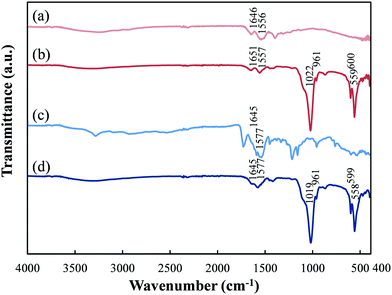
FT-IR analysis was performed to confirm the presence of HAp and peptide in pGlu-HAp (Fig. 3). For pGlu, we observed the characteristic bands of –COO− at 1550–1600 cm−1 and the −C![[double bond, length as m-dash]](https://www.rsc.org/images/entities/char_e001.gif) O stretching vibration at 1600–1700 cm−1 for amide I.32,33 In the α-pGlu spectrum, as shown in Fig. 3(a), the bands at 1556 cm−1 can be attributed to –COO−, whereas the bands at 1646 cm−1 correspond to amide I. The spectrum of α-pGlu-HAp (30 mg) is shown in Fig. 3(b), and the bands for the PO43− bending vibration of HAp occur at 559 and 600 cm−1. In addition, the peaks at 961 cm−1 were assigned to the symmetrical stretching vibration of PO43−, the peaks at 1022 cm−1 were attributed to the asymmetric stretching vibration of PO43−,31,34 and the peaks at 1557 and 1651 cm−1 were attributed to –COO− and amide I in α-pGlu, respectively. The spectrum of pure γ-pGlu is shown in Fig. 3(c), and the peaks at 1577 and 1645 cm−1 correspond to –COO− and amide I. Fig. 3(d), for γ-pGlu-HAp (30 mg), shows the characteristic bands of the PO43− of HAp at 558, 599, 961, and 1019 cm−1. Moreover, the adsorption bands at 1577 and 1645 cm−1 can be attributed to –COO− and amide I. These results reveal that pGlu-HAp contains peptide and HAp.
O stretching vibration at 1600–1700 cm−1 for amide I.32,33 In the α-pGlu spectrum, as shown in Fig. 3(a), the bands at 1556 cm−1 can be attributed to –COO−, whereas the bands at 1646 cm−1 correspond to amide I. The spectrum of α-pGlu-HAp (30 mg) is shown in Fig. 3(b), and the bands for the PO43− bending vibration of HAp occur at 559 and 600 cm−1. In addition, the peaks at 961 cm−1 were assigned to the symmetrical stretching vibration of PO43−, the peaks at 1022 cm−1 were attributed to the asymmetric stretching vibration of PO43−,31,34 and the peaks at 1557 and 1651 cm−1 were attributed to –COO− and amide I in α-pGlu, respectively. The spectrum of pure γ-pGlu is shown in Fig. 3(c), and the peaks at 1577 and 1645 cm−1 correspond to –COO− and amide I. Fig. 3(d), for γ-pGlu-HAp (30 mg), shows the characteristic bands of the PO43− of HAp at 558, 599, 961, and 1019 cm−1. Moreover, the adsorption bands at 1577 and 1645 cm−1 can be attributed to –COO− and amide I. These results reveal that pGlu-HAp contains peptide and HAp.
To analyse the secondary structure of the peptide bound with Ca ions by FT-IR, α-pGlu or γ-pGlu (9 mg) was added to 45 mM of (CH3COO)2Ca solution (20 mL). The mixture was stirred for 2 h, and the solid material was obtained by freeze-drying. It was confirmed that the secondary structural contents of the two peptides had a higher α-helix content (Table S1, ESI†).35–37 Kuno et al. reported that the secondary structure of a peptide was used as an organic template for silica mineralisation, and silica obtained with an α-helix peptide forms paper-like morphologies.38 According to these results, it appears that plate-like and sheet-like peptide–HAp particles were synthesized by the influence of peptides with an α-helix conformation.
STEM-EDX analysis was performed to confirm the presence of peptides on the pGlu-HAp particles using their elemental distribution. Fig. 4 displays the dark-field STEM and the elemental mapping images of (a) α-pGlu-HAp (30 mg) and (b) γ-pGlu-HAp (30 mg). Calcium and phosphorus are attributed to HAp, and nitrogen corresponds to the peptide. Moreover, not only calcium and phosphorus but also nitrogen were homogeneously distributed in the particles. These results indicate that the peptide is uniformly distributed in the pGlu-HAp particles.39,40
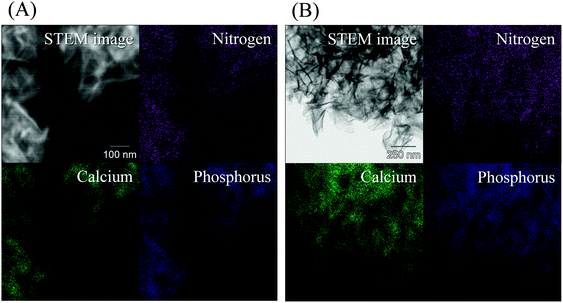 | ||
| Fig. 4 STEM-EDX elemental mapping images of (A) α-pGlu-HAp (30 mg) and (B) γ-pGlu-HAp (30 mg). Violet, green and blue indicate nitrogen, calcium and phosphorus elements, respectively. | ||
The relative amount of peptide in pGlu-HAp was determined through TG–DTA analysis. Weight losses from 200 to 700 °C were attributed to the loss of the peptide, as summarised in Table 1. The relative amounts of α-pGlu in α-pGlu-HAp (10, 20 and 30 mg) were 6.2, 11 and 18 mg, respectively, and the amounts of γ-pGlu in γ-pGlu-HAp (10, 20 and 30 mg) were 5.4, 14 and 21 mg, respectively. As a result, the quantity of peptide in pGlu-HAp was in the range from 2.3 to 9.5 wt%.
The surface charge of all the pGlu-HAp particles was analysed and is summarised in Table 1. The surface potential of α-pGlu-HAp (10 mg) was −37.3 mV, and with an increase in the amount of α-pGlu from 20 to 30 mg, the ζ-potential changed from −44.6 to −51.4 mV. In the case of γ-pGlu-HAp (10, 20 and 30 mg), the surface charges were −37.6, −50.6 and −51.4 mV, respectively. These results indicate that similar surface potential values of α-pGlu-HAp and γ-pGlu-HAp were observed with each amount of peptide (10, 20 and 30 mg); this suggests that the amount of peptide in pGlu-HAp was not significantly changed between α-pGlu-HAp and γ-pGlu-HAp.
3.3 Protein adsorption on pGlu-HAp
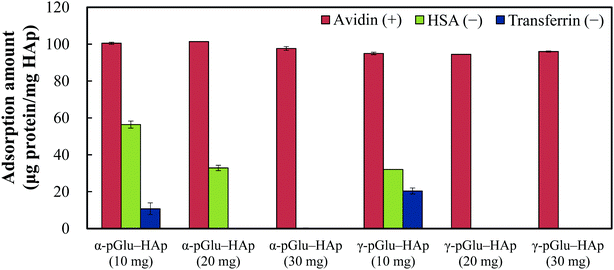
To confirm the selectivity of the protein adsorption of the pGlu-HAp particles synthesized in this study, avidin, HSA and transferrin were adsorbed on all the pGlu-HAp samples (Fig. 5). The amount of adsorbed avidin on α-pGlu-HAp (10, 20 and 30 mg) was 100, 100 and 97.7 μg mg−1, respectively. On the contrary, the adsorption capacity of α-pGlu-HAp for HSA decreased from 56.4 to 32.9 μg mg−1 when the amount of peptides was increased from 10 to 20 mg, and the transferrin adsorption capacity of α-pGlu-HAp (10 mg) was only 10.7 μg mg−1. Moreover, pGlu-HAp containing 30 mg of α-pGlu showed selectivity for protein adsorption, that is, only avidin adsorption was observed on α-pGlu-HAp (30 mg).In the case of γ-pGlu-HAp (10, 20 and 30 mg), the amounts of adsorbed avidin were 95.0, 94.4, and 96.0 μg mg−1, respectively, and the HSA and transferrin adsorption capacities of α-pGlu-HAp (10 mg) were 32.1 and 20.4 μg mg−1, respectively. In addition, pGlu-HAp particles containing γ-pGlu are potentially suitable as adsorbents with highly selective protein adsorption after the addition of 20 mg of γ-pGlu. These results reveal that as-synthesized pGlu-HAp exhibited highly selective adsorption of proteins, and the blocking effect itself improved as the amount of peptides increased.
3.4 Adsorption isotherms of avidin on pGlu-HAp
The Langmuir and Freundlich isotherm parameters for avidin on pGlu-HAp are listed in Table 2. The correlation coefficient (R2) for each isotherm model was used to clarify the best-fitting isotherm to the experimental data. The R2 values for the Langmuir plots attributed to α-pGlu-HAp (30 mg) and γ-pGlu-HAp (30 mg) were 0.9943 and 0.9958, respectively, and the R2 values for the Freundlich plots were 0.6531 and 0.9111 for α-pGlu-HAp (30 mg) and γ-pGlu-HAp (30 mg), respectively. The Langmuir plots had higher R2 values than the Freundlich plots, indicating that the Langmuir isotherm model corresponds to a monolayer and could be fitted to the equilibrium data for the adsorption of avidin on pGlu-HAp. In addition, the maximum avidin adsorption capacity for α-pGlu-HAp (30 mg) from our data was 776 μg mg−1 HAp, and that for γ-pGlu-HAp (30 mg) was 302 μg mg−1 HAp (Fig. S5, ESI†). According to these results, the protein adsorption behaviour on pGlu-HAp was influenced by the peptide structure.| Sample | Langmuir parameters | Freundlich parameters | ||||
|---|---|---|---|---|---|---|
| Q m (mg mg−1) | K L (mL mg−1) | R 2 | 1/nc | K F (μg mg−1) | R 2 | |
| a Q m is the maximum capacity of avidin adsorbed in equilibrium. b K L is the Langmuir constant. c 1/n is the Freundlich adsorption intensity constant. d K F is the Freundlich constant. | ||||||
| α-pGlu-HAp (30 mg) | 0.82 | 53 | 0.9943 | 0.449 | 8.5 | 0.6531 |
| γ-pGlu-HAp (30 mg) | 0.32 | 85 | 0.9958 | 0.321 | 0.33 | 0.9111 |
3.5 Carboxyl group density in pGlu-HAp
To investigate the difference in the amount of adsorbed avidin on the two pGlu-HAp composites, the density of the carboxyl group in pGlu-HAp was determined using 5-aminofluorescein. The density of the carboxyl groups in α-pGlu-HAp (30 mg) was 1.67 pmol cm−2, and that in γ-pGlu-HAp (30 mg) was 0.35 pmol cm−2; therefore, the maximum amount of avidin adsorption on α-pGlu-HAp (30 mg) with a high density of carboxyl groups was higher than that on γ-pGlu-HAp (30 mg).3.6 Three-dimensional structural analysis in avidin adsorbed on pGlu-HAp
The tryptophan fluorescence spectra of avidin adsorbed on α-pGlu-HAp (30 mg) are shown in Fig. 6(A). Fig. 6(B) shows the three-dimensional (3D) structures of avidin obtained from the Protein Data Bank (ID: 1VYO). Hu et al. indicated that the wavelength of the emission maximum λmax is red-shifted when the structure of a protein is changed.41 As shown in Fig. 6(A), the peak shape of the fluorescence spectrum of avidin on α-pGlu-HAp (30 mg) was similar to that of free avidin. It revealed that the interactions between avidin and pGlu-HAp were not an influence on the 3D structures of avidin molecules adsorbed on pGlu-HAp.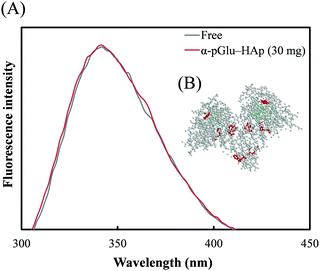 | ||
| Fig. 6 (A) Tryptophan fluorescence spectrum of avidin adsorbed on α-pGlu-HAp (30 mg). (B) The 3D structure of avidin was obtained from the Protein Data Bank (ID: 1VYO). Red balls represent tryptophans due to avidin. | ||
3.7 Binding activity of biotin to avidin adsorbed on pGlu-HAp particles
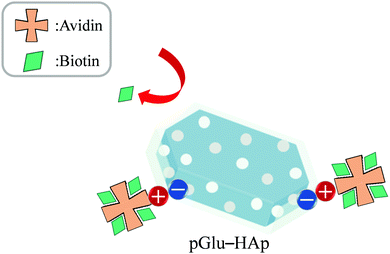
The biotin-binding ability of each amount of avidin adsorbed on pGlu-HAp was analysed (Fig. 7). The amounts of adsorbed avidin on α-pGlu-HAp (30 mg) and γ-pGlu-HAp (30 mg) were 88, 171, 272, 500, 691, 95, 176 and 242 μg mg−1, respectively. For biotin–FITC, more than four molecules per avidin molecule were added, confirming that the avidin adsorbed on these pGlu-HAp composites could bind four biotin–FITC molecules. These results indicate that avidin adsorbed on pGlu-HAp has more biotin-binding sites than the silica particles in our previous report.22 Therefore, the synthesized pGlu-HAp composites show the high adsorption ability of avidin and effective binding to biotin (Scheme 1). Additionally, we have revealed that the binding sites of biotin retained four molecules for every amount of adsorbed avidin.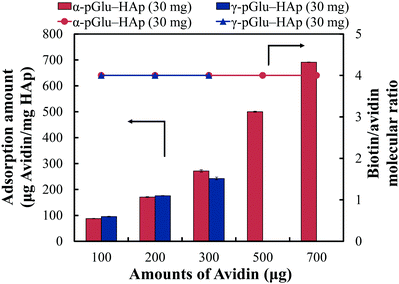 | ||
| Fig. 7 Binding activity of biotin to avidin adsorbed on α-pGlu-HAp (30 mg) and γ-pGlu-HAp (30 mg), which was estimated by the biotin/avidin molecular ratio. | ||
3.8 Selective protein binding by avidin adsorbed on pGlu-HAp
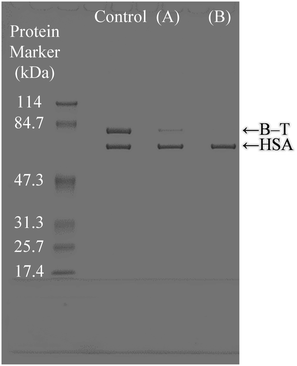
The selective binding capacity of the biotinylated protein to avidin adsorbed on α-pGlu-HAp (30 mg) from HSA (Mw = 66.4 kDa) and B–T (transferrin has an Mw of 76.5 kDa + biotin 244.3) mixtures was investigated, as shown in Fig. 8. Avidin adsorbed on α-pGlu-HAp (30 mg) exhibited an HSA band, which indicated the binding of only B–T. Fig. 5 shows that pGlu-HAp specifically adsorbed avidin and inhibited transferrin; however, avidin adsorbed on α-pGlu-HAp (30 mg) bound to only B–T from the HSA and B–T mixture. From these results, it can be concluded that for the avidin adsorbed by pGlu-HAp, the binding activity of biotin is highly selective to biofunctional particles, which indicates zero or an extremely low adsorption capacity for non-biotin-labelled proteins.4. Conclusions
Synthesized pGlu-HAp with selectivity for protein adsorption showed the high adsorption ability of avidin and effective binding to biotin. The morphologies of α-pGlu-HAp and γ-pGlu-HAp were plate-like and sheet-like particles in the secondary structures, especially the α-helix in the peptides, and α-pGlu-HAp more easily formed HAp particles than γ-pGlu-HAp. The higher maximum adsorption amount for avidin on α-pGlu-HAp was the result of the difference in the density of the carboxyl groups in pGlu-HAp, because the carboxyl groups could adsorb proteins. The avidin adsorbed on these pGlu-HAp composites efficiently bound to biotin with a theoretical value of four (biotin/avidin molecular ratio). Furthermore, biotinylated protein could be separated from protein mixtures by avidin adsorbed on pGlu-HAp. Such particles could be used in biosensing and bioseparation applications.Conflicts of interest
There are no conflicts to declare.Acknowledgements
We are grateful to Dr Hiroyuki Iwata, Associate Professor of Aichi Institute of Technology, for help with the STEM-EDX observations. This research was supported by Grants-in-Aid for Scientific Research (C) No. 15K06474 from the Japan Society for the Promotion of Science and A-STEP (AS282I011e) from the Japan Science and Technology Agency.References
- K. Yagi, Appl. Microbiol. Biotechnol., 2007, 73, 1251–1258 CrossRef CAS.
- M. Gerard, A. Chaubey and B. D. Malhotra, Biosens. Bioelectron., 2002, 17, 345–359 CrossRef CAS.
- M. Yemini, M. Reches, E. Grazit and J. Rishpon, Anal. Chem., 2005, 77, 5155–5159 CrossRef CAS PubMed.
- D. Chiu, W. Zhou, S. Kitayaporn, D. T. Schwartz, K. Murali-Krishna, T. J. Kavanagh and F. Baneyx, Bioconjugate Chem., 2012, 23, 610–617 CrossRef CAS.
- H. Zhang, J. Xu and H. Chen, J. Phys. Chem. C, 2007, 111, 16564–16570 CrossRef CAS.
- R. M. Lequin, Clin. Chem., 2005, 51, 2415–2418 CrossRef CAS.
- R. Pei, Z. Cheng, E. Wang and X. Yang, Biosens. Bioelectron., 2001, 16, 355–361 CrossRef CAS.
- S. Balthasar, K. Michaelis, N. Dinauer, H. von Briesen, J. Kreuter and K. Langer, Biomaterials, 2005, 26, 2723–2732 CrossRef CAS.
- H. J. Gruber, G. Kada, M. Marek and K. Kaiser, Biochim. Biophys. Acta, 1998, 1381, 203–212 CrossRef CAS.
- S. B. van der Meer, T. Knuschke, A. Frade, N. Schulze, A. M. Westendorf and M. Epple, Acta Biomater., 2017, 57, 414–425 CrossRef CAS.
- J. Guesdon, T. Ternynck and S. Avrameas, J. Histochem. Cytochem., 1979, 27, 1131–1139 CrossRef CAS.
- E. P. Diamandis and T. K. Christopoulos, Clin. Chem., 1991, 37, 625–636 CAS.
- M. Vallet-Regí and J. M. González-Calbet, Prog. Solid State Chem., 2004, 32, 1–31 CrossRef.
- T. Matsumoto, M. Okazaki, M. Inoue, S. Yamaguchi, T. Kusunose, T. Toyonaga, Y. Hamada and J. Takahashi, Biomaterials, 2004, 25, 3807–3812 CrossRef CAS.
- L. Yang, W. Wei, X. Gao, J. Xia and H. Tao, Talanta, 2005, 68, 40–46 CrossRef CAS.
- M. Jeon, S. Jung and S. Park, New J. Chem., 2018, 42, 14870–14875 RSC.
- Y. Ding, J. Liu, H. Wang, G. Shen and R. Yu, Biomaterials, 2007, 28, 2147–2154 CrossRef CAS PubMed.
- K. Bleek and A. Taubert, Acta Biomater., 2013, 9, 6283–6321 CrossRef CAS PubMed.
- S. Xu, J. Shi, D. Feng, L. Yang and S. Cao, J. Mater. Chem. B, 2014, 2, 6500–6507 RSC.
- S. Jiang, Q. Yao, G. Zhou and S. Fu, J. Phys. Chem. C, 2012, 116, 4484–4492 CrossRef CAS.
- S. Kojima, F. Nagata, S. Kugimiya and K. Kato, Appl. Surf. Sci., 2018, 458, 438–445 CrossRef CAS.
- T. Orita, M. Tomita, M. Harada and K. Kato, Anal. Biochem., 2012, 425, 1–9 CrossRef CAS.
- Y. Ho, Pol. J. Environ. Stud., 2006, 15, 81–86 CAS.
- W. Guo, W. Hu, J. Pan, H. Zhou, W. Guan, X. Wang, J. Dai and L. Xu, Chem. Eng. J., 2011, 171, 603–611 CrossRef CAS.
- S. S. Khan, P. Srivatsan, N. Vaishnavi, A. Mukherjee and N. Chandrasekaran, J. Hazard. Mater., 2011, 192, 299–306 CAS.
- S. Sun, M. Ma, N. Qiu, X. Huang, Z. Cai, Q. Huang and X. Hu, Colloids Surf., B, 2011, 88, 246–253 CrossRef CAS.
- T. Matsumoto, M. Okazaki, M. Inoue, Y. Hamada, M. Taira and J. Takahashi, Biomaterials, 2002, 23, 2241–2247 CrossRef CAS.
- M. Qi, J. Qi, G. Xiao, K. Zhang, C. Lu and Y. Lu, CrystEngComm, 2016, 18, 5876–5884 RSC.
- J. Gómez-Morales, J. M. Delgado-López, M. Iafisco, A. Hernández-Hernández and M. Prat, Cryst. Growth Des., 2011, 11, 4802–4809 CrossRef.
- P. Narendran, A. Rajendran, M. Garhnayak, L. Garhnayak, J. Nivedhitha, K. C. Devi and D. K. Pattanayak, Colloids Surf., B, 2018, 169, 143–150 CrossRef CAS.
- M. Xu, F. Ji, Z. Qin, D. Dong, X. Tian, R. Niu, D. Sun, F. Yao and J. Li, CrystEngComm, 2018, 20, 2374–2383 RSC.
- M. C. Chang and J. Tanaka, Biomaterials, 2002, 23, 4811–4818 CrossRef CAS.
- R. Gonzalez-McQuire, J. Chane-Ching, E. Vignaud, A. Lebugle and S. Mann, J. Mater. Chem., 2004, 14, 2277–2281 RSC.
- E. Boanini, P. Torricelli, M. Gazzano, R. Giardino and A. Bigi, Biomaterials, 2006, 27, 4428–4433 CrossRef CAS.
- B. R. Singh, M. P. Fuller and G. Schiavo, Biophys. Chem., 1990, 46, 155–166 CrossRef.
- T. Maruyama, S. Katoh, M. Nakajima, H. Nabetani, T. P. Abbott, A. Shono and K. Satoh, J. Membr. Sci., 2001, 192, 201–207 CrossRef CAS.
- M. M. Tomczak, D. D. Glawe, L. F. Drummy, C. G. Lawrence, M. O. Stone, C. C. Perry, D. J. Pochan, T. J. Deming and R. R. Naik, J. Am. Chem. Soc., 2005, 127, 12577–12582 CrossRef CAS.
- T. Kuno, T. Nonoyama, K. Hirao and K. Kato, Chem. Lett., 2012, 41, 1547–1549 CrossRef CAS.
- M. Tomozawa, S. Hiromoto and Y. Harada, Surf. Coat. Technol., 2010, 204, 3243–3247 CrossRef CAS.
- X. Zhou, L. Wan and Y. Guo, Nanoscale, 2012, 4, 5868–5871 RSC.
- Y. Hu, Y. Liu, J. Wang, X. Xiao and S. Qu, J. Pharm. Biomed. Anal., 2004, 36, 915–919 CrossRef CAS.
Footnote |
| † Electronic supplementary information (ESI) available. See DOI: 10.1039/c8nj05024d |
| This journal is © The Royal Society of Chemistry and the Centre National de la Recherche Scientifique 2019 |

