
 Open Access Article
 This Open Access Article is licensed under a
 Creative Commons Attribution 3.0 Unported Licence
Ultrafast rotational motions of supported nanoclusters probed by electron diffraction†
Thomas
Vasileiadis
 *a,
Emmanuel N.
Skountzos
bc,
Dawn
Foster
d,
Shawn P.
Coleman
e,
Daniela
Zahn
a,
Faruk
Krečinić
a,
Vlasis G.
Mavrantzas
bcf,
Richard E.
Palmer
g and
Ralph
Ernstorfer
*a
*a,
Emmanuel N.
Skountzos
bc,
Dawn
Foster
d,
Shawn P.
Coleman
e,
Daniela
Zahn
a,
Faruk
Krečinić
a,
Vlasis G.
Mavrantzas
bcf,
Richard E.
Palmer
g and
Ralph
Ernstorfer
*a
aFritz-Haber-Institut der Max-Planck-Gesellschaft, Faradayweg 4-6, 14195 Berlin, Germany. E-mail: vasileiadis@fhi-berlin.mpg.de; ernstorfer@fhi-berlin.mpg.de
bDepartment of Chemical Engineering, University of Patras, Greece
cFORTH/ICE-HT, Patras GR-26504, Greece
dNanoscale Physics Research Laboratory, School of Physics and Astronomy, University of Birmingham, Edgbaston, Birmingham B15 2TT, UK
eU.S. Army Research Laboratory, Weapons and Materials Research Directorate, Aberdeen Proving Ground, MD, USA
fParticle Technology Laboratory, Department of Mechanical and Process Engineering, ETH Zürich, CH-8092 Zürich, Switzerland
gCollege of Engineering, Swansea University, Bay Campus, Fabian Way, Swansea SA1 8EN, UK
First published on 9th May 2019
Abstract
In crystals, microscopic energy flow is governed by electronic and vibrational excitations. In nanoscale materials, however, translations and rotations of entire nanoparticles represent additional fundamental excitations. The observation of such motions is elusive as most ultrafast techniques are insensitive to motions of the phonons’ frame of reference. Here, we study heterostructures of size-selected Au nanoclusters with partial (111) orientation on few-layer graphite with femtosecond electron diffraction. We demonstrate that ultrafast, constrained rotations of nanoclusters, so-called librations, in photo-induced non-equilibrium conditions can be observed separately from vibrational structural dynamics. Molecular dynamics and electron diffraction simulations provide quantitative understanding on librations-induced deviations from the conventional temperature dependence of diffraction patterns. We find that nanocluster librations with a period of ∼20 picoseconds are triggered quasi-impulsively by graphene flexural motions. These ultrafast structural dynamics modulate the Au/C interface and hence are expected to play a key role in energy- and mass-transport at the nanoscale.
New conceptsStructural stability of nanoscale building blocks is prone to ultrafast lattice motions that range from atomic vibrations, to translations and rotations of entire nanostructures. Atomic vibrations in nanostructures have been studied by a variety of time-resolved techniques, but the detection of net, nanolattice motions remains elusive. In this work, we exploit the sensitivity of diffraction to the crystal orientation in order to study ultrafast rotational motions of prototypical, size-selected Au nanoclusters on few-layer graphite. The crystallinity of the substrate is imposing a preferred orientation of the nanoclusters’ lattices in equilibrium. The nanoclusters’ orientation becomes evident from their electron diffraction pattern. Ultrashort laser pulses are then used to induce vibrational and rotational excitation of the nanoclusters and the resulting, time-dependent diffraction patterns are probed with femtosecond electron diffraction. The experiments are accompanied by molecular dynamics and electron diffraction simulations, in order to visualize the nanoclusters’ motions and to comprehend the deviation of the diffraction dynamics from the conventional Debye–Waller theory, which only takes vibrational excitations into account. Conclusively, the nanoclusters perform constrained rotational motions, termed librations, driven quasi-impulsively by substrate phonons in picosecond timescales. Our investigations aim for a more complete understanding of out-of-equilibrium conditions, heat- and mass-transport in nanoscale heterostructures. |
Introduction
When two bulk solids in contact have different temperatures, phonons can transmit through the interface contributing in this way to the restoration of thermodynamic equilibrium. The situation is expected to be different when one of the two solids is spatially confined in all directions. Within the ultrashort period of interfacial nonequilibrium, the only responsive lattice degrees of freedom of bulk crystals are the phonons. According to molecular dynamics (MD) simulations, however, zero-dimensional nanostructures like nanoclusters (NCs) can perform translational and rotational motions at ultrafast timescales.1 Being ultrafast, these motions are expected to participate in interfacial energy flow. Moreover, NC translations and rotations are coupled and can modulate the adherence to the substrate rendering them a key factor of heat- and mass-transport phenomena.1,2Various experimental methods have addressed or controlled ballistic and diffusive motions of nano-objects on surfaces. Hynninen et al.3 and Cihan et al.4 used the metallic tip of AFM microscopes to study sliding Au nanostructures on insulators and graphite, respectively. Similarly, quartz crystal microbalances have explored sliding friction of Au nanocrystals on graphene.5 Regarding rotational motions and electron probes, Ogawa et al.6 used electron diffraction in a scanning electron microscope to track picometer-scale angular motions of supported Au nanoparticles. Electron beams of high energy and flux have also been used to manipulate and rotate Au nanoparticles.7
Recent theoretical studies of NC motions have concentrated on nonequilibrium phenomena, non-thermal diffusion of NCs in liquids8 and the interaction of supported NCs with substrate phonons.2 The dynamics of nanoparticles in liquids have been examined experimentally by four-dimensional electron microscopy.9–11 In a recent article,12 some of the authors have used femtosecond electron diffraction (FED)13 to investigate ultrafast atomic motions of Au NCs on thin-films under nonequilibrium conditions. The observed dynamics of diffraction peaks could be explained in terms of energy flow between the electrons and the atomic vibrations of the NCs and the substrate. In contrast, the present work employs FED to study ultrafast rotational motions of Au NCs on few-layer graphite. The various rotational motions of NCs and their energetics are illustrated in the ESI† (Fig. S1). Because Au NCs start from a partially oriented state and due to the sensitivity of diffraction to the crystal orientation, FED is able to detect constrained rotations (librations) of the NC on the picosecond timescale. The experimental results are complemented by MD and electron diffraction simulations. The observed ultrafast librations are expected to affect the Au/C interface, the energy flow between the two materials, and the diffusion of the nanoclusters.
Femtosecond electron diffraction
The ultrathin graphitic substrate consisted of single and few-layer graphene (from now on mentioned simply as graphene) supported on one side by a lacey-carbon network to improve mechanical stability. Magic-number Au923±23 NCs14,15 have been size-selected with a mass-selecting filter and deposited on the unsupported side of graphene in the soft-landing regime (<2 eV per atom).16 The uncertainty of the NC mass represents the FWHM of the monomers’ distribution. Prior to deposition, ion bombardment created surface-defects in order to suppress translational diffusion and aggregation.16 Characterization of Au NCs was carried out with High-Angle Annular Dark Field Microscopy (HAADF) to obtain the surface- and size-distribution of Au NCs (Fig. 1a). The most abundant allotropes of Au923 NCs were single-crystalline FCC NCs and polycrystalline decahedral NCs (Dh).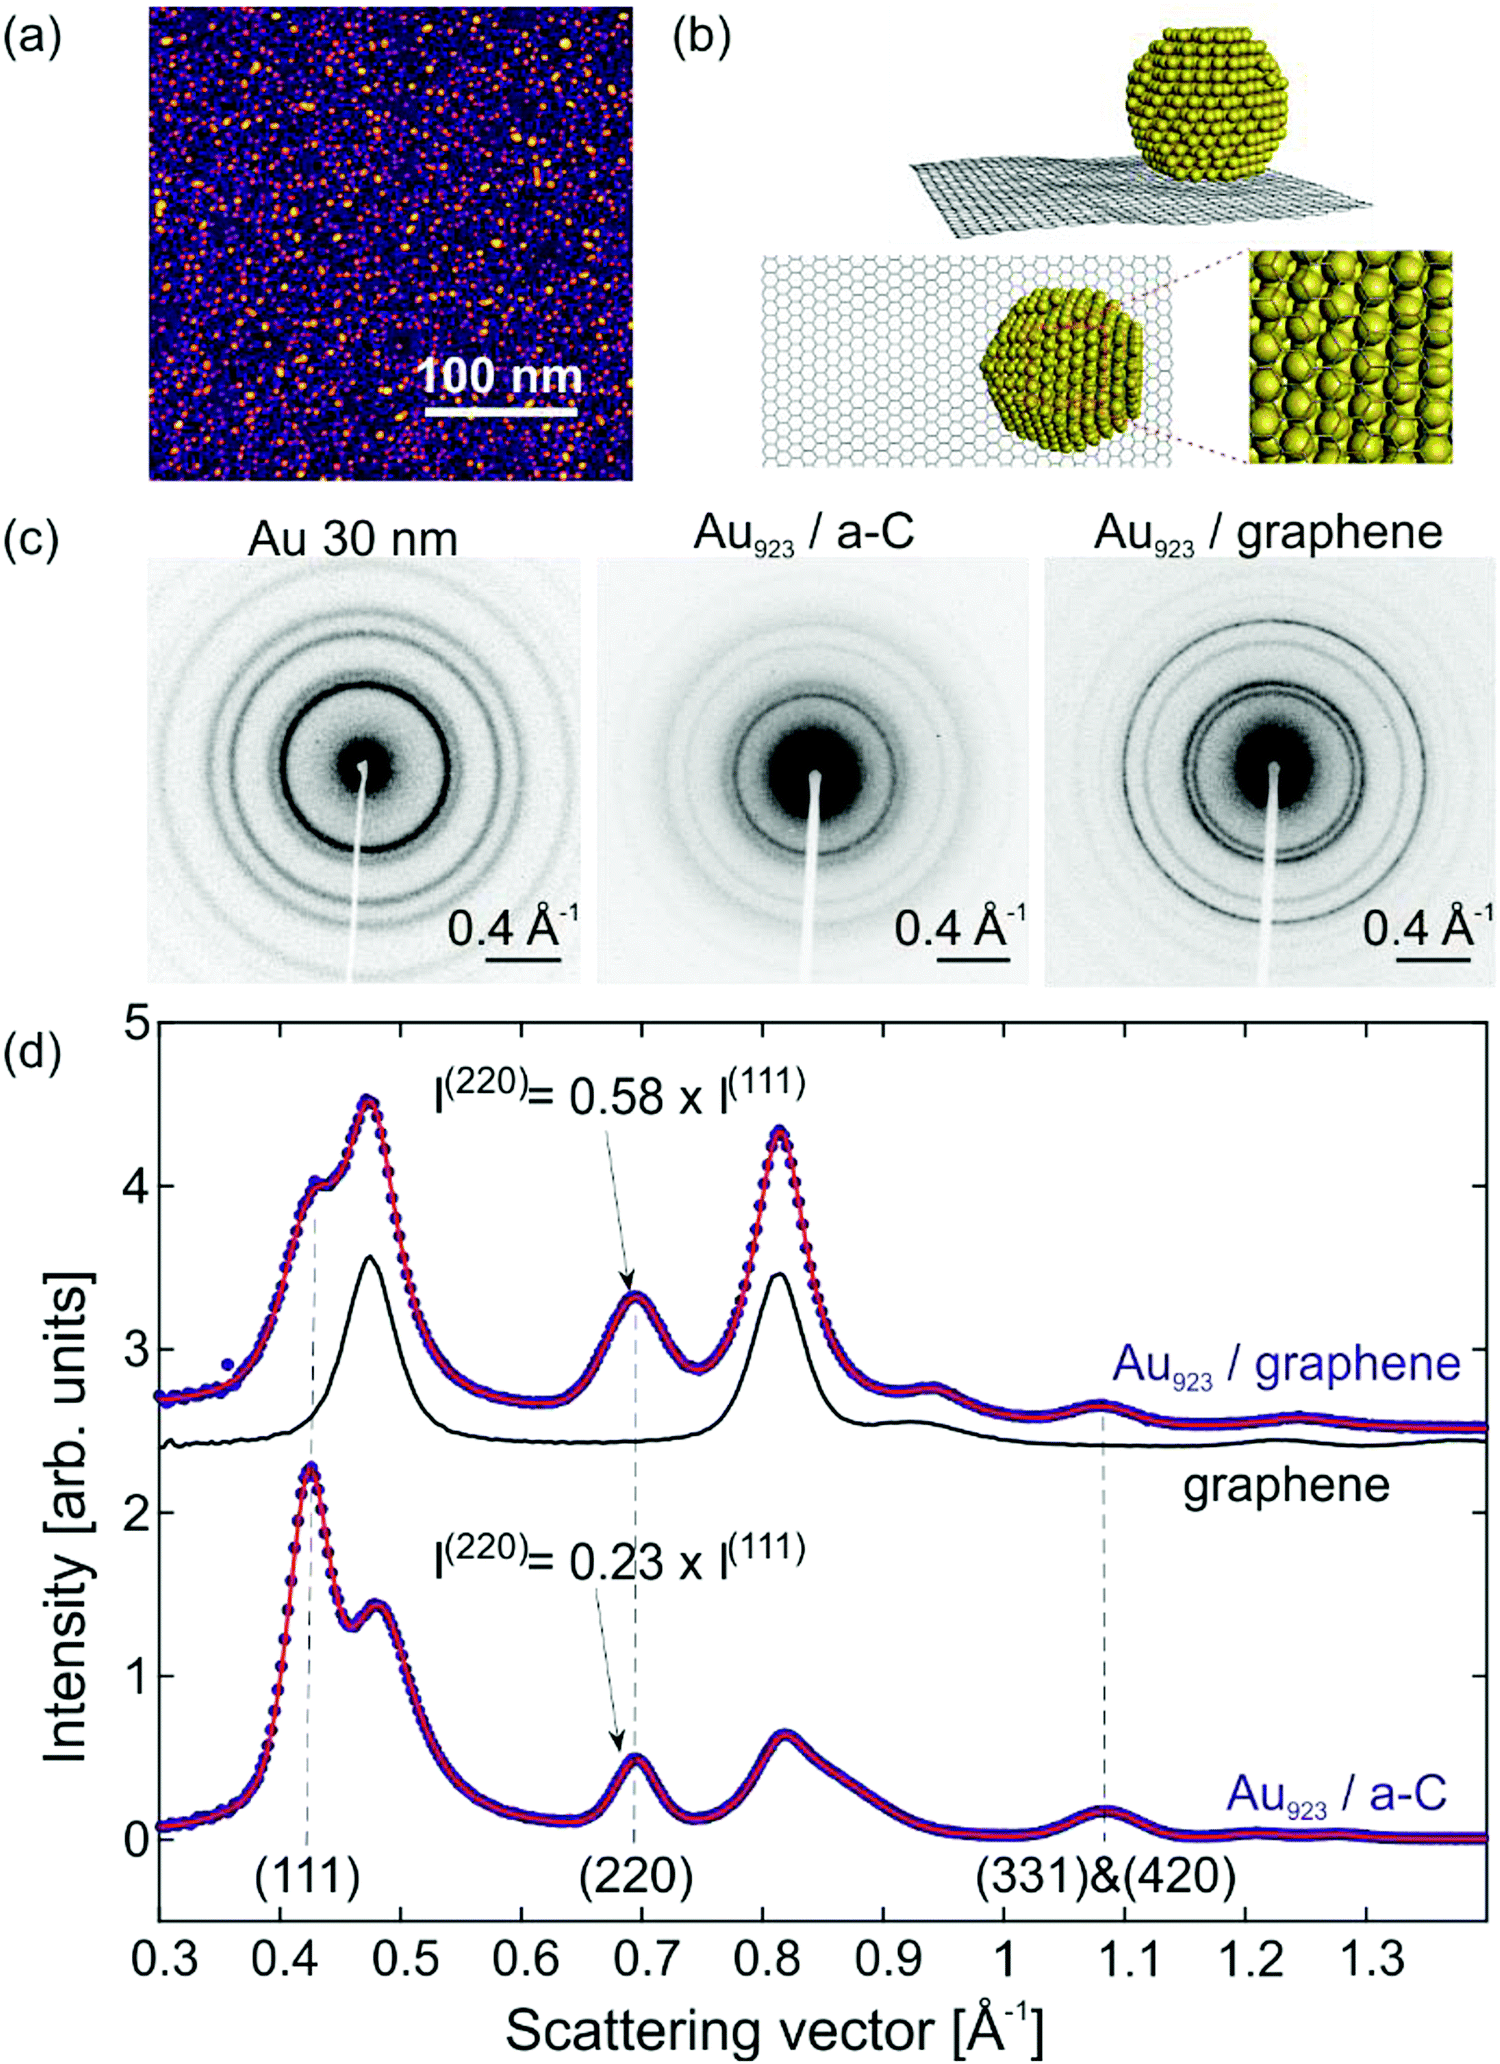 | ||
| Fig. 1 Microscopy, simulation and diffraction of supported Au923 NCs. (a) HAADF imaging of Au923 NCs on graphene. (b) An FCC Au923 NC on graphene simulated with classical MD. (c) Experimental electron diffraction patterns of bulk Au (left), Au923 NCs on a-C (center) and Au923 NCs on graphene (right). (d) Radial average of diffraction for Au923 on graphene and comparison with bare graphene substrates and Au923 on a-C. When deposited on graphene, the (220) peak of Au923 NCs is enhanced compared to the (111) peak. | ||
The relative proportions of the different structural allotropes and their various orientations relative to graphene are connected to the electron diffraction patterns in non-trivial ways. For this reason, we performed classical MD and electron diffraction simulations with FCC and Dh NCs on graphene. Classical MD is known to describe adequately metallic NCs1,2,17 and large polymeric molecules18 on graphene. Fig. 1b shows the side- and bottom-view of a FCC NC on graphene and the interface of Au and C atoms. The strongest adherence with the substrate is achieved for (111) orientation of the FCC NCs and (100) orientation of the Dh NCs.
Fig. 1c shows experimental electron diffraction patterns acquired in a compact, time-resolved electron diffractometer.13 The investigated samples have thin-film morphology and the diffracted electrons arrive normal to the surface. The first diffraction pattern belongs to polycrystalline Au thin films with 30 nm thickness. The second diffraction pattern is Au923 NCs deposited on amorphous C (a-C) thin films (20 nm thickness). Except for the diffraction intensity, these two patterns are very similar, which implies: (i) Au NCs have the same FCC crystal structure as bulk Au; (ii) the NCs have random orientations on a-C similar to the crystallites in polycrystalline Au. The third diffraction pattern belongs to Au923 NCs on graphene and shows Debye–Scherrer rings for both NCs as well as the graphene substrate, indicating that graphene is polycrystalline with a domain size small compared to the spot size of the electron pulses (∼100 μm diameter).
For a quantitative study of the diffraction patterns, their intensity has been radially averaged and fitted using pseudo-Voigt peak profiles. Fig. 1d shows the resulting diffraction intensity after background subtraction as a function of the scattering vector S = 2![[thin space (1/6-em)]](https://www.rsc.org/images/entities/char_2009.gif) sinθ/λ, where θ is the scattering angle and λ the de Broglie wavelength of the electrons. The experimental data-points (blue) show the diffraction patterns of Au923 on graphene and Au923 on a-C. The fitting (red solid line) is used to extract the position, intensity and width of all the diffraction peaks. The most discernible changes between the two signals stem from contributions of the graphene substrate. The black solid line shows the diffraction pattern of a bare substrate of graphene on lacey C. The crystalline structure of graphene gives rise to intense peaks, located near the (200) and (311) peaks of Au. For Au923 on a-C, the relative intensities of (111) and (220) peaks are close to what is expected for randomly oriented Au crystallites. However, for Au923 on graphene the intensity of the (220) peak is enhanced compared to the (111) peak by a factor of 2.5 (Fig. 1d) indicating a preferential orientation of the NCs.
sinθ/λ, where θ is the scattering angle and λ the de Broglie wavelength of the electrons. The experimental data-points (blue) show the diffraction patterns of Au923 on graphene and Au923 on a-C. The fitting (red solid line) is used to extract the position, intensity and width of all the diffraction peaks. The most discernible changes between the two signals stem from contributions of the graphene substrate. The black solid line shows the diffraction pattern of a bare substrate of graphene on lacey C. The crystalline structure of graphene gives rise to intense peaks, located near the (200) and (311) peaks of Au. For Au923 on a-C, the relative intensities of (111) and (220) peaks are close to what is expected for randomly oriented Au crystallites. However, for Au923 on graphene the intensity of the (220) peak is enhanced compared to the (111) peak by a factor of 2.5 (Fig. 1d) indicating a preferential orientation of the NCs.
The size-selected Au923 nanoclusters on graphene have a surface density of 2.6 NCs per 100 nm2. In this technique, the patterns of Fig. 1d are recorded with ultrashort electron bunches (∼100 fs) at various delays relatively to an optical excitation (sub-100 fs pulse duration, 400 nm wavelength) in a pump–probe manner.13 The kinetic energy of the electrons is 90 keV (λ = 3.9 pm). The overall time-resolution of the experiment is approximately 300 fs and the number of electrons per pulse is in the order of 103. For more information on the characteristics of the electron pulses, the interested reader is referred to the work of Waldecker et al.13 The spot diameters of the pump and probe pulses are (190 ± 20) μm and (107 ± 5) μm, respectively. The diameter of the pump and its standard deviation are determined from Gaussian peak profile fits to an optical camera image of the focus. The diameter of the probe (electrons) and its standard deviation are determined by imaging the electron beam after transmission through a 100 μm reference pinhole. The experiment presented here used a laser fluence of (3.8 ± 0.6) mJ cm−2. The standard deviation of the fluence is mainly due to the uncertainty in the diameter of the pump. The calculation of the fluence is carried out as in Harb et al.19 and takes into account only the probed area. The diffraction pattern of each time delay is integrated for 50 s (∼5 × 10⁷ electrons per diffractogram).
After absorption of a laser pulse by the heterostructure, energy is gradually transferred to the Au NCs lattices on the picosecond time-scale and leads to enhanced atomic vibrations and subtle deterioration of crystalline order.12 Such phenomena lead to a decay in the intensities of all diffraction peaks. By recording multiple diffraction peaks of Au NCs that do not have significant overlap with substrate peaks [i.e., (111), (220) and the average of (331) and (420)], it is possible to study structural dynamics of the Au NCs. All peaks of graphene coincide with intense peaks of Au NCs (Fig. 1d) and cannot be analyzed individually. The pump–probe delay dependences of the (111) and (220) peaks for Au NCs on graphene are shown in Fig. 2a with red and blue data-points, respectively. Because of the anharmonicity of the interatomic potential, the enhanced atomic motion is accompanied by lattice expansion.12 The relative lattice expansion for Au NCs on graphene is shown in Fig. 2b and it is detected as a shift of diffraction peaks to lower scattering angles. The observed shift of the peak position, in reciprocal-space, is a direct manifestation of lattice expansion in real-space and serves as an alternative probe of the lattice excitation. The extracted lattice expansion is similar for both peaks as expected for isotropic expansion of NCs.
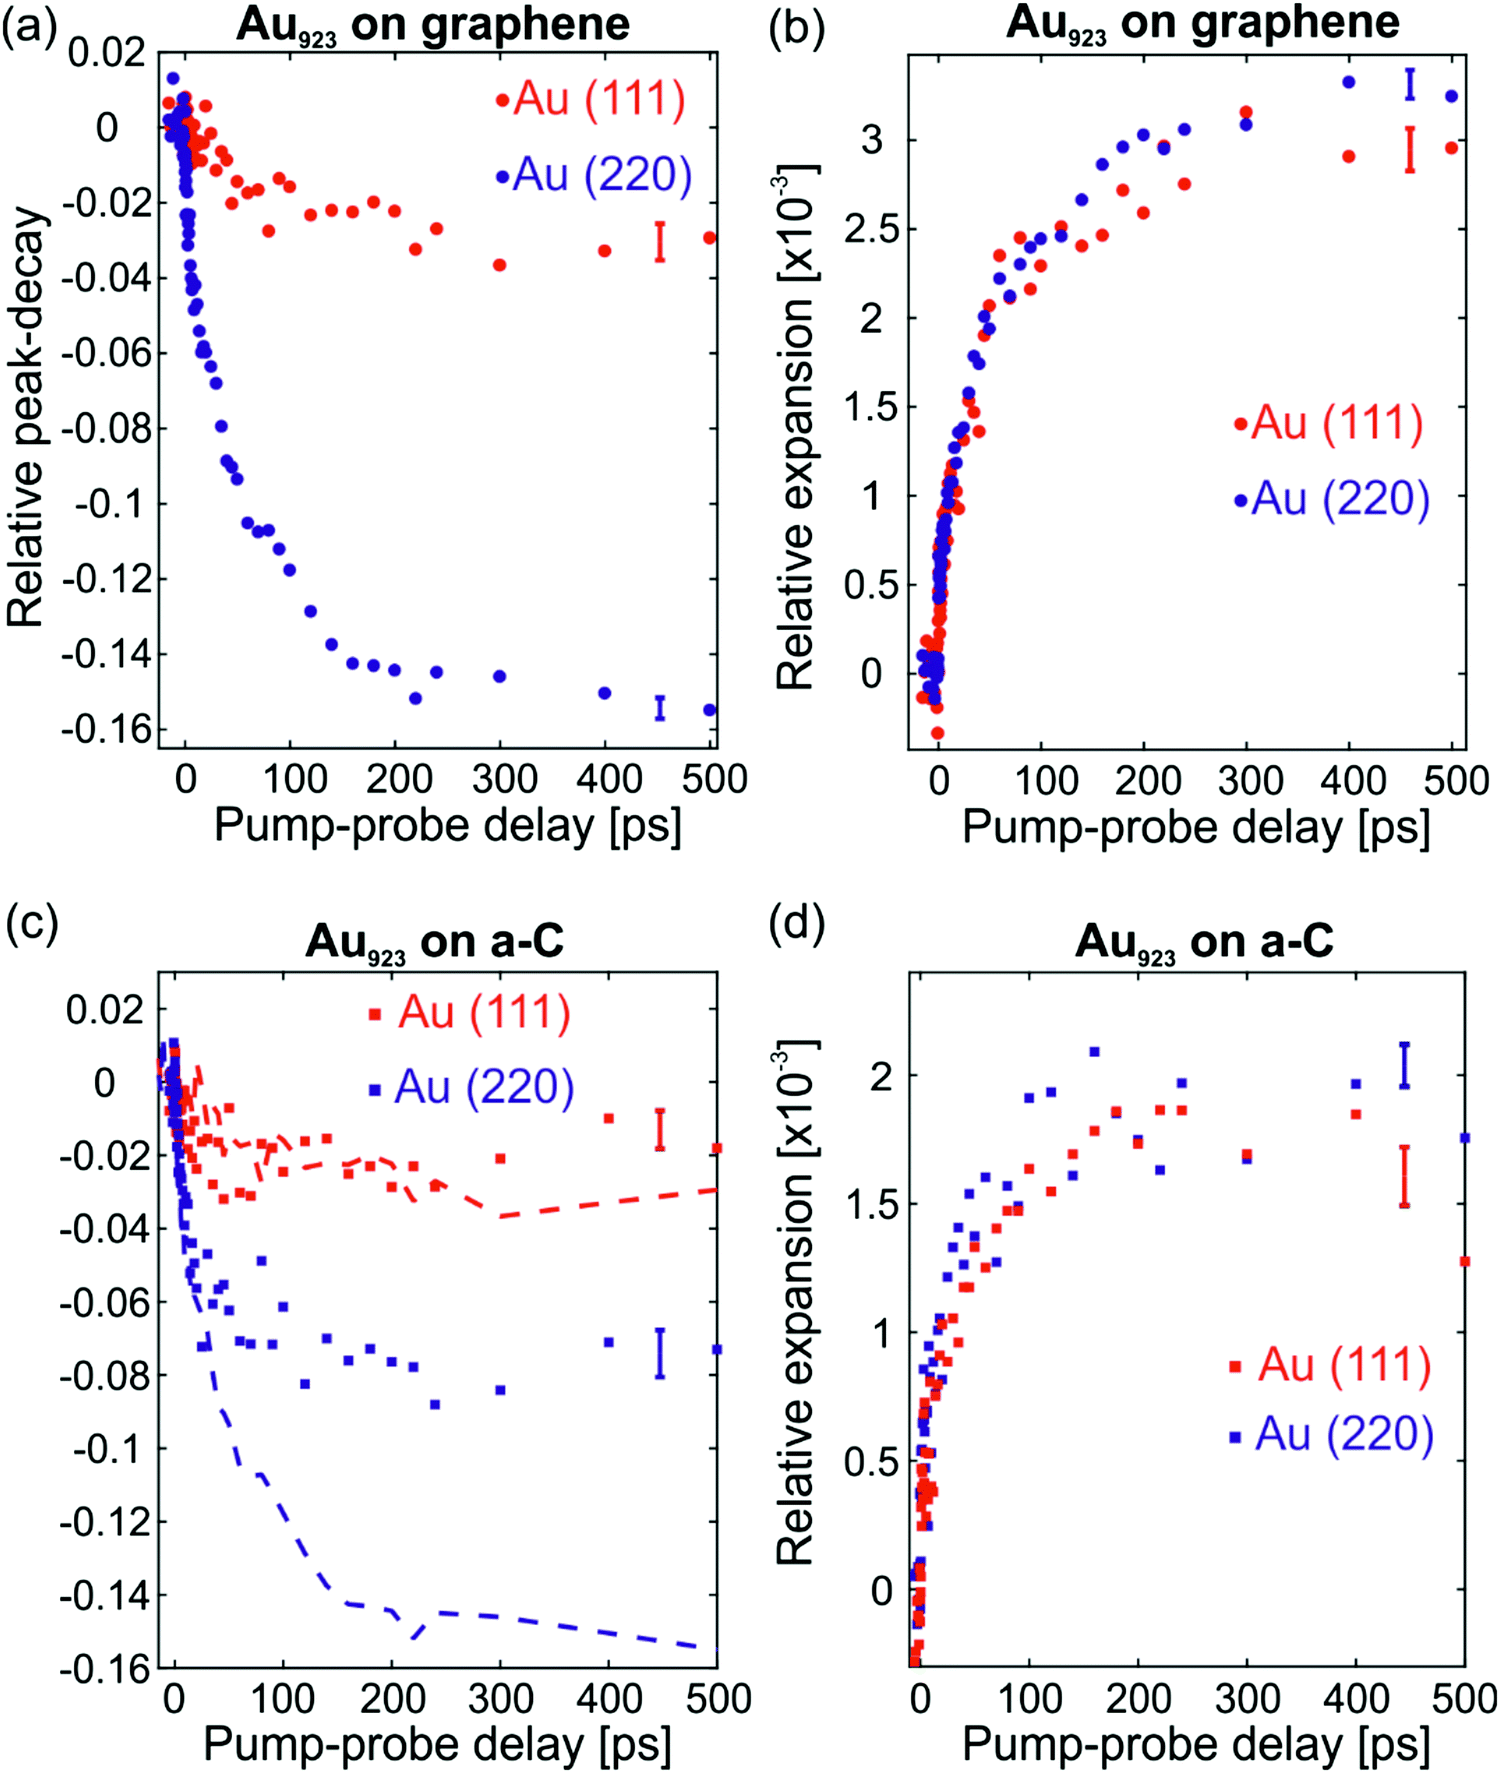 | ||
| Fig. 2 Structural dynamics of Au923 on graphene and comparison with Au923 on a-C. (a) Relative peak-decay of the (111) and (220) peaks of Au NCs on graphene from FED experiments. (b) Relative expansion of the lattice, probed by the position of the (111) and (220) diffraction peaks again for Au NCs on graphene. (c) Relative peak-decay of the (111) and (220) peaks of Au NCs on a-C (squares) and comparison with Au NCs on graphene (same color dashed lines). (d) Relative expansion for the (111) and (220) peaks of Au NCs on a-C. The comparison of the two heterostructures reveals a strong anisotropy in the peak decay dynamics of Au NCs on graphene [large decay of the (220) peak] that cannot be explained based on the Debye–Waller theory of diffraction. The lattice expansion is isotropic in both cases and proportional to the lattice temperature. Error bars indicate the standard deviation of the results due to the measurement and the fitting procedure. | ||
The relative peak-decay of (111) and (220) for Au NCs on graphene, shown in Fig. 2a, is compared with the relative decay of the same peaks for Au NCs on a-C in Fig. 2c (squares for a-C and dashed lines for graphene). Although the observed peak-decay depends on the incident laser fluence and other factors, this comparison reveals some fundamental differences between the two samples. The peak-decay of Au(111) happens to coincide for both types of substrate, while the decay of Au(220) is significantly more intense for graphene compared to a-C. If the laser-excited motions of the Au nanolattices were the same in both experiments, the (220) peak should behave in the same manner for both substrates, as the (111) does. The observed peak-decay suggests some anisotropic motion of the Au NCs on graphene. The NC lattice expansion, however, which is inherently connected with atomic vibrations, is isotropic for the NCs on both types of substrates, see Fig. 2b and d. Hence the observed anisotropic motion of Au923 on graphene is not of vibrational origin. We elaborate on this in the following.
In NCs, lattice heating can be estimated from the lattice expansion (Fig. 2b). The thermal expansion coefficient of Au923 NCs is aL = (9.5 ± 0.7) × 10−6 K−1. The average value and the error (standard deviation) of aL stem from FED measurements carried out on different amorphous substrates with non-oriented Au923 NCs (see Vasileiadis et al.12). The resulting lattice temperature evolution (Fig. 3a) shows biexponential dynamics. Approximately 20% of the effect occurs with a time constant below 3 ps due to fast electron–phonon interaction inside the NCs. Most of the heating (80%) arises from slower interfacial phonon transfer from the graphene substrate to the Au NCs with a time constant τ = (62 ± 4) ps. The errors on the time constants are equal with one standard deviation and express the uncertainty of the fittings with biexponential functions. This lattice dynamics agrees well with the average Debye–Waller effect: the enhanced atomic vibrations, expressed by the atomic mean-square-displacement (〈u2〉, denoted MSD), cause a decay of the diffraction intensity (I) according to: I = I0exp(−4π2〈u2〉s2/3), which can be related to the lattice temperature.20 A detailed Debye–Waller analysis of the individual diffraction peaks of Au923 on graphene suggest different MSDs as shown in the ESI† (Fig. S2a), while the peaks behave as expected for Au923 on a-C (Fig. S2b).
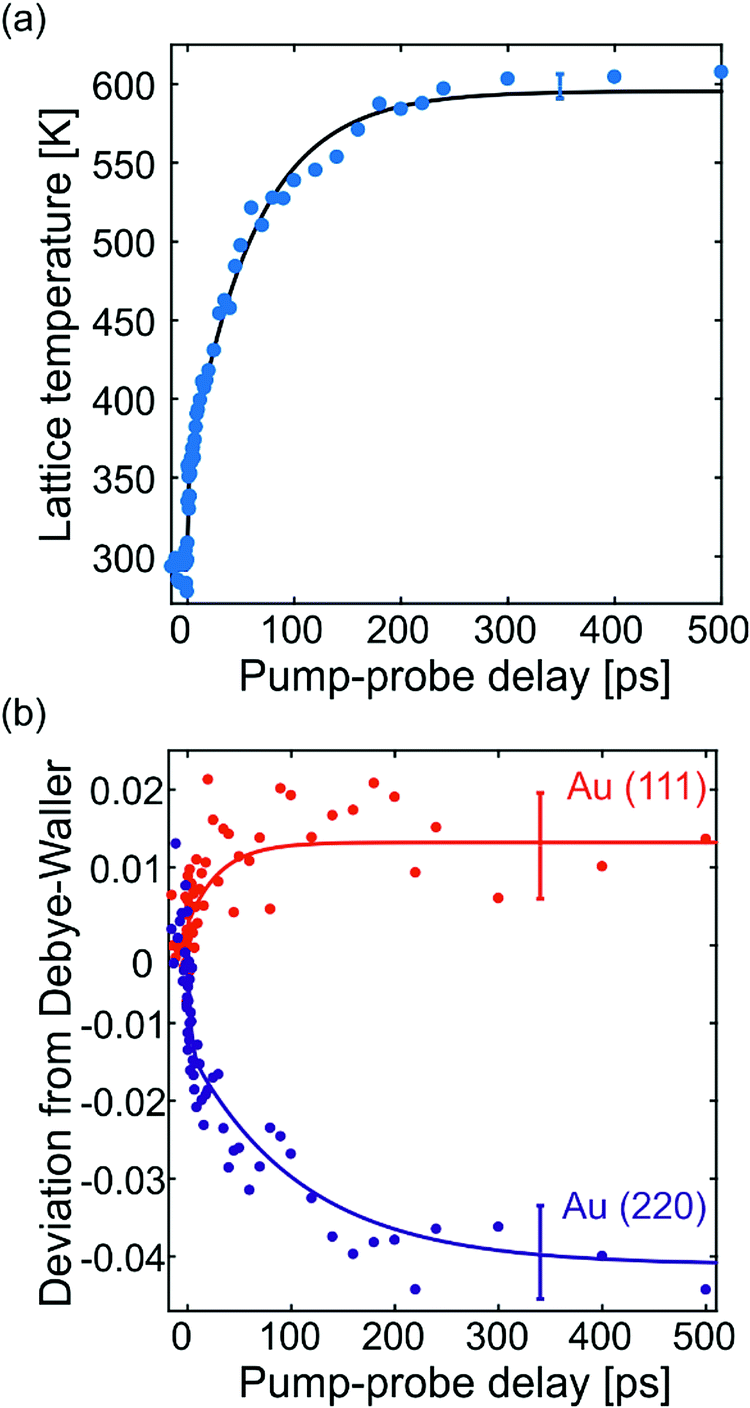 | ||
| Fig. 3 Time-resolved lattice heating from expansion and deviation of peak decay from the Debye–Waller behavior. (a) Lattice temperature of Au NCs as a function of pump–probe delay time (blue data-points) as calculated from thermal expansion and the biexponential fitting (black solid line). (b) Deviation from the Debye–Waller behavior as a function of pump–probe delay time for the (111) and the (220) peaks (red and blue data-points, respectively) and biexponential fittings (solid lines). The two data-sets presented in this figure disentangle the two processes that affect peak decay dynamics, namely, lattice heating (a) and disorientation of NCs (b). Error bars indicate the standard deviation of the results due to the measurement and the fitting procedure. | ||
Using the average MSD of all diffraction peaks, it is possible to conceive the deviation of specific diffraction peaks as a function of time. This is shown for the (111) and (220) peaks in Fig. 3b. The deviation of the (111) peak is positive by ∼1%, while the (220) peak shows the opposite behavior by up to 4%. The deviation of the (220) peak has bi-exponential dynamics with time constants τ1 = (4 ± 2) ps (∼40% of the effect) and τ2 = (110 ± 40) ps. The deviation dynamics is a fraction of the total peak-decay and, thus, its relative changes have decreased signal-to-noise ratio. For this reason, the uncertainties of the extracted time constants τ1 and τ2 are larger compared to other measured quantities.
At this point, we focus on the nature of the processes that cause the deviations of the (111) and (220) peaks shown in Fig. 3b. Before laser excitation, Au923 NCs on graphene have enhanced (220) peak and suppressed (111) peak compared to randomly oriented NCs on a-C (Fig. 1d). This indicates a partial (111) crystallographic orientation of the Au NCs normal to the graphene substrate, i.e., parallel to the electron beam. Laser excitation can potentially initiate forces that destabilize the NCs orientation. Ultrafast lattice heating is causing all peaks to decay, but NC disorientation can enhance the (111) peak and suppress the (220) peak (Fig. 3b). This interpretation is in agreement with the recent publication of VandenBussche and Flannigan21 who showed that tilting thin-films with crystallographic texture by few degrees produces measurable deviations of the thermally-induced peak decays from the Debye–Waller effect. In addition, the work of VandenBussche and Flannigan verified experimentally that tilting the specimen does not affect the lattice temperature extracted from thermal expansion.
In graphene, excitation and thermalization of acoustic waves (transverse and longitudinal phonons termed TA and LA, respectively) occurs within the first 100 ps.22,23 The timescale for generation of flexural ZA phonons (out of graphene plane atomic vibrations) and dynamic rippling is in the order of 50 ps.24 Detailed theoretical considerations by Panizon et al.2 have shown that transfer of momentum from graphene to adsorbed Au NCs is carried out by flexural ZA phonons or by TA and LA phonons coupled anharmonically to ZA. It is thus plausible that, in the present FED experiments, generation of ZA phonons on the graphene surface exert forces and torsions on the Au923 NCs causing their disorientation. The Au/graphene interface is characterized by low adherence.25 Au NCs on graphene and graphite have high translational diffusivity, comparable with that of single adatoms.17 The binding energy per C atom (30 meV)26 is on the order of the thermal energy (kBT) at room temperature. Hence, Au NCs on graphitic surfaces have translational and rotational mobility.1,27 Translations of the NC center-of-mass are suppressed in the investigated samples due to surface defects of the graphene substrates,16 but rotations are expected to be present. The various motions of NCs on graphene can occur within tens of picoseconds and all degrees of freedom are coupled.1,2,27
Molecular dynamics and diffraction simulations
In order to get microscopic insight into the translations and rotations of NCs we employ: (i) classical MD simulations to visualize motions of Au923 NCs on graphene in real space and (ii) electron diffraction simulations to check if these motions have an observable effect in reciprocal space experiments. All Au923/graphene model systems simulated with MD consist of one Au923 NC (either FCC or Dh) supported by a single-sheet graphene in a rectangular simulation box of (7 × 7.1 × 15) nm3 subject to periodic boundary conditions. This simulation box mimics the experimentally observed surface density of Au NCs shown in Fig. 1a with a nominal surface density of 2 NCs per 100 nm2. The Au923 NC is placed at 1 nm distance from graphene, in order to get adsorbed, with a completely random initial orientation. This step is repeated ten times for each simulated Au923 NC.A series of NVT MD simulations (constant number of particles, volume and temperature) are repeated ten times for FCC and ten times for Dh NCs starting from T = 600 K and gradually cooling down to T = 300 K with temperature steps of 50 K. At each temperature, the NVT MD simulation lasts 2 ns to ensure full system equilibration as monitored by the time evolution of the total energy of the system as well as the interaction energy between the Au923 NC and graphene. For the calculation of all properties of interest, only the last 1 ns of the simulation is used so that the modelled NCs are well-adsorbed and relaxed on graphene. All predicted quantities are averaged over 20 different trajectories (10 for each model system). Au923 NCs are modeled as a set of Lennard-Jones (12-6 LJ) Au atoms according to Heinz et al.28 Graphene is modeled through the all-atom DREIDING force-field,29 already employed for the study of carbon nanotube- and graphene-based polymer nanocomposites.30–32 The interactions of Au and graphene atoms are modelled with a 12-6 LJ potential according to Lewis et al.17 All MD simulations are executed with the LAMMPS software33 (see also S3, ESI†).
Since the experimental data capture the reciprocal-space motions of the Au NCs, the real-space trajectories are used to calculate time-averaged diffraction patterns for each temperature and for each Au NC, using the method described by Coleman et al.34 integrated in LAMMPS. The radius of the Ewald sphere corresponds to that of the FED experiments and its thickness is selected equal to 0.06 Å−1. The computational grid of the reciprocal-space has a spacing of 0.007 Å−1. In order to disentangle the effect of NC motions from that of lattice heating, the diffracted electrons arrive either perpendicular to the graphene plane (as in the FED experiment), or in powder-diffraction mode. At this point, we describe in more detail the exact mechanism through which the NCs acquire a preferred orientation on graphene. Few adatoms on the surface of an as-adsorbed NC can prevent it from acquiring its most favorable orientation (see S4, ESI†). Adatoms on Au NCs are known to be very mobile.35 Heating at 600 K for one nanosecond (equilibration phase) allows adatoms to diffuse away from the Au/C interface, the NC orientation to relax and the simulated diffraction patterns to be characterized by crystallographic texture. The observation that surface imperfections containing few adatoms can modify crystallographic texture is important for the comparison of simulated and experimental diffraction patterns.
The simulated electron diffraction patterns are radially averaged, and the results are shown in Fig. 4. These patterns correspond to diffracted electrons arriving perpendicular to graphene as in the FED experiments. Fig. 4a shows the average diffraction pattern of FCC NCs at 300 K averaged over 10 MD simulations. We note that NCs with FCC structure are most favorably attached on graphene via their (111) surface facets. This preferential orientation is due to: (i) the large area of the (111) facets of FCC NCs and (ii) the stronger adhesion of the Au/C interface for this surface termination.26 Hence, the (111) peak has less intensity that the (220) one. Fig. 4b shows the average diffraction pattern of Dh NCs at 300 K averaged over 10 MD simulations. The Dh Au923 NCs have large (100) facets. For that reason, Dh NCs attach on graphene most favorably with their (100) facets. Yet, their crystallographic texture is again (111). Because Dh NCs contain crystalline tetrahedral domains, the intensity of the (220) peak becomes comparable to that of (111).
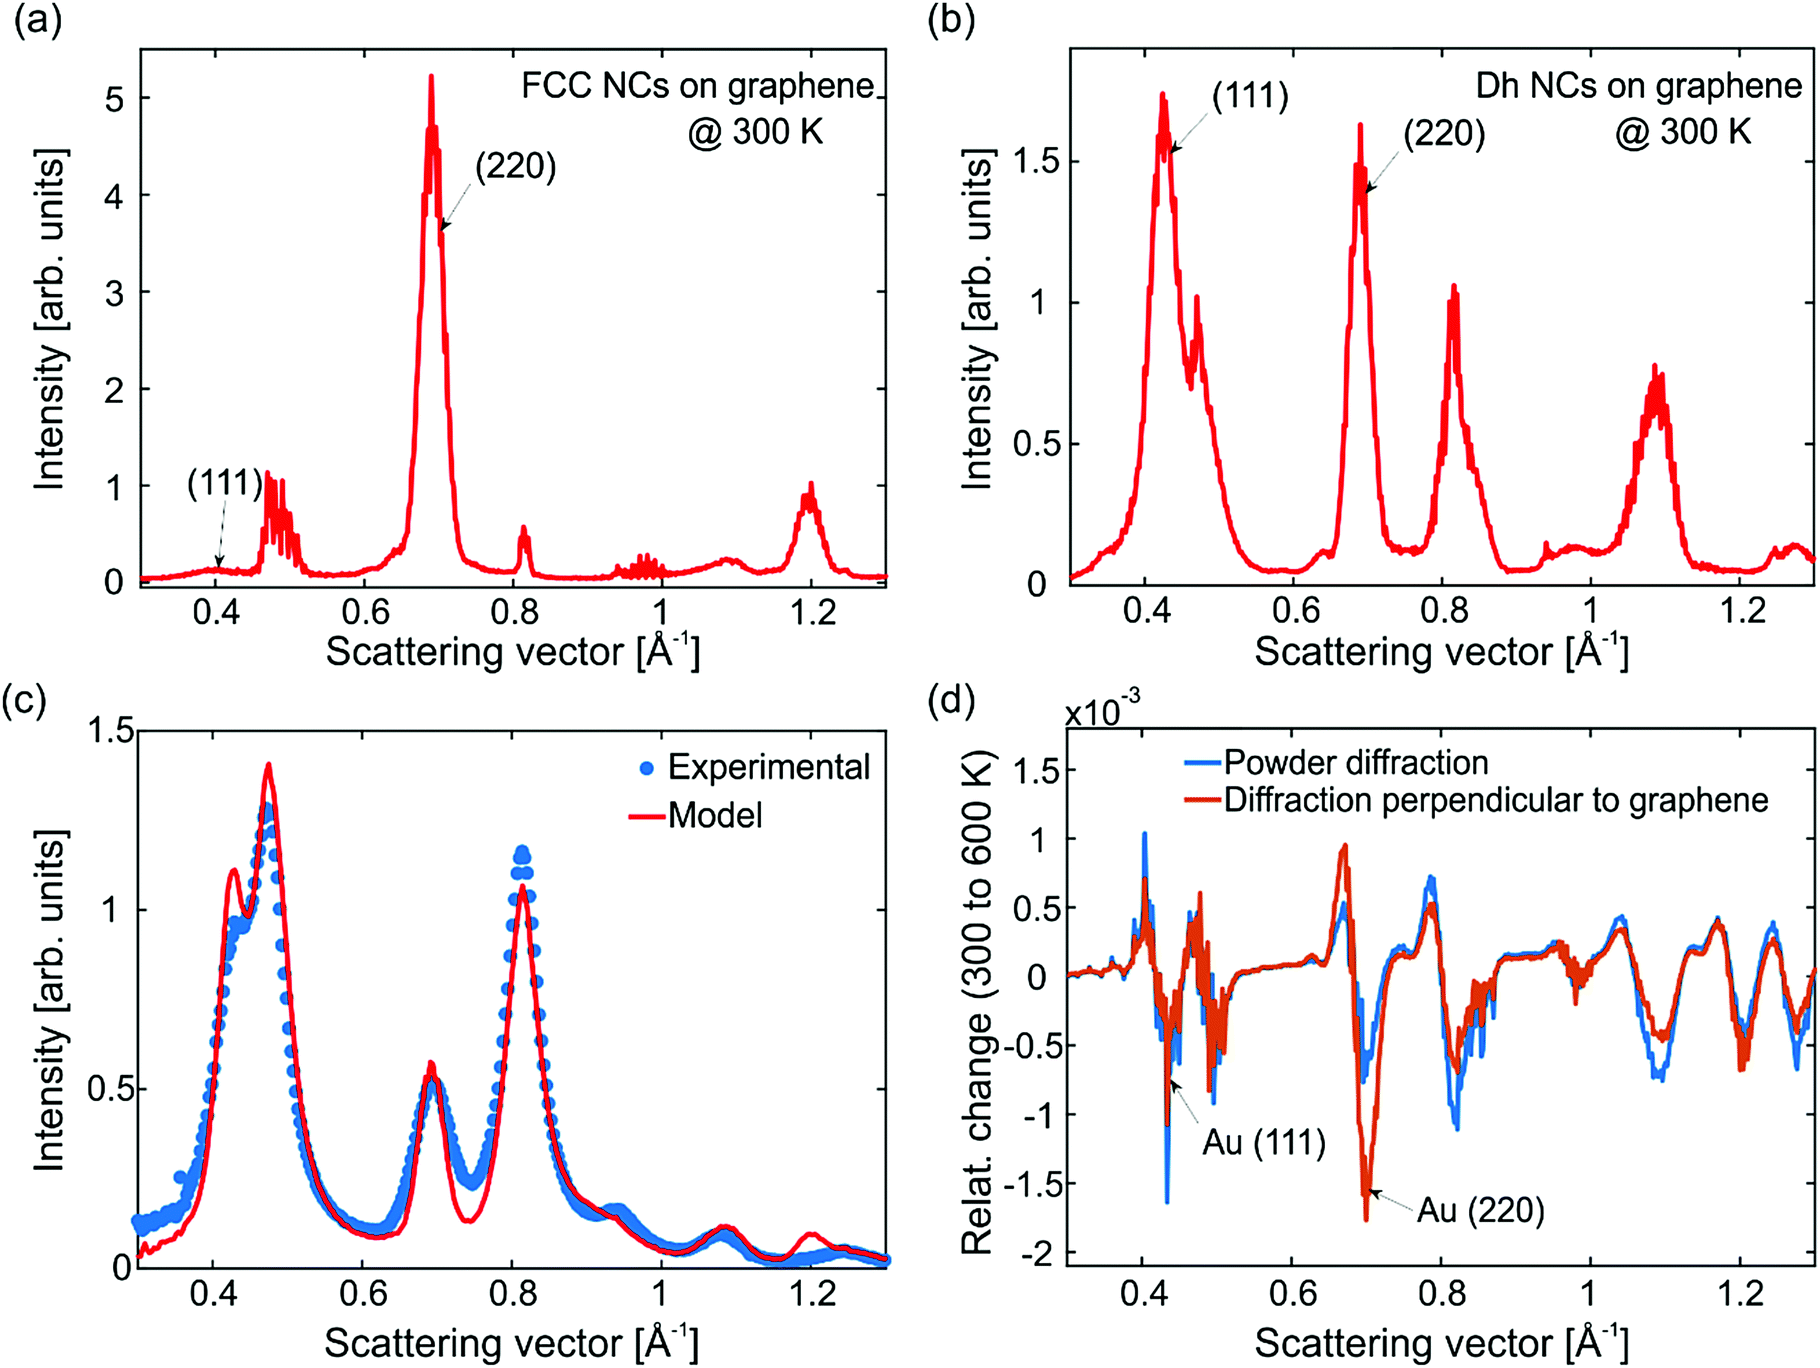 | ||
| Fig. 4 Electron diffraction simulations from the MD trajectories. Simulated electron diffraction patterns of FCC (a) and Dh (b) NCs averaged over 10 MD simulations each. In both cases the temperature is 300 K and the electron beam arrives perpendicular to graphene and the (111) crystal planes of FCC NCs, giving rise to an intense (220) peak. (c) Comparison of the simulations with the experimental data assuming that the diffraction pattern contains contribution from oriented NCs (well-defined FCC and Dh structures as in MD), randomly oriented Au and graphene. The relevant proportions of each contribution have been determined experimentally with electron microscopy. (d) Relative change of intensity between 600 K and 300 K as a function of the scattering vector for electrons arriving perpendicular to graphene (orange curve) and for powder diffraction (blue curve). The dynamics of the (220) peak are the most sensitive to the electron beam direction. When the electrons arrive perpendicular to graphene, the (220) peak shows the strongest decay. | ||
The calculated diffraction patterns of FCC and Dh NCs cannot be readily compared with the experimental diffraction patterns, since the investigated samples contain additional structures, see Fig. S4 and S5 (ESI†). In order to reproduce the experimental data, we made the following considerations: FCC and Dh NCs with well-defined surface facets can acquire a preferred orientation on graphene. However, icosahedral (Ih) and unidentified NCs as well as aggregates (dimers and trimers) have very small or irregular surface facets, complicated internal structure and consequently random orientations. With this assumption, we have combined the diffraction patterns of the graphene substrate and randomly oriented Au NCs (Fig. 1d) with the diffraction patterns of FCC and Dh NCs (Fig. 4a and b) to model the FED data. The simulated theoretical diffraction pattern is shown in Fig. 4c (red solid line) together with the experimental data at equilibrium (blue data-points). The temperature in both cases corresponds to ∼300 K. In order to produce the red model curve in Fig. 4c we have first performed a statistical electron microscopy analysis of the samples, which revealed that 72% of the NCs have well-defined, oriented FCC and Dh structures while 28% have irregular shapes and random orientations. Subsequently, we have estimated the scattering cross-section of each structural allotrope and, finally, we have combined their theoretical diffraction patterns according to their experimental abundancies (see also S5, ESI†).
The next step is to study the effect of heat on the diffraction patterns. Fig. 4d shows the relative change of intensity (I) as a function of the scattering vector (S) at 600 K and 300 K. The plotted quantity is  . The electrons arrive either perpendicular to graphene as in the FED experiment (orange curve) or in powder diffraction mode (blue curve). Upon heating, the simulations capture a number of phenomena that are also visible in the FED experiments like decay of diffraction peaks, shift to lower scattering vectors (thermal expansion) and enhancement of the inelastic background. Notably, when the electron beam arrives perpendicular to graphene, the (220) peak shows the largest decay. This behavior is not present for theoretical powder diffraction. In fact, both the simulations and the experiments show that the largest intensity decay occurs in the (220) peak, see Fig. 2 and Fig. S6 (ESI†). MD simulations are in accordance with the scenario that NC orientation is suppressed by rotations changing the diffraction patterns. Such rotations are indeed evident from the real space trajectories.
Discussion
Fig. 5a shows snapshots from simulations of a Dh NC at various temperatures for illustration purposes. No structural changes are observed apart from a few adatoms diffusing on the NC surface. The NCs can exhibit translations and rotations relative to graphene. The angular momentum vector of the rotations can be perpendicular or parallel to the surface. For each snapshot, the Au atoms are colored according to the angle φ formed by the (111) facet and the z-axis (z is parallel to electron beam and vertical to graphene). Rotations along φ are constrained to few degrees (librations) and can disorient the NCs with respect to the electron beam. The angle φ has a temperature-dependent statistical distribution, shown in Fig. 5b for 300 K (blue) and 600 K (orange). This temperature dependence is the reason for the deviation of the diffraction dynamics from the predictions of the Debye–Waller effect. The MD simulations give an average libration angle of φ = 2.2° at 300 K and of φ = 3.2° at 600 K. The frequency of librations is 57 GHz (see S7, ESI†), meaning that diffraction signatures of librations can be as fast as T/4 ≅ 4 ps, which agrees with the fast time constant τ1 of the deviation of the (220) peak.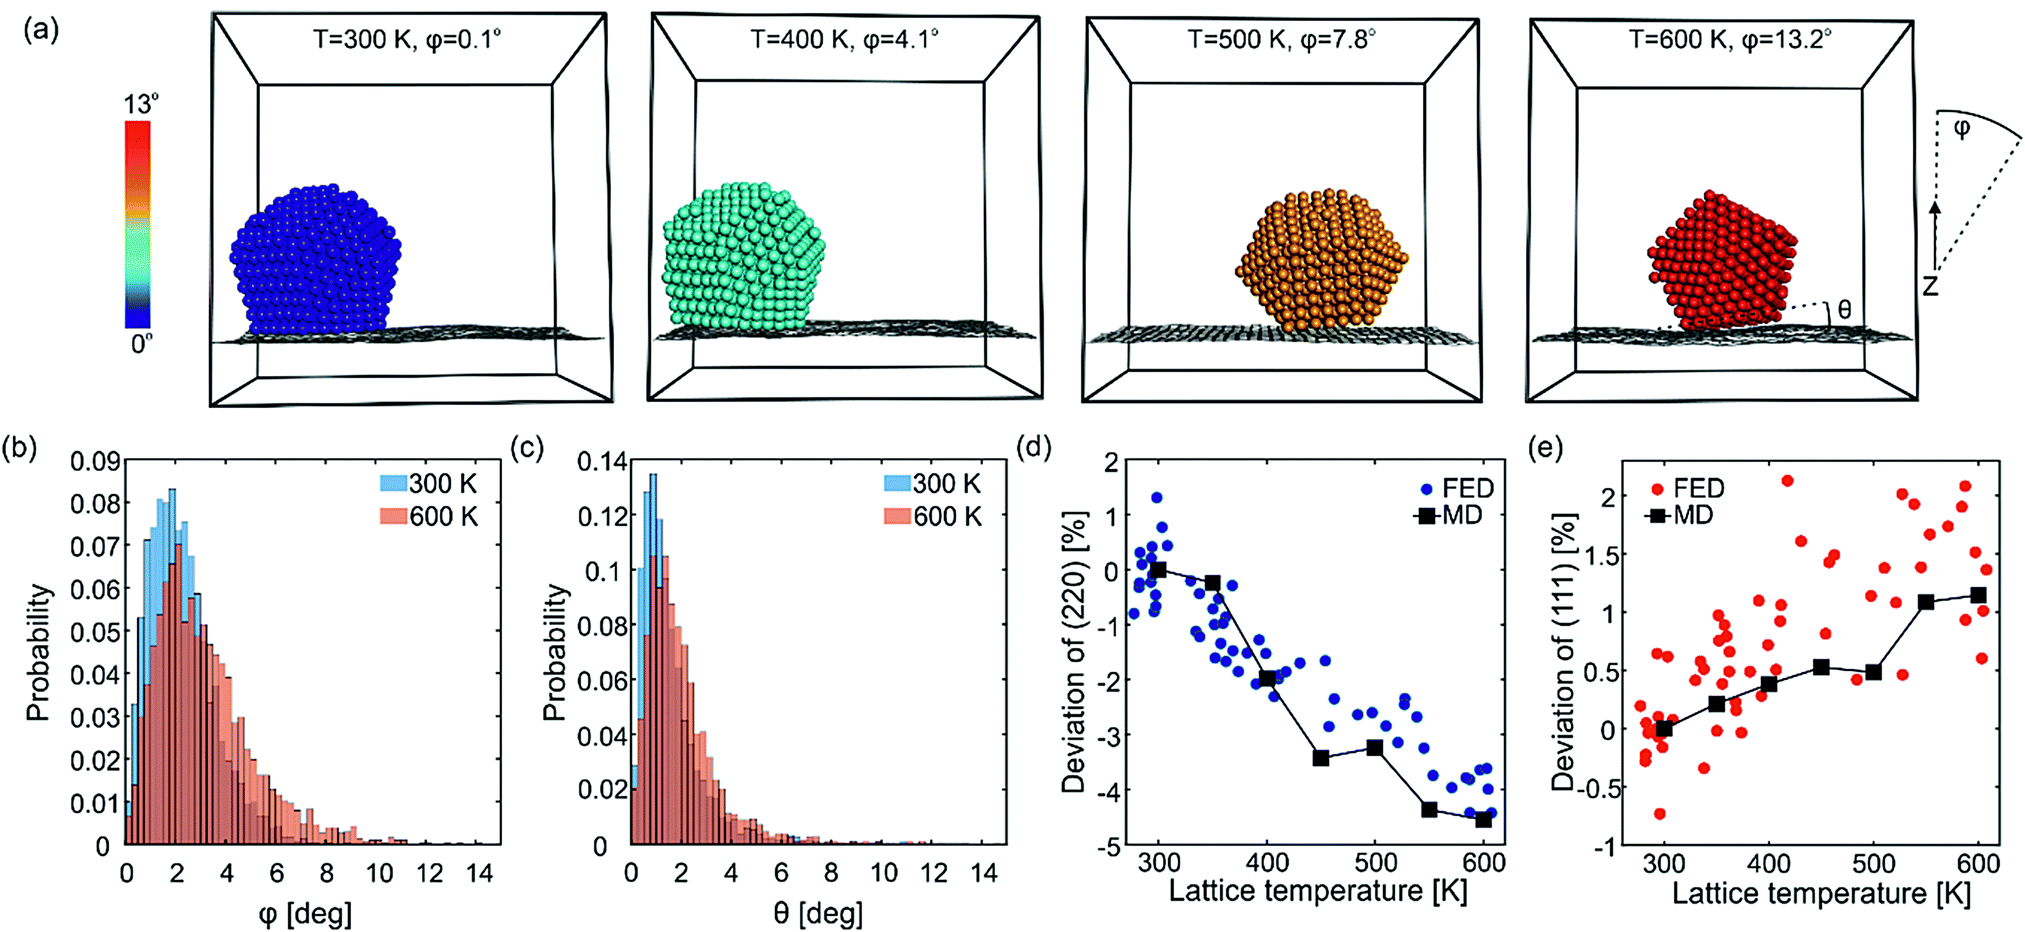 | ||
| Fig. 5 Librations of Au923 on graphene and deviations from the Debye–Waller peak decay. (a) Snapshots from one of the MD simulations showing the enhancement of NC librations (constrained rotations) as the temperature rises. The atoms are colored according to the libration angle (color bar in the left). The angles φ and θ of the NC are measured with respect to the incident electron beam and the underlying graphene layer, respectively. (b) and (c) Statistical distribution of the angles φ and θ averaged over all 20 MD runs. (d) and (e) Deviation of the peak decay from the expected Debye–Waller behavior for the (220) and (111) peaks, respectively. The MD simulations are shown with squares connected by lines and the FED data are shown with circles. In order to compare MD simulations with FED experiments, the temperature in the time-resolved measurements was extracted from lattice expansion (Fig. 3b). | ||
The NCs are not simply following the flexural motions of graphene but they can transiently unstick and tilt with different angle. In order to understand the dynamic interface of Au NCs and graphene, it is also meaningful to examine the angle θ formed by the normal vectors of the Au surface facet and the underlying area of graphene (see dashed lines on the last snapshot of Fig. 5a). Fig. 5c shows a histogram of the angle θ at 300 K (blue) and 600 K (orange). Only a small number of NCs are in the ground state, i.e., well-attached on graphene (θ ∼ 0°). Most NCs are accumulated on a critical angle θ ∼ 1°. A considerable number of NCs are occasionally tilted more than 1° due to thermal fluctuations. As the temperature increases from 300 K to 600 K, the fraction of well-attached NCs decreases and the fraction of NCs with large θ angles increases, meaning that librations change the interface between Au and C. On average θ is 1.6° at 300 K and 2.0° at 600 K.
We now compare the predicted deviations from the Debye–Waller behavior with the experimental observations. For this, we determine the temperature-induced relative decay of the (111) and (220) peaks in the simulated diffraction patterns. This is done for electrons arriving perpendicular to graphene (sensitive to the Debye–Waller effect and NC librations) as well as for powder diffraction (only sensitive to the Debye–Waller effect). The deviation between the two types of decay is shown in Fig. 5d for the (220) peak and in Fig. 5e for the (111) peak. When the temperature rises from 300 K to 600 K, NC librations cause an additional decay of the (220) peak by ∼4% and a reduced decay of the (111) peak by ∼1%, in very good agreement with the experiments. Fig. 5d and e show, for comparison, the experimental deviation from the Debye–Waller behavior as a function of the NC lattice temperature (extracted from the thermal expansion) for the (220) and (111) peaks, respectively (see S8 (ESI†) for additional FED measurements with different fluences).
The initial state (t < 0, TL ∼ 300 K) and the final state (t = 500 ps, TL ∼ 600 K) of the FED experiment have been captured by the MD simulations. The energy of librations is estimated to be 40 meV per NC at 300 K and 70 meV per NC at 600 K (see S9, ESI†). The excess energy (30 meV per NC) is transferred via a bi-exponential process as shown with the FED experiment (Fig. 3b). The time constant and the amplitude of each process suggest two energy transfer rates of 3 meV ps−1 and 0.2 meV ps−1 per NC. Dynamics containing multiple processes can arise from the excitation and thermalization of acoustic phonons in laser-excited graphene, the timescales of which range from 1 to 115 ps.23 The substrate phonons most efficient in transferring momentum to the NCs are flexural ZA phonons2 with a wavelength λ ≳ 2.6 nm (2.6 nm is the characteristic dimension of the Au923 NC binding facet). It is expected that the transfer of linear momentum will be accompanied by transfer of angular momentum, since the ZA phonons propagate parallel to the NC-graphene interface, thereby exerting torque on the NC upon scattering.
Conclusions
In summary, we demonstrate that femtosecond electron diffraction can probe both nonequilibrium phonon populations and nanoparticle rotational motions, providing a complete picture of the fundamental energy excitation associated with atomic motion. This opens the way for further studies of ultrafast interactions between nanostructures and surfaces in nonequilibrium conditions. Quantitative, real-time information on librations is obtained by analysis of the deviations of elastic scattering signal from the conventional temperature-dependent (i.e. Debye–Waller) effects. As a reverse conclusion, librations need to be considered for detailed investigations of nano-objects on surfaces using microscopy, diffraction and holography. Molecular dynamics coupled with diffraction simulations of Au nanoclusters on graphene show librational motion in good agreement with experiment in terms of amplitude as well as dynamics. Acoustic flexural modes of the ultrathin substrate are identified as quasi-impulse driving force of the nanocluster's rotational motion. The energy stored in librations is a considerable fraction of the energy barriers for translational and rotational diffusion of NCs on graphene. Hence, librations are expected to play an important role in various heat- and mass-transport phenomena by modulating the potential energy surface of other degrees of freedom.Conflicts of interest
There are no conflicts to declare.Acknowledgements
This project has received funding from the Max Planck Society and from the European Research Council (ERC) under the European Union's Horizon 2020 research and innovation program (grant agreement number ERC-2015-CoG-682843). We thank the Engineering and Physical Sciences Research Council (EPSRC) and the Natural Environment Research Council (NERC) for financial support of NC synthesis and characterization in UK. Computational time for the MD and electron diffraction simulations was granted from the Greek Research & Technology Network (GRNET) in the National HPC facility-ARIS-under project THIOSIM (pr005043). The authors acknowledge Dimitrios Dellis for technical support regarding MD run execution on ARIS. Open Access funding provided by the Max Planck Society.References
- R. Guerra, U. Tartaglino, A. Vanossi and E. Tosatti, Ballistic Nanofriction, Nat. Mater., 2010, 9, 634–637 CrossRef CAS PubMed.
- E. Panizon, R. Guerra and E. Tosatti, Ballistic Thermophoresis of Adsorbates on Free-Standing Graphene, Proc. Natl. Acad. Sci. U. S. A., 2017, 114(34), E7035–E7044 CrossRef CAS PubMed.
- T. Hynninen, G. Cabailh, A. S. Foster and C. Barth, Defect Mediated Manipulation of Nanoclusters on an Insulator, Sci. Rep., 2013, 3, 1270 CrossRef PubMed.
- E. Cihan, S. Ipek, E. Durgun and M. Z. Baykara, Structural Lubricity under Ambient Conditions, Nat. Commun., 2016, 7, 12055 CrossRef CAS PubMed.
- M. S. Lodge, C. Tang, B. T. Blue, W. A. Hubbard, A. Martini, B. D. Dawson and M. Ishigami, Lubricity of Gold Nanocrystals on Graphene Measured Using Quartz Crystal Microbalance, Sci. Rep., 2016, 6, 31837 CrossRef CAS.
- N. Ogawa, K. Hoshisashi, H. Sekiguchi, K. Ichiyanagi, Y. Matsushita, Y. Hirohata, S. Suzuki, A. Ishikawa and Y. C. Sasaki, Tracking 3D Picometer-Scale Motions of Single Nanoparticles with High-Energy Electron Probes, Sci. Rep., 2013, 3, 2201 CrossRef PubMed.
- J. Verbeeck, H. Tian and G. Van Tendeloo, How to Manipulate Nanoparticles with an Electron Beam?, Adv. Mater., 2013, 25, 1114–1117 CrossRef CAS PubMed.
- D. Rings, D. Chakraborty and K. Kroy, Rotational Hot Brownian Motion, New J. Phys., 2012, 14, 053012 CrossRef.
- X. Fu, B. Chen, J. Tang, M. T. Hassan and A. H. Zewail, Imaging Rotational Dynamics of Nanoparticles in Liquid by 4D Electron Microscopy, Science, 2017, 355, 494–498 CrossRef CAS PubMed.
- X. Fu, B. Chen, J. Tang, M. T. Hassan and A. H. Zewail, Photoinduced Nanobubble-Driven Superfast Diffusion of Nanoparticles Imaged by 4D Electron Microscopy, Sci. Adv., 2017, 3, e1701160 CrossRef PubMed.
- X. Fu, B. Chen, C. Li, H. Li, Z. M. Liao, D. Yu and A. H. Zewail, Direct Visualization of Photomorphic Reaction Dynamics of Plasmonic Nanoparticles in Liquid by Four-Dimensional Electron Microscopy, J. Phys. Chem. Lett., 2018, 9(14), 4045–4052 CrossRef CAS PubMed.
- T. Vasileiadis, L. Waldecker, D. Foster, A. Da Silva, D. Zahn, R. Bertoni, R. E. Palmer and R. Ernstorfer, Ultrafast Heat Flow in Heterostructures of Au Nanoclusters on Thin-Films: Atomic-Disorder Induced by Hot Electrons, ACS Nano, 2018, 12(8), 7710–7720 CrossRef CAS PubMed.
- L. Waldecker, R. Bertoni and R. Ernstorfer, Compact Femtosecond Electron Diffractometer with 100 KeV Electron Bunches Approaching the Single-Electron Pulse Duration Limit, J. Appl. Phys., 2015, 117, 044903 CrossRef.
- S. R. Plant, L. Cao and R. E. Palmer, Atomic Structure Control of Size-Selected Gold Nanoclusters during Formation, J. Am. Chem. Soc., 2014, 136(21), 7559–7562 CrossRef CAS PubMed.
- S. Pratontep, S. J. Carroll, C. Xirouchaki, M. Streun and R. E. Palmer, Size-Selected Cluster Beam Source Based on Radio Frequency Magnetron Plasma Sputtering and Gas Condensation, Rev. Sci. Instrum., 2005, 76(4), 045103 CrossRef.
- M. D. Vece, S. Palomba and R. E. Palmer, Pinning of Size-Selected Gold and Nickel Nanoclusters on Graphite, Phys. Rev. B: Condens. Matter Mater. Phys., 2005, 72, 073407 CrossRef.
- L. J. Lewis, P. Jensen, N. Combe and J. L. Barrat, Diffusion of Gold Nanoclusters on Graphite, Phys. Rev. B: Condens. Matter Mater. Phys., 2000, 61, 16084 CrossRef CAS.
- M. Gulde, A. N. Rissanou, V. Harmandaris, M. Müller, S. Schäfer and C. Ropers, Dynamics and Structure of Monolayer Polymer Crystallites on Graphene, Nano Lett., 2016, 16(11), 6994–7000 CrossRef CAS.
- M. Harb, R. Ernstorfer, T. Dartigalongue, C. T. Hebeisen, R. E. Jordan and R. J. D. Miller, Carrier Relaxation and Lattice Heating Dynamics in Silicon Revealed by Femtosecond Electron Diffraction, J. Phys. Chem. B, 2006, 110(50), 25308–25313 CrossRef CAS PubMed.
- L. M. Peng, S. L. Dudarev and M. J. Whelan, High-Energy Electron Diffraction and Microscopy, Oxford Science Publications, 2004 Search PubMed.
- E. J. VandenBussche and D. J. Flannigan, Sources of Error in Debye-Waller-Effect Measurements Relevant to Studies of Photoinduced Structural Dynamics, Ultramicroscopy, 2019, 196, 111–120 CrossRef CAS PubMed.
- M. Harb, H. Enquist, A. Jurgilaitis, F. T. Tuyakova, A. N. Obraztsov and J. Larsson, Phonon-Phonon Interactions in Photoexcited Graphite Studied by Ultrafast Electron Diffraction, Phys. Rev. B, 2016, 93, 104104 CrossRef.
- M. J. Stern, L. P. René De Cotret, M. R. Otto, R. P. Chatelain, J. P. Boisvert, M. Sutton and B. J. Siwick, Mapping Momentum-Dependent Electron-Phonon Coupling and Nonequilibrium Phonon Dynamics with Ultrafast Electron Diffuse Scattering, Phys. Rev. B, 2018, 97, 165416 CrossRef CAS.
- J. Hu, G. M. Vanacore, A. Cepellotti, N. Marzari and A. H. Zewail, Rippling Ultrafast Dynamics of Suspended 2D Monolayers, Graphene, Proc. Natl. Acad. Sci. U. S. A., 2016, 113(43), E6555–E6561 CrossRef CAS.
- R. S. Sundaram, M. Steiner, H. Y. Chiu, M. Engel, A. A. Bol, R. Krupke, M. Burghard, K. Kern and P. Avouris, The Graphene-Gold Interface and Its Implications for Nanoelectronics, Nano Lett., 2011, 11(9), 3833–3837 CrossRef CAS PubMed.
- G. Giovannetti, P. A. Khomyakov, G. Brocks, V. M. Karpan, J. Van Den Brink and P. J. Kelly, Doping Graphene with Metal Contacts, Phys. Rev. Lett., 2008, 101, 026803 CrossRef CAS PubMed.
- W. D. Luedtke and U. Landman, Slip Diffusion and Lévy Flights of an Adsorbed Gold Nanocluster, Phys. Rev. Lett., 1999, 82, 3835 CrossRef CAS.
- H. Heinz, R. A. Vaia, B. L. Farmer and R. R. Naik, Accurate Simulation of Surfaces and Interfaces of Face-Centered Cubic Metals Using 12-6 and 9-6 Lennard-Jones Potentials, J. Phys. Chem. C, 2008, 112(44), 17281–17290 CrossRef CAS.
- S. L. Mayo, B. D. Olafson and W. A. Goddard, DREIDING: A Generic Force Field for Molecular Simulations, J. Phys. Chem., 1990, 94(26), 8897–8909 CrossRef CAS.
- E. N. Skountzos, P. G. Mermigkis and V. G. Mavrantzas, Molecular Dynamics Study of an Atactic Poly(Methyl Methacrylate)-Carbon Nanotube Nanocomposite, J. Phys. Chem. B, 2018, 122(38), 9007–9021 CrossRef CAS PubMed.
- E. N. Skountzos, A. Anastassiou, V. G. Mavrantzas and D. N. Theodorou, Determination of the Mechanical Properties of a Poly(Methyl Methacrylate) Nanocomposite with Functionalized Graphene Sheets through Detailed Atomistic Simulations, Macromolecules, 2014, 47(22), 8072–8088 CrossRef CAS.
- K. D. Papadimitriou, E. N. Skountzos, S. S. Gkermpoura, I. Polyzos, V. G. Mavrantzas, C. Galiotis and C. Tsitsilianis, Molecular Modeling Combined with Advanced Chemistry for the Rational Design of Efficient Graphene Dispersing Agents, ACS Macro Lett., 2016, 5(1), 24–29 CrossRef CAS.
- S. Plimpton, Fast Parallel Algorithms for Short-Range Molecular Dynamics, J. Comput. Phys., 1995, 117(1), 1–19 CrossRef CAS.
- S. P. Coleman, D. E. Spearot and L. Capolungo, Virtual Diffraction Analysis of Ni [0 1 0] Symmetric Tilt Grain Boundaries, Modell. Simul. Mater. Sci. Eng., 2013, 21, 055020 CrossRef.
- Z. W. Wang and R. E. Palmer, Experimental Evidence for Fluctuating, Chiral-Type Au55 Clusters by Direct Atomic Imaging, Nano Lett., 2012, 12(11), 5510–5514 CrossRef CAS PubMed.
Footnote |
| † Electronic supplementary information (ESI) available: (1) Schematic illustration of the various NC motions and remarks on their energetics, (2) extraction of atomic MSD for Au923 NCs on graphene and on a-C, (3) additional information on the MD simulations, (4) effect of annealing on diffraction patterns, (5) quantification of crystallographic texture and characterization of NCs sizes and shapes, (6) additional comparisons of FED- and MD-derived dynamics of diffraction patterns, (7) damping and frequency of librations in the MD simulations, (8) additional fluence-dependent FED measurements, (9) energetics of librations and comparison of energies stored in atomic vibrations and NC librations, (10) additional information on the various fitting procedures. See DOI: 10.1039/c9nh00031c |
| This journal is © The Royal Society of Chemistry 2019 |