 Open Access Article
High-performance laminated luminescent solar concentrators based on colloidal carbon quantum dots
Haiguang
Zhao
 *ab,
Guiju
Liu
b and
Guangting
Han
a
aState Key Laboratory of Bio-Fibers and Eco-Textiles, Qingdao University, No. 308 Ningxia Road, Qingdao 266071, P. R. China. E-mail: hgzhao@qdu.edu.cn
bCollege of Physics, Qingdao University, No. 308 Ningxia Road, Qingdao 266071, P. R. China
First published on 5th November 2019
Abstract
Luminescent solar concentrators (LSCs) are light-weight, semitransparent and large-area sunlight collectors for solar-to-electricity conversion. To date, carbon quantum dots (C-QDs) have attracted a lot of attention due to their size/shape/composition tunable optical properties, high quantum yield, excellent photostability, lower toxicity and simple synthetic methods using earth-abundant and low-cost precursors. However, due to the overlap between their absorption and emission spectra, it is still challenging to fabricate high-efficiency LSCs based on C-dots. In this work, we used C-QDs to fabricate semi-transparent large-area laminated LSCs (10 × 10 cm2). C-QDs have the absorption spectrum ranging from 300 to 550 nm with a Stokes shift of 0.6 eV. By optimizing the concentration of C-QDs, the laminated LSC exhibits a highest ηopt of 1.6%, which is 1.6 times higher than that of a single-layer LSC (100 mW cm−2). In addition, the laminated LSC exhibits a power conversion efficiency of 0.7% under natural sunlight illumination (62 mW cm−2) with excellent photostability. These findings suggest that laminated structured LSCs could be used for efficient solar energy harvesting compared to single layer or tandem structured LSCs based on colloidal C-QDs.
1. Introduction
Luminescent solar concentrators (LSCs) are light-weight, semitransparent and large-area sunlight collectors for efficient solar-to-electricity conversion.1–5 A typical LSC consists of an optical waveguide coated or embedded with emissive fluorophores. Upon illumination, the fluorophores absorb sunlight and convert it into fluorescence. Because of the total internal refraction, the emission can be guided to the edges of the LSC. A photovoltaic cell is coupled at the edges of the LSC and it converts the concentrated fluorescence to electricity. As the lateral area of an LSC is larger than that of the edges, the use of expensive PV materials (e.g. single-crystalline silicon) is reduced.1,2 Once the external optical efficiency (defined as the ratio of the power of photons emitted from the LSC edges to the total power of photons impinging on the LSC through the top surface) of the LSC is higher than 6%, the LSC technology can largely reduce the cost of electricity.6 Another advantage in LSC technology is that one can control the optical properties of fluorophores in order to adjust the colour, transparency and performance of the LSCs.1 It is still a big challenge to obtain high optical efficiency LSCs due to the lack of efficient fluorophores.1,2,5,7–11Efficient fluorophores need to have wide absorption, high quantum yield (QY), good separation of emission and absorption spectra and high stability.2 Up to now, many types of fluorophores have been selected and used as building blocks for LSCs, including organic dyes/polymers, perovskite nanocrystals (NCs), quantum dots (QDs), upconversion NCs, proteins and carbon quantum dots (C-QDs).1,2,6–26 Among them, C-QDs, also known as carbon dots (C-dots), have attracted a lot of attention13,27–31 due to the following factors: (i) their broad absorption, high quantum yield (QY), low-cost, and eco-friendly toxic-metal-free composition; (ii) the simple wet chemistry approaches using earth-abundant, low-cost precursors in large quantities; (iii) some of the C-QDs are very photostable; and (iv) last but not least, the absorption and emission spectral overlap can be engineered by tuning the size/shape/composition and surface conditions of the C-dots. Recently, efficient and stable LSCs were fabricated by using C-QDs as efficient fluorophores (Table 1).10,12,18,32–36 For example, Gong et al. for the first time prepared single-layer LSCs based on N-doped C-QDs with an optical efficiency of 3.94% (LSC dimensions: 2.5 × 1.6 cm2);32 Zhou et al. prepared a tandem LSC based on two types of C-dots, achieving an external optical efficiency of 1.1% (LSC dimensions: 10 × 10 cm2);35 Talite et al. fabricated single-layer LSCs based on in situ cross-linked C-QDs with an external optical efficiency of ∼12% (LSC dimensions: 3 × 3 cm2).18 Due to their excellent photostability, C-QDs were also used as the top-protecting layer for tandem LSCs to enhance the stability of the bottom-layer LSC based on inorganic NCs (e.g. perovskite NCs10 and CdSe/CdS QDs12).
| LSC | η opt (%) | LSC dimensions (cm2) | Ref. |
|---|---|---|---|
| a Tandem LSCs based on two types of C-QDs with different emissions. b Laminated LSCs with the polymer/QD matrix inside glass. All other LSCs have a single layer architecture. | |||
| C-dotsb | 1.6 | 10 × 10 | This work |
| C-dots | 1 | 10 × 10 | This work |
| N-doped C-dots | 3.94 | 2.5 × 1.6 | 32 |
| C-dotsa | 1.1 | 10 × 10 | 35 |
| Cross-linked C-dots | 12 | 3 × 3 | 18 |
| Proteins | 2.58 | 2.5 × 2.5 | 24 |
| Si QDs | 2.9 | 12 × 12 | 14 |
| CuInS/ZnS QDsb | 8.1 | 10 × 10 | 7 |
To date, the major challenge in C-QD based LSCs is the lower external optical efficiency compared to other types of fluorophores (e.g. inorganic QDs, dyes and perovskite NCs) with identical LSC dimensions.1,3,4 Except a few blue-emitting C-dots, which can only absorb 5% of sunlight in the UV range and have good separation of emission and absorption spectra,35 most of the C-QDs have an overlap between absorption and emission spectra.18,32,33,37 As an LSC is quite large (up to meters), a small overlap between the absorption and emission spectra could lead to significant reabsorption energy loss.32,35 Currently there is still a lack of efficient methods to produce C-QDs with a small overlap between the emission and absorption spectra with high QYs. Compared to a single layer structure of LSCs, a laminated structure of LSCs can improve the optical efficiency of the LSCs by decreasing the energy loss because of the decrease of geometric factor (G).7,26 However, due to the decrease of the G factor, more solar cell materials are required on the edges of the laminated or tandem LSCs, which increases the cost of electricity. A laminated LSC can be integrated simply with solar cells on its edges, unlike tandem LSCs, in which two layers of solar cells need to be integrated separately with the LSCs.12 To the best of our knowledge, until now there are no reports for laminated LSCs using colloidal C-QDs, except inorganic QDs (CuInS2 and CdSe/CdS).7,26
In this work, laminated LSCs were fabricated by using C-QDs as fluorophores. The C-QDs were prepared using a hydrothermal reaction.30,31 The LSC based on C-QDs has the absorption spectrum ranging from 300 to 550 nm with a QY of 50% in methanol solution. We investigated the C-QD concentration effect on the reabsorption energy loss in laminated LSCs. By optimizing the concentration of C-QDs in polyvinyl pyrrolidone (PVP), the LSC (10 × 10 cm2) exhibits a highest ηopt of 1.6% (100 mW cm−2) and a PCE of 0.7% under natural sunlight illumination (62 mW cm−2). In addition, the LSC based on C-QDs exhibits excellent photostability, indicating that C-QDs are promising candidates for durable LSCs.
2. Results and discussion
2.1 Structure of C-dots
The C-QDs were synthesized via a hydrothermal approach using phloroglucinol as the precursor.30,31 The morphology and structure of the as-synthesized C-QDs were characterized by transmission electron microscopy (TEM), as shown in Fig. 1a. The C-QDs have a typical spherical shape with a mean size of 1.74 ± 0.6 nm (Fig. 1b). The selected area electron diffraction (SAED) pattern in the inset of Fig. 1a indicates that the structure of the C-QDs is a hexagonal graphene structure. The high-resolution TEM (HRTEM) image of an individual C-QD (inset of Fig. 1a) further reveals the graphene crystalline structure of C-QDs. The measured d spacing is around 2.12 Å, corresponding to the (100) plane of the hexagonal graphene structure.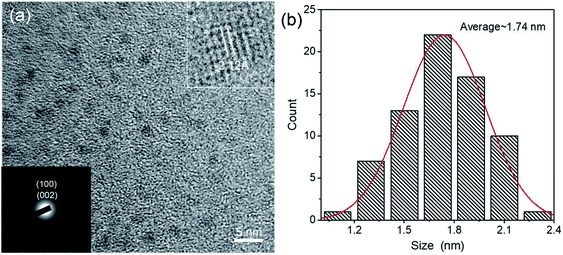 | ||
| Fig. 1 (a) Representative TEM image of C-QDs. Insets are the HRTEM image of an individual C-QD and SAED pattern. (b) The size distribution of C-QDs. | ||
2.2 Optical properties of C-dots
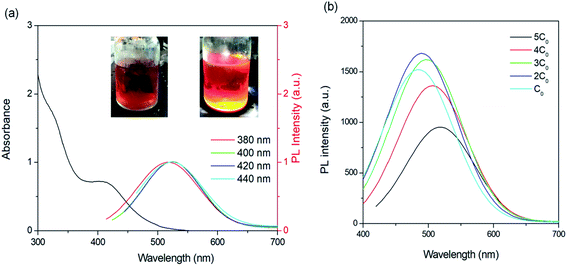
As shown in Fig. 2a, the as-synthesized C-QDs have an absorption spectrum ranging from 300–550 nm with a broad photoluminescence (PL) spectrum (400–700 nm). The broad absorption and emission in this work are different from the reported narrow absorption and emission using the same approach, which is because we did not purify the as-synthesized C-QD solution via silica column chromatography.30,31 The broad absorption and emission are mainly because of the wide size distribution of C-QDs. The broad absorption can match well the Sun's spectrum and contributes to the improved optical efficiency in LSCs based on C-dots. The obtained QY in this work is around 50 ± 5% in methanol solution, which is lower than that of the narrow-band triangular C-QDs as reported (up to 72%).30 The C-QDs exhibit a first-excitonic absorption peak at 3.02 eV and an emission peak at 2.36 eV, resulting in a large Stokes shift of 0.66 eV. This value is larger than that of most of the inorganic fluorophores.2,11,22 However, it is difficult to evaluate the reabsorption energy loss based on only Stokes shift for large-sized LSCs as we still observe a large overlap between the absorption and PL spectra. A bright colour was found for the C-QDs upon simulated sunlight illumination (inset Fig. 2a). With the increase of C-QD concentration from C0 to 3C0 (C0 = 1 mg mL−1), there is slight variation of PL intensity and PL peak position (Fig. 2b). However, with higher C-QD concentration, the emission peaks red-shift to ∼512 (4C0) nm and ∼520 nm (5C0), respectively, with a significant decrease of PL intensity (20% for 4C0 and 50% for 5C0). This phenomenon may be due to the reabsorption energy loss with high concentration.32,33 As shown in Fig. 2a, the emission peak positions do not depend on the excitation-wavelengths, indicating the close-bandgap emission nature in C-QDs prepared using phloroglucinol.30,31 Other than the typical surface-related excitation-dependent emission in C-dots,37 the as-prepared C-QDs exhibit excellent stability.30 There is no significant variation in optical properties regarding the QY and absorption/emission peak positions after 6 month storage a t = − 20 °C, indicating the very good colloidal and optical stability of C-dots.2.3 Fabrication of laminated LSCs
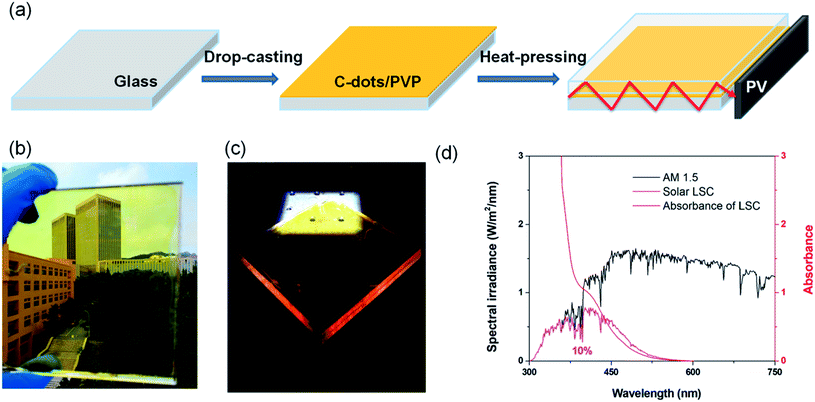
C-QDs with different concentrations in PVP/methanol solution were drop-cast on a glass substrate (10 × 10 × 0.9 cm3).26 After drying at room temperature, the C-dots/PVP glass was heated at 60 °C, and another glass slide was placed on top of the film with one kilogram weight on the top to fabricate the laminated LSC (detailed preparation information is included in the Experimental section) (Fig. 3a). Compared to single-layer LSCs or tandem LSCs, in laminated LSCs, the C-QD layer was sealed inside two glass slides, which can isolate the C-QDs and prevent their direct contact with dust, chemicals, moisture, oxygen etc. In addition, one can easily integrate LSC technology into existing window manufacturing processes.7 The as-prepared laminated LSC is semitransparent (Fig. 3b). The absorption spectrum of the solid-state laminated LSC is shown in Fig. 3d, which is consistent with its absorption spectrum in solution (Fig. 2a). The absorption of the thin-film LSC matches the Sun's spectrum in the UV and visible range, with 10% overlapping with the Sun's spectrum (Fig. 3d) (details are included in the Experimental section). Upon one sun illumination, a clear concentrated yellow-orange light can be seen from the edges of the LSC (Fig. 3c). There is no significant PL peak and width variation, considering the similar concentration of carbon QDs. The obtained QY of the carbon QDs in the PVP film is around 40%.2.4 Efficiency in laminated LSCs
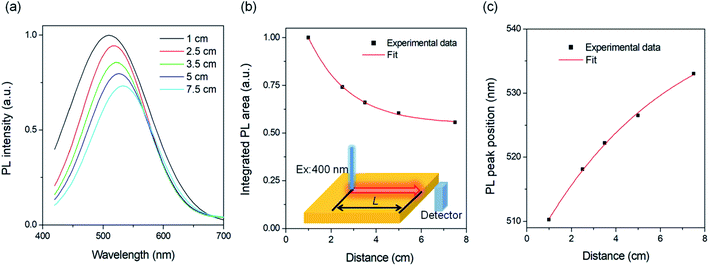
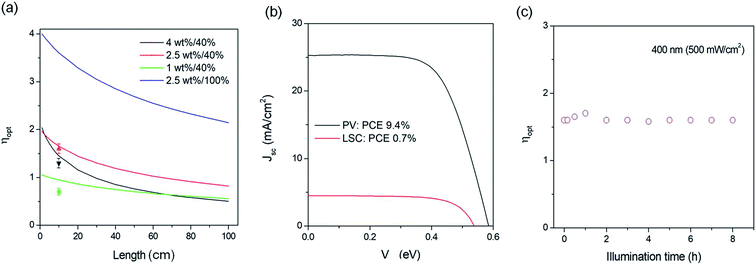
Following the method reported in the literature,26 we set up the distance-dependent PL measurement as shown in the inset of Fig. 4b. The PL spectra of C-QDs exhibit continuous red-shifts with the increase of the distance (L) between the excitation light spot and the edge of the LSC (Fig. 4a and c). Meanwhile the integrated PL area decreases with the increase of L. As the PL spectrum (PL shape, peak width and PL area) of the LSC is strongly sensitive to the reabsorption, these results indicate reabsorption energy loss in LSCs.37 The red-shift of the PL peak with the increase of C-QD concentration in solution or in films could be due to the reabsorption effect when the concentration of C-QDs is 5C0. The PL area decreasing rate follows well a typical exponential decay; with an L of 7.5 cm, the PL area retains 56% of its initial value (Fig. 4b), suggesting that we could improve the optical efficiency of the LSCs by adjusting the size of the LSC.To further clearly understand the L dependent optical efficiency in LSCs based on C-dots, we calculated the external optical efficiency (ηopt) of the LSCs based on a reported method (details included in the Experimental section).38 In the simulation, the QY of the LSCs is 40%, and the thickness is fixed as 1 mm (overall thickness of 9 mm for the LSC). As shown in Fig. 5a, the ηopt of LSCs using C-QDs with a concentration of 1 wt% drops slightly with the increase of the length of the LSC. When the L is 100 cm, ηopt retains 57% of its initial value. In contrast, the ηopt of LSCs with a C-QD concentration of 4 wt% drops exponentially with the increase of the length. When the L is 100 cm, ηopt retains 25% of its initial value, which is mainly due to the reabsorption. The LSC based on C-QDs with a concentration of 2.5 wt% can retain 43% of the initial ηopt (100 cm) with an ηopt of 0.83%. Assuming that the C-QDs (2.5 wt%) have a QY of 100%, the LSC exhibits an ηopt of 2%. These results are the straightforward evidence that the optical efficiency of the C-QD based LSCs can be largely improved by optimizing the concentration of the C-dots. It is worth mentioning that once the dimensions of the LSC based on C-QDs are large enough (>0.5 × 0.5 m2), the slight overlap between the absorption and emission spectra will lead to strong reabsorption energy loss. Thus the final optical efficiency is dominantly contributed by the emission spectrum without any overlap with the absorption spectrum of C-dots. In other words, we still can use C-QDs for fabricating highly efficient LSCs by optimizing the overlap range between the emission and absorption spectra and the QY.
We further prepared laminated LSCs with different C-QD concentrations (1–4 wt%) and measured the ηopt of the LSCs by coupling a power meter at the edge of the LSCs. ηopt can be calculated as:38
To show the real application of laminated LSCs based on C-dots, we measured the PCE and stability of the LSCs under the natural environment (Summer, Qingdao). The PCE of the LSC was measured by using a calibrated silicon PV (Zolix QE-B1). Under natural sunlight (Qingdao, China, June 24), the PV cell exhibits a JSC of 25 mA cm−2, a Voc of 0.58 mV, a fill factor of 0.64 and a PCE of 9.3% (Fig. 5b). As the standard PV cell has a PCE of 15%, the calculated natural light intensity is ∼62 mW cm−2. The LSC based on C-QDs (2.5 wt%, QY of 40%) with an active area of 1.6 cm2 exhibits a JSC of 4.5 mA cm−2, a Voc of 0.495 V, and a fill factor of 0.56 (Fig. 5b). Based on these data, the PCE of the LSC is 0.7% under natural light. The LSCs based on C-QDs exhibit excellent photostability. Upon 400 nm illumination (500 mW cm−2), there is no notable integrated PL area decrease after 8 h under the natural environment. Following the literature,22 as the absorption of the LSC at 400 ± 5 nm is around 0.5 mW cm−2, we calculated the acceleration factor to be 1000, which translates into 5.4 years of exposure to natural sunlight (average 50 mW cm−2 and 8 hours per day).
3. Conclusions and perspectives
In conclusion, we demonstrated efficient and stable laminated LSCs based on C-dots. The reabsorption energy loss in LSCs is strongly dependent on the concentration of C-dots. By optimizing the concentration of C-dots, the LSC exhibits a highest ηopt of 1.6% (100 mW cm−2) and a PCE of 0.7% under natural sunlight illumination (62 mW cm−2) with excellent photostability. The as-obtained PCE of the laminated LSC is 1.6 times higher than that of a single-layer LSC due to the decrease of the geometric factor. In view of the low-cost synthesis procedure using earth abundant precursors, excellent optical properties, and high stability under normal conditions, our findings indicate that the laminated structure has great application potential for fabricating highly efficient and stable LSCs compared to single layer and tandem structured LSCs. Future research direction may focus on the synthesis of C-QDs with emission in the near infrared region, a high QY and small overlap between the absorption and emission through structure design or surface modification.4. Experimental section
4.1 Synthesis of C-dots
C-QDs were prepared via a hydrothermal approach. Typically, phloroglucinol (0.5 g) was mixed with 10 mL of ethanol. After 10 min of sonication, the clear solution was transferred into a 25 mL Teflon-lined autoclave, followed by adding 2 mL of HCl (37%) as the catalyst. The mixture was heated at 200 °C for 9 h and naturally cooled down to room temperature (25 °C). The mixture was transferred into a 100 mL beaker and heated to 70 °C for 30 min. Then the mixture was transferred into dialysis bags with a molecular weight of 1000 Da for 12 hours. The C-dots/methanol solution inside the dialysis bag was collected for further characterization and use in fabricating LSCs.4.2 LSC fabrication
The fabrication of the LSC based on C-QDs was performed by following our previous report. In detail, different concentrations of C-QDs were dispersed in methanol/PVP solution (PVP K30 concentration: 200 mg mL−1). The mixture was sonicated until a clear solution (5 mL) was obtained. Then the mixture was drop-cast on the surface of a glass slide and dried at room temperature for 2 h until all the solvent evaporated. The glass dimensions are 10 × 10 × 0.4 cm3. Then another glass slide with the same dimensions was placed on top of the C-dots/PVP thin film. The laminated glass was heated to 60 °C with a two kilogram weight on the top for 12 hours. The bubbles between the top glass and the PVP/C-QD layers can strongly affect the optical efficiency of the LSCs, and thus in this work, the laminated LSC was placed in a vacuum for 12 h until all the bubbles between the glass slides were pumped away. The thickness of the C-dots/PVP film was measured to be ∼1 mm.4.3 Simulation
The external optical efficiency of the LSCs is expressed as following based on the reported literature:38| ηopt = ηAbs × ηinternal | (1) |
η Abs can be calculated as:38
 | (2) |
In which α is the absorption coefficient [calculated as  , where d is the effective length (1 mm C-dots/PVP thin film) and A is the absorption of the LSC measured from the absorption spectra], and Iin is the sun irradiance.
A spectrally averaged internal efficiency (ηinternal) over the PL emission of the QDs was calculated as:38,39
 | (3) |
 | (4) |
4.4 Characterization
TEM characterization of the C-QDs was carried out using a JEOL 2100F TEM equipped with an EDS spectrometer and SAED. Absorption spectra were acquired with a UV-2600 UV-Vis spectrophotometer (Shimadzu) with a scan speed of 600 nm per minute. Steady state PL characterization of the C-QDs and the LSCs was performed on an Edinburgh FLS980 instrument. In the liquid sample, the front-emission was collected, and in the LSC, the edge-emission was measured. The QYs of the C-QDs were measured using Rhodamine 6G as the reference. The refractive index of glass and PVP/C-QD film was measured using a WAY-2S Albert refractometer (INEA). TGA was carried out in a flow of nitrogen at 10 °C min−1 using a TG209F3 TGA (Netzsch).The external optical efficiency of the LSCs was measured under natural light (62 mW cm−2, which was directly measured by using a commercial calibrated Zolix QE-B1 solar cell). The power meter (Newport Model 843-R) was directly coupled on one edge of the LSC for optical efficiency measurement. The calibrated PV cell (Zolix QE-B1) was used to measure the PCE of the LSC. The PV cell was coupled directly on one edge of the LSC (active area: 0.9 cm × 2 cm). Due to the structure of the power meter or calibrated solar cell, the air gap between the LSC and measured devices is around 1 mm. In the optical efficiency or PCE calculation, we consider all edges were coupled with solar cells. The stability of LSCs (external optical efficiency vs. illumination time) based on C-QDs was measured using a power meter upon illumination (400 nm light emitting device, 500 mW cm−2) under ambient conditions at 25 °C with a humidity of 40%.
Conflicts of interest
The authors declare no conflict of interest.Acknowledgements
H. Zhao acknowledges the start funding support from Qingdao University and the funding from the Natural Science Foundation of Shandong Province (ZR2018MB001).Notes and references
- M. G. Debije and P. P. C. Verbunt, Adv. Energy Mater., 2012, 2, 12–35 CrossRef CAS.
- Y. Zhou, H. Zhao, D. Ma and F. Rosei, Chem. Soc. Rev., 2018, 47, 5866–5890 RSC.
- R. Mazzaro and A. Vomiero, Adv. Energy Mater., 2018, 8, 1801903 CrossRef.
- Y. You, X. Tong, W. Wang, J. Sun, P. Yu, H. Ji, X. Niu and Z. M. Wang, Adv. Sci., 2019, 6, 1801967 CrossRef PubMed.
- F. Meinardi, F. Bruni and S. Brovelli, Nat. Rev. Mater., 2017, 2, 17085 CrossRef.
- K. Wu, H. Li and V. I. Klimov, Nat. Photonics, 2018, 12, 105–110 CrossRef CAS.
- M. R. Bergren, N. S. Makarov, K. Ramasamy, A. Jackson, R. Gughelmetti and H. McDaniel, ACS Energy Lett., 2018, 3, 520–525 CrossRef CAS.
- C. S. Erickson, L. R. Bradshaw, S. McDowall, J. D. Gilbertson, D. R. Gamelin and D. L. Patrick, ACS Nano, 2014, 8, 3461–3467 CrossRef CAS PubMed.
- F. Meinardi, A. Colombo, K. A. Velizhanin, R. Simonutti, M. Lorenzon, L. Beverina, R. Viswanatha, V. I. Klimov and S. Brovelli, Nat. Photonics, 2014, 8, 392–399 CrossRef CAS.
- H. Zhao, D. Benetti, X. Tong, H. Zhang, Y. Zhou, G. Liu, D. Ma, S. Sun, Z. M. Wang, Y. Wang and F. Rosei, Nano Energy, 2018, 50, 756–765 CrossRef CAS.
- Y. Zhou, D. Benetti, Z. Fan, H. Zhao, D. Ma, A. O. Govorov, A. Vomiero and F. Rosei, Adv. Energy Mater., 2016, 6, 1501913 CrossRef.
- G. J. Liu, F. Diao, Z. Ling, H. Zhao and Y. Wang, J. Mater. Chem. C, 2018, 6, 10059–10066 RSC.
- G. D. Gutierrez, I. Coropceanu, M. G. Bawendi and T. M. Swager, Adv. Mater., 2016, 28, 497–501 CrossRef CAS PubMed.
- F. Meinardi, S. Ehrenberg, L. Dhamo, F. Carulli, M. Mauri, F. Bruni, R. Simonutti, U. Kortshagen and S. Brovelli, Nat. Photonics, 2017, 11, 177–185 CrossRef CAS.
- F. Meinardi, H. McDaniel, F. Carulli, A. Colombo, K. A. Velizhanin, N. S. Makarov, R. Simonutti, V. I. Klimov and S. Brovelli, Nat. Nanotechnol., 2015, 10, 878–885 CrossRef CAS PubMed.
- S. Sadeghi, H. B. Jalali, R. Melikov, B. G. Kumar, M. M. Aria, C. W. Ow-Yang and S. Nizamoglu, ACS Appl. Mater. Interfaces, 2018, 10, 12975–12982 CrossRef CAS PubMed.
- L. H. Slooff, E. E. Bende, A. R. Burgers, T. Budel, M. Pravettoni, R. P. Kenny, E. D. Dunlop and A. Buchtemann, Phys. Status Solidi RRL, 2008, 2, 257–259 CrossRef CAS.
- M. J. Talite, H.-Y. Huang, Y.-H. Wu, P. G. Sena, K.-B. Cai, T.-N. Lin, J.-L. Shen, W.-C. Chou and C.-T. Yuan, ACS Appl. Mater. Interfaces, 2018, 10, 34184–34192 CrossRef CAS PubMed.
- S.-J. Ha, J.-H. Kang, D. H. Choi, S. K. Nam, E. Reichmanis and J. H. Moon, ACS Photonics, 2018, 5, 3621–3627 CrossRef CAS.
- P. Singh, P. K. Shahi, S. K. Singh, A. K. Singh, M. K. Singh, R. Prakash and S. B. Rai, Nanoscale, 2017, 9, 696–705 RSC.
- S. K. E. Hill, R. Connell, C. Peterson, J. Hollinger, M. A. Hillmyer, U. Kortshagen and V. E. Ferry, ACS Photonics, 2019, 6, 170–180 CrossRef CAS.
- H. B. Li, K. F. Wu, J. Lim, H. J. Song and V. I. Klimov, Nat. Energy, 2016, 1, 16157 CrossRef CAS.
- X. Luo, T. Ding, X. Liu, Y. Liu and K. Wu, Nano Lett., 2019, 19, 338–341 CrossRef CAS PubMed.
- S. Sadeghi, R. Melikov, H. B. Jalali, O. Karatum, S. B. Srivastava, D. Conkar, E. N. Firat-Karalar and S. Nizamoglu, ACS Appl. Mater. Interfaces, 2019, 11, 8710–8716 CrossRef CAS PubMed.
- H. Zhao, Z. Wang, K. Fu, X. Hu and Y. H. Zhang, Adv. Funct. Mater., 2019, 1902262 CrossRef.
- G. Liu, R. Mazzaro, Y. Wang, H. Zhao and A. Vomiero, Nano Energy, 2019, 60, 119–126 CrossRef CAS.
- K. Jiang, S. Sun, L. Zhang, Y. Lu, A. Wu, C. Cai and H. Lin, Angew. Chem., 2015, 54, 5360–5363 CrossRef CAS PubMed.
- S. Kalytchuk, K. Polakova, Y. Wang, J. P. Froning, K. Cepe, A. L. Rogach and R. Zboril, ACS Nano, 2017, 11, 1432–1442 CrossRef CAS PubMed.
- Z. Wang, F. Yuan, X. Li, Y. Li, H. Zhong, L. Fan and S. Yang, Adv. Mater., 2017, 29, 1702910 CrossRef PubMed.
- F. Yuan, T. Yuan, L. Sui, Z. Wang, Z. Xi, Y. Li, X. Li, L. Fan, Z. a. Tan, A. Chen, M. Jin and S. Yang, Nat. Commun., 2018, 9, 2249 CrossRef PubMed.
- F. Yuan, Z. Xi, X. Shi, Y. Li, X. Li, Z. Wang, L. Fan and S. Yang, Adv. Opt. Mater., 2019, 7, 1801202 CrossRef.
- X. Gong, W. Ma, Y. Li, L. Zhong, W. Li and X. Zhao, Org. Electron., 2018, 63, 237–243 CrossRef CAS.
- Y. Li, P. Miao, W. Zhou, X. Gong and X. Zhao, J. Mater. Chem. A, 2017, 5, 21452–21459 RSC.
- Z. Wang, X. Zhao, Z. Guo, P. Miao and X. Gong, Org. Electron., 2018, 62, 284–289 CrossRef CAS.
- Y. Zhou, D. Benetti, X. Tong, L. Jin, Z. M. Wang, D. Ma, H. Zhao and F. Rosei, Nano Energy, 2018, 44, 378–387 CrossRef CAS.
- W. Ma, W. Li, R. Liu, M. Cao, X. Zhao and X. Gong, Chem. Commun., 2019, 55, 7486–7489 RSC.
- H. Zhao, J. Lumin., 2019, 211, 150–156 CrossRef CAS.
- V. I. Klimov, T. A. Baker, J. Lim, K. A. Velizhanin and H. McDaniel, ACS Photonics, 2016, 3, 1138–1148 CrossRef CAS.
- D. Alonso-Álvarez, D. Ross, E. Klampaftis, K. R. McIntosh, S. Jia, P. Storiz, T. Stolz and B. S. Richards, Prog. Photovolt. Res. Appl., 2015, 23, 479–497 CrossRef.
| This journal is © The Royal Society of Chemistry 2019 |

