 Open Access Article
Creative Commons Attribution 3.0 Unported Licence
Enabling the electrocatalytic fixation of N2 to NH3 by C-doped TiO2 nanoparticles under ambient conditions†
Kun
Jia
ab,
Yuan
Wang
ab,
Qi
Pan
ab,
Benhe
Zhong
a,
Yonglan
Luo
b,
Guanwei
Cui
c,
Xiaodong
Guo
*a and
Xuping
Sun
 *b
*b
aSchool of Chemical Engineering, Sichuan University, Chengdu 610065, China. E-mail: xiaodong2009@scu.edu.cn
bInstitute of Fundamental and Frontier Sciences, University of Electronic Science and Technology of China, Chengdu 610054, China. E-mail: xpsun@uestc.edu.cn
cCollege of Chemistry, Chemical Engineering and Materials Science, Shandong Normal University, Jinan 250014, Shandong, China
First published on 21st November 2018
Abstract
The conventional Haber–Bosch process for industrial NH3 production from N2 and H2 is highly energy-intensive with a large amount of CO2 emissions and finding a more suitable method for NH3 synthesis under mild conditions is a very attractive topic. The electrocatalytic N2 reduction reaction (NRR) offers us an environmentally benign and sustainable route. In this communication, we report that C-doped TiO2 nanoparticles act as an efficient electrocatalyst for the NRR with excellent selectivity. In 0.1 M Na2SO4, it achieves an NH3 yield of 16.22 μg h−1 mgcat.−1 and a faradaic efficiency of 1.84% at −0.7 V vs. the reversible hydrogen electrode. Furthermore, this catalyst also shows good stability during electrolysis and recycling tests.
NH3 is an essential ingredient in the manufacture of fertilizers, medicaments, resins, dyes, explosives, etc.1–4 In 2017, total worldwide NH3 production exceeded 150 million tons, and the demand for NH3 continues to grow.5 Industrially, NH3 is produced almost via the Haber–Bosch process.6 In order to overcome the kinetic limitations of strong N
![[triple bond, length as m-dash]](https://www.rsc.org/images/entities/char_e002.gif) N triple bonds, elevated temperature (350–550 °C) and high pressure (150–350 atm) are necessary throughout the whole process.7–9 Moreover, it not only consumes a large amount of energy, but inevitably leads to significant CO2 emission. So, it is imperative to develop an environmentally friendly process for the sustainable conversion of N2 to NH3.
N triple bonds, elevated temperature (350–550 °C) and high pressure (150–350 atm) are necessary throughout the whole process.7–9 Moreover, it not only consumes a large amount of energy, but inevitably leads to significant CO2 emission. So, it is imperative to develop an environmentally friendly process for the sustainable conversion of N2 to NH3.
Electrochemical NH3 synthesis from N2 and H2O is a promising candidate for artificial N2 fixation under ambient conditions due to its environment-friendly, convenient and low-cost characteristics.10–15 Although electrochemical reduction is feasible for achieving the conversion of N2 to NH3, it requires electrocatalysts for the N2 reduction reaction (NRR) to meet the challenge associated with N2 activation. Noble-metal catalysts such as Ru,16 Au,17,18 Ag,19 and Rh20 were reported as NRR catalysts with attractive catalytic performances, but the scarcity of these catalysts limits their wide application. Recently, transition metal oxides (TMOs)21–26 have attracted much attention as NRR electrocatalysts, as they are inexpensive and can be easily prepared on a large scale. Therefore, it is still highly desirable to develop TMOs for the NRR. TiO2 is nontoxic with a high thermal stability,27 but its low electronic conductivity hinders its electrocatalytic application.28 It has been reported that carbon doping can enhance the electronic conductivity of TiO2 and facilitate charge transfer from the bulk to the surface region,29 offering us a possible catalyst for the NRR, which, however, has not been explored before.
Herein, we report that C-doped TiO2 nanoparticles (C-TiO2) are effective for electrochemical N2 conversion to NH3 with excellent selectivity under ambient conditions. In 0.1 M Na2SO4, the catalyst achieves an NH3 yield of 16.22 μg h−1 mgcat.−1 and a faradaic efficiency (FE) of 1.84% at −0.7 V vs. the reversible hydrogen electrode (RHE). Remarkably, it also demonstrates a high electrochemical stability. Compared with pristine TiO2 (NH3 yield: 8.49 μg h−1 mgcat.−1; FE: 1.28%), C-TiO2 has a superior NRR performance. This result suggests that the introduction of carbon can enhance the electrocatalytic activity of TiO2.
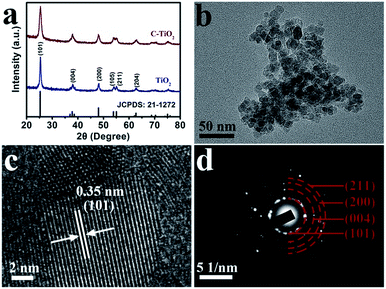
C-TiO2 nanoparticles were prepared by a facile calcination assisted solvothermal method (see the ESI† for preparation details). Fig. 1a presents the X-ray diffraction (XRD) patterns of C-TiO2 and TiO2. The diffraction peaks at 25.3°, 37.8°, 48.0°, 53.9°, 55.1°, and 62.7° can be indexed to the (101), (004), (200), (105), (211), and (204) planes of anatase TiO2 (JCPDS no. 21-1272), respectively, which is similar to the pattern of C-TiO2. Thermal gravimetric analysis (Fig. S1†) demonstrated that the content of C was 2.97 wt%. Scanning electron microscopy (SEM) images (Fig. S2†) indicate that the crystallite size of C-TiO2 is smaller than that of TiO2. Fig. 1b shows a transmission electron microscopy (TEM) image which evidences the nanoparticle nature of C-TiO2. A high-resolution TEM (HRTEM) image (Fig. 1c) reveals a well-resolved lattice fringe with an interplanar distance of 0.35 nm, indexed to the (101) plane of C-TiO2. The selected area electron diffraction (SAED) pattern of C-TiO2 (Fig. 1d) exhibited four diffraction rings indexed to the (101), (004), (200) and (211) planes of the TiO2 phase.
 | ||
| Fig. 1 (a) XRD patterns for C-TiO2 and TiO2. (b) TEM and (c) HRTEM images for the C-TiO2 nanoparticles. (d) SAED pattern for C-TiO2. | ||
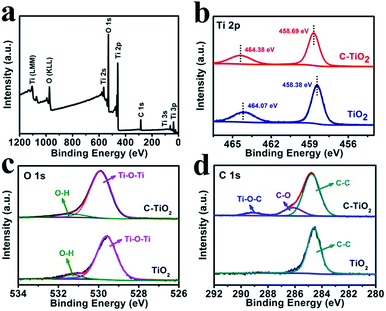
Fig. 2a shows the X-ray photoelectron spectroscopy (XPS) survey spectrum of C-TiO2, which confirms the presence of Ti, C, and O elements. Fig. 2b presents the Ti 2p spectra for the C-TiO2 and TiO2 samples. The binding energies (BEs) of Ti 2p3/2 and Ti 2p1/2 for TiO2 are 458.38 and 464.07 eV, respectively.30 Compared to the TiO2 sample, the Ti 2p peaks of C-TiO2 show a positive shift of 0.3 eV, which could be attributed to lattice distortions.31Fig. 2c reveals the O 1s spectra for C-TiO2 which are in good agreement with those of pure TiO2. The BEs at 529.92 and 531.33 eV in the O 1s region are ascribed to the Ti–O–Ti (lattice oxygen) and O–H bonds in C–TiO2.32,33 For the C 1s XPS spectra (Fig. 2d), three peaks can be deconvoluted at around 284.76, 286.15, and 289.12 eV for C-TiO2. The peak at 284.76 eV could be attributed to the surface adventitious carbon.30 The two peaks at 286.15 and 289.12 eV are characteristic of the oxygen bound species C–O and Ti–O–C, respectively.34 This result indicates that carbon atoms substitute for some of the lattice titanium atoms and form a Ti–O–C structure.30 Compared with C-TiO2, only one C 1s XPS spectrum corresponding to C–C is observed for the TiO2 sample, further confirming the existence of C in C-TiO2. In addition, the ultraviolet-visible (UV-vis) absorption spectra and the corresponding Kubelka–Munk plots of C-TiO2 and TiO2 are displayed in Fig. S3.† The band gap energies of C-TiO2 (2.79 eV) and TiO2 (2.96 eV) were determined by the intercept of the plots of (αhν)1/2versus photon energy (hν),35 indicating a narrower band gap after C doping. The enhancement of visible light absorption for C-TiO2 and TiO2 should be attributed to the carbon doping in the TiO2 lattice, which would introduce a series of localized occupied states into the band gap of the TiO2 lattice, leading to a strong visible light absorption.36 All of the above results strongly support the successful preparation of C-TiO2 nanoparticles.
 | ||
| Fig. 2 (a) XPS survey spectrum for C-TiO2. XPS spectra of C-TiO2 and TiO2 in the (b) Ti 2p, (c) O 1s and (d) C 1s regions. | ||
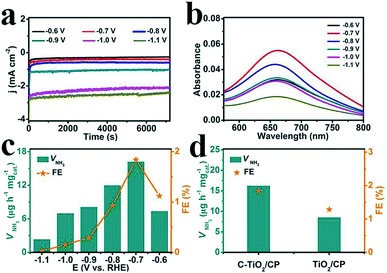
The electrocatalytic NRR performance of C-TiO2 was tested using a typical two-compartment and three-electrode device as the reaction vessel. C-TiO2 was deposited on carbon paper (C-TiO2/CP with a C-TiO2 loading of 0.10 mg) for the test. All of the potentials for the NRR were reported on the RHE scale. The produced NH3 was detected by spectrophotometry with salicylic acid.37 The relevant calibration curves are shown in Fig. S4.† The chronoamperometry curves at the corresponding potentials in N2-saturated 0.1 M Na2SO4 are displayed in Fig. 3a, which can directly express the relationship between current density and time during the whole test process. Fig. 3b presents the UV-vis absorption spectra of the electrolyte stained with indophenol indicator after 2 h electrolysis at a series of potentials, and the values of absorbance at 660 nm were used to calculate the concentrations of the generated NH3 at different applied potentials according to the calibration curve of NH3. Combined with the collected data, the final results including the NH3 yields and FEs under various potentials were calculated and are plotted in Fig. 3c. Both the NH3 yields and FEs increase as the negative potential rises to −0.7 V, which is the optimum potential point when the NH3 yield and FE are 16.22 μg h−1 mgcat.−1 and 1.84%, respectively. After that, as the potential continually increases, both the NH3 yields and FEs decrease significantly which is mainly caused by the competitive hydrogen evolution reaction. For comparison, the pure TiO2 sample was tested under the same conditions and the corresponding results are presented in Fig. 3d. It is worth noting that the performance of C-TiO2 is evidently better than that of pure TiO2. The superior NRR performance of C-TiO2 can be rationally attributed to the C-TiO2 nanoparticles having more exposed active sites (Fig. S5†), enabling more effective utilization of them as electrocatalysts. The enhanced conductivity of C-TiO2 also contributes to its higher catalytic activity. The charge transfer resistance related to the electrocatalytic kinetics can be determined from the diameter of the semicircles in the low frequency zone.38 Electrochemical impedance spectroscopy data (Fig. S6†) show that C-TiO2/CP possesses a smaller radius of the semicircle compared to TiO2/CP, suggesting that the C-TiO2 sample has a lower charge transfer resistance39 and thus faster NRR kinetics. Meanwhile, C-TiO2 shows a higher performance than some of the previously reported NRR electrocatalysts.40–44 More detailed comparisons are listed in Table S1.†
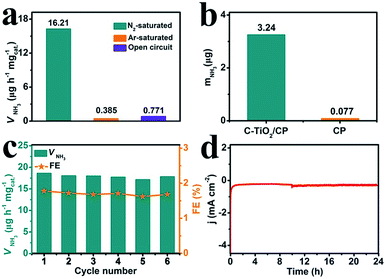
To prove that NH3 was generated via the N2 reduction process of C-TiO2, three sets of control experiments were carried out: (1) immersing the samples in Ar-saturated solution at −0.7 V for 2 h; (2) immersing the samples in N2-saturated solution at an open circuit potential for 2 h; and (3) immersing the samples at −0.7 V with alternating 2 h cycles between N2-saturated and Ar-saturated solutions, for a total of 12 h. As shown in Fig. 4a and Fig. S7,† a trace amount of NH3 production was detected under Ar-saturated solution and an open circuit potential. Combined with Fig. S8,† this result indicates that only N2 provides the nitrogen source to NH3. Moreover, controlled trials were carried out to investigate the performance of bare CP. The relevant UV-vis absorption spectra are displayed in Fig. S9.† The results show the poor electrocatalytic activity of bare CP, indicating that C-TiO2 is an active material for the NRR (Fig. 4b). In addition, stable performance is another important indicator for evaluating catalysts. Recycling tests were performed in N2-saturated 0.1 M Na2SO4 6 times and the results are shown in Fig. 4c. The NH3 yield and FE results show no obvious fluctuation over the whole process, suggesting that C-TiO2 possesses a stable NRR performance. Moreover, only a slight fluctuation of current density is observed at −0.7 V after 24 h electrolysis, further suggesting an excellent electrochemical stability.
Hydrazine (N2H4), as a possible by-product in the NRR test, was detected by the method of Watt and Chrisp.45 The relevant calibration curves are displayed in Fig. S10.† The UV-vis absorption spectra of N2H4 after 2 h electrolysis in a N2 atmosphere at a series of potentials are shown in Fig. S11.† The concentrations of the possible by-product N2H4 are determined according to the values of absorbance at 455 nm. The results demonstrated that no N2H4 was detected at all potentials, implying the excellent selectivity of C-TiO2 as an NRR electrocatalyst.
In summary, C-TiO2 nanoparticles have been proven as an effective non-noble-metal electrocatalyst for the NRR at moderate temperatures and atmospheric pressure. This electrocatalyst achieves an NH3 yield of 16.22 μg h−1 mgcat.−1 and a FE of 1.84% at −0.7 V vs. RHE in 0.1 M Na2SO4. It also exhibits excellent selectivity and satisfactory electrochemical stability during the process of electrochemical NH3 synthesis under ambient conditions. This work not only offers us an attractive earth-abundant electrocatalyst for the NRR, but also opens up an exciting new avenue for the design and development of doped Ti-based catalysts46,47 with enhanced performances toward electrocatalytic N2 and nitrite48 reduction for applications.
Conflicts of interest
There are no conflicts to declare.Acknowledgements
The authors would like to thank the National Natural Science Foundation of China (No. 21506133) and the Youth Foundation of Sichuan University (No. 2017SCU04a08) for their support in this research.References
- R. Schlögl, Angew. Chem., Int. Ed., 2003, 42, 2004–2008 CrossRef.
- T. Murakami, T. Nishikiori, T. Nohira and Y. Ito, J. Am. Chem. Soc., 2003, 125, 334–335 CrossRef CAS PubMed.
- V. Rosca, M. Duca, M. T. de Groot and M. T. Koper, Chem. Rev., 2009, 109, 2209–2244 CrossRef CAS PubMed.
- C. Guo, J. Ran, A. Vasileff and S. Qiao, Energy Environ. Sci., 2018, 11, 45–56 RSC.
- J. A. Ober, Mineral Commodity Summaries 2018, ed. S. M. Kimball, U.S. Geological Survey, U.S. Government Printing Office, Washington, DC, 2018, DOI:10.3133/70194932.
- V. Smil, Nature, 1999, 400, 415 CrossRef CAS.
- G. Ertl, Catalytic ammonia synthesis, ed. J. R. Jennings, Plenum, New York, 1991 Search PubMed.
- C. J. M. van der Ham, M. T. M. Koper and D. G. H. Hetterscheid, Chem. Soc. Rev., 2014, 43, 5183–5191 RSC.
- G. Chen, X. Cao, S. Wu, X. Zeng, L. Ding, M. Zhu and H. Wang, J. Am. Chem. Soc., 2017, 139, 9771–9774 CrossRef CAS PubMed.
- L. Zhang, X. Ji, X. Ren, Y. Ma, X. Shi, Z. Tian, A. M. Asiri, L. Chen, B. Tang and X. Sun, Adv. Mater., 2018, 30, 1800191 CrossRef PubMed.
- X. Ren, G. Cui, L. Chen, F. Xie, Q. Wei, Z. Tian and X. Sun, Chem. Commun., 2018, 54, 8474–8477 RSC.
- L. Zhang, X. Ji, X. Ren, Y. Luo, X. Shi, A. M. Asiri, B. Zheng and X. Sun, ACS Sustainable Chem. Eng., 2018, 6, 9550–9554 CrossRef CAS.
- X. Li, T. Li, Y. Ma, Q. Wei, W. Qiu, H. Guo, X. Shi, P. Zhang, A. M. Asiri, L. Chen, B. Tang and X. Sun, Adv. Energy Mater., 2018, 8, 1801357 CrossRef.
- W. Qiu, X. Xie, J. Qiu, W. Fang, R. Liang, X. Ren, X. Ji, G. Cui, A. M. Asiri, G. Cui, B. Tang and X. Sun, Nat. Commun., 2018, 9, 3485 CrossRef.
- R. Zhang, Y. Zhang, X. Ren, G. Cui, A. M. Asiri, B. Zheng and X. Sun, ACS Sustainable Chem. Eng., 2018, 6, 9545–9549 CrossRef CAS.
- V. Kordali, G. Kyriacou and C. Lambrou, Chem. Commun., 2000, 17, 1673–1674 RSC.
- M. Shi, D. Bao, B. Wulan, Y. Li, Y. Zhang, J. Yan and Q. Jiang, Adv. Mater., 2017, 29, 1606550 CrossRef.
- D. Bao, Q. Zhang, F. Meng, H. Zhong, M. Shi, Y. Zhang, J. Yan, Q. Jiang and X. Zhang, Adv. Mater., 2017, 29, 1604799 CrossRef.
- H. Huang, L. Xia, X. Shi, A. M. Asiri and X. Sun, Chem. Commun., 2018, 54, 11427–11430 RSC.
- H. Liu, S. Han, Y. Zhao, Y. Zhu, X. Tian, J. Zeng, J. Jiang, B. Xia and Y. Chen, J. Mater. Chem. A, 2018, 6, 3211–3217 RSC.
- C. Lv, C. Yan, G. Chen, Y. Ding, J. Sun, Y. Zhou and G. Yu, Angew. Chem., Int. Ed., 2018, 57, 6073–6076 CrossRef CAS.
- L. Zhang, X. Ren, Y. Luo, X. Shi, A. M. Asiri, T. Li and X. Sun, Chem. Commun., 2018, 54, 12966–12969 RSC.
- S. Chen, S. Perathoner, C. Ampelli, C. Mebrahtu, D. Su and G. Centi, Angew. Chem., Int. Ed., 2017, 56, 2699–2703 CrossRef CAS PubMed.
- Q. Liu, X. Zhang, B. Zhang, Y. Luo, G. Cui, F. Xie and X. Sun, Nanoscale, 2018, 10, 14386–14389 RSC.
- J. Han, X. Ji, X. Ren, G. Cui, L. Li, F. Xie, H. Wang, B. Li and X. Sun, J. Mater. Chem. A, 2018, 6, 12974–12977 RSC.
- Z. Wang, F. Gong, L. Zhang, R. Wang, L. Ji, Q. Liu, Y. Luo, H. Guo, Y. Li, P. Gao, X. Shi, B. Li, B. Tang and X. Sun, Adv. Sci., 2018, 5, 1801182 CrossRef.
- J. Du, X. Lai, N. Yang, J. Zhai, D. Kisailus, F. Su, D. Wang and L. Jiang, ACS Nano, 2011, 5, 590–596 CrossRef CAS PubMed.
- W. Li, Y. Bai, F. Li, C. Liu, K. Chan, X. Feng and X. Lu, J. Mater. Chem., 2012, 22, 4025–4031 RSC.
- J. Shao, W. Sheng, M. Wang, S. Li, J. Chen, Y. Zhang and S. Cao, Appl. Catal., B, 2017, 209, 311–319 CrossRef CAS.
- W. Ren, Z. Ai, F. Jia, L. Zhang, X. Fan and Z. Zou, Appl. Catal., B, 2007, 69, 138–144 CrossRef CAS.
- E. M. Neville, M. J. Mattle, D. Loughrey, B. Rajesh, M. Rahman, J. M. D. MacElroy, J. A. Sullivan and K. R. Thampi, J. Phys. Chem. C, 2012, 116, 16511–16521 CrossRef CAS.
- B. Li, Z. Zhao, F. Gao, X. Wang and J. Qiu, Appl. Catal., B, 2014, 147, 958–964 CrossRef CAS.
- C. Yang, X. Zhang, J. Qin, X. Shen, R. Yu, M. Ma and R. Liu, J. Catal., 2017, 347, 36–44 CrossRef CAS.
- Y. Zhang, Z. Zhao, J. Chen, L. Cheng, J. Chang, W. Sheng, C. Hu and S. Cao, Appl. Catal., B, 2015, 165, 715–722 CrossRef CAS.
- C. Chen, M. Long, H. Zeng, W. Cai, B. Zhou, J. Zhang, Y. Wu, D. Ding and D. Wu, J. Mol. Catal. A: Chem., 2009, 314, 35–41 CrossRef CAS.
- C. D. Valentin, G. Pacchioni and A. Selloni, Chem. Mater., 2005, 17, 6656–6665 CrossRef.
- D. Zhu, L. Zhang, R. E. Ruther and R. J. Hamers, Nat. Mater., 2013, 12, 836–841 CrossRef CAS PubMed.
- Y. Zhu, Y. Liu, T. Ren and Z. Yuan, Adv. Funct. Mater., 2015, 25, 7337–7347 CrossRef CAS.
- C. Guo, L. Zhang, J. Miao, J. Zhang and C. Li, Adv. Energy Mater., 2013, 3, 167–171 CrossRef CAS.
- Y. Liu, Y. Su, X. Quan, X. Fan, S. Chen, H. Yu, H. Zhao, Y. Zhang and J. Zhao, ACS Catal., 2018, 8, 1186–1191 CrossRef CAS.
- D. Yang, T. Chen and Z. Wang, J. Mater. Chem. A, 2017, 5, 18967–18971 RSC.
- J. Kong, A. Lim, C. Yoon, J. H. Jang, H. C. Ham, J. Han, S. Nam, D. Kim, Y. Sung, J. Choi and H. S. Park, ACS Sustainable Chem. Eng., 2017, 5, 10986–10995 CrossRef CAS.
- M. Shi, D. Bao, S. Li, B. Wulan, J. Yan and Q. Jiang, Adv. Energy Mater., 2018, 8, 1800124 CrossRef.
- X. Xiang, Z. Wang, X. Shi, M. Fan and X. Sun, ChemCatChem, 2018, 10, 1–7 CrossRef.
- G. W. Watt and J. D. Chrisp, Anal. Chem., 1952, 24, 2006–2008 CrossRef CAS.
- R. Zhang, X. Ren, X. Shi, F. Xie, B. Zheng, X. Guo and X. Sun, ACS Appl. Mater. Interfaces, 2018, 10, 28251–28255 CrossRef CAS PubMed.
- X. Zhang, Q. Liu, X. Shi, A. M. Asiri, Y. Luo, X. Sun and T. Li, J. Mater. Chem. A, 2018, 6, 17303–17306 RSC.
- R. Wang, Z. Wang, X. Xiang, R. Zhang, X. Shi and X. Sun, Chem. Commun., 2018, 54, 10340–10342 RSC.
Footnote |
| † Electronic supplementary information (ESI) available: Experimental section and supplementary figures. See DOI: 10.1039/c8na00300a |
| This journal is © The Royal Society of Chemistry 2019 |


