 Open Access Article
Electrospun superhydrophilic membranes for effective removal of Pb(II) from water†
Linlin
Zang
a,
Ru
Lin
a,
Tianwei
Dou
b,
Lu wang
a,
Jun
Ma
 *a and
Liguo
Sun
 *b
*b
aState Key Laboratory of Urban Water Resource and Environment, School of Environment, Harbin Institute of Technology, Harbin 150090, PR China. E-mail: majunhit@126.com
bKey Laboratory of Chemical Engineering Process & Technology for High-efficiency Conversion, College of Heilongjiang Province, School of Chemical Engineering and Materials, Heilongjiang University, Harbin, 150080, PR China. E-mail: sunliguo1975@163.com
First published on 26th September 2018
Abstract
Nanofibrous membranes have a high specific surface area and large porosity, which are beneficial for being used as adsorbents to remove heavy metal ions from water. In this work, electrospun nanofibers were wrapped with a hydrogel layer with a tunable thickness, which endowed the membrane with excellent superhydrophilic performance. Because of good water-retention properties and abundant functional groups originating from the hydrogel layer, as a static adsorbent, the maximum adsorption capacity of Pb(II) was up to 146.21 mg g−1 according to the Langmuir model. Meanwhile, the electrospun membrane also possessed water permeability as a flow-through membrane for dynamic adsorption, which was obviously different from traditional hydrogel adsorbents. As a result, the rejection ratio of Pb(II) can remain over 55% after running for 72 h under high pH conditions and at low initial ion concentrations. Apart from these, cycle operations confirmed the regeneration of the membrane, and competitive adsorption experiments illustrated the selective removal of Pb(II) in a mixed ion solution.
Introduction
In recent years, fast industrialization and blooming growth have been substantially contributing to environmental pollution. Notably, heavy metal ions are considered as the major inorganic contaminants because of their mobility in the aqueous ecosystem, extreme toxicity and non-biodegradable nature.1–4 Moreover, due to their bioaccumulation in biological tissues via the food chain, heavy metal ions are also harmful to our health. For example, the lead ion (Pb(II)) can damage the nervous system, digestive system, immunological system, kidneys and so on.5–7 At present, various physical and chemical methods (electro-dialysis, chemical precipitation, etc.) have been used to solve this problem. However, these conventional technologies have several drawbacks, such as large investment, high energy consumption, complex post-treatment and secondary pollution.8,9 Therefore, some efficient methods and materials are needed to remove Pb(II) from the aquatic ecosystem.Electrospinning is a simple and promising technique for generating nanofibrous membranes with fiber diameters in the range of nanometers to a few microns, and matrix materials of the membranes come from a variety of polymers.10–12 Because of their controllable thicknesses, high porosity and large surface area, electrospun nanofibrous membranes (ENMs) have many applications in the environment, catalysis, energy, medicine and so on.13–22 Due to its large pore size and high flux, the ENM is often used as a pretreatment which mainly involves a sieving mechanism. However, through modifying the functional polymer or doping nanoparticles,23–29 it can also achieve the adsorptive separation of bivalent or multivalent ions whose sizes are much smaller than the pore sizes of the membrane. Therefore, the ENM has gradually become an ideal adsorptive material for removing toxic metal ions in aqueous solution. For example, due to its high specific surface area and abundant adsorption active sites, the maximum adsorption capacity of a thiol-modified cellulose nanofibrous composite membrane for Pb(II) was found to be 137.7 mg g−1 which was higher than those of organic/inorganic nanocomposites such as 64.5 mg g−1 for Fe3O4/cyclodextrin polymer nanocomposites and 91.8 mg g−1 for magnetic attapulgite/fly ash/poly(acrylic acid) nanocomposites.30–32 However, the ENM had slower adsorption kinetics and lower adsorption capacities, compared with hydrogel adsorbents which possessed a three-dimensional polymer network, abundant hydrophilic functional groups and good water retention properties.33–35 For instance, poly(acrylic acid) (PAA) is a kind of abundant carboxyl-containing polymer frequently reported. Many researchers utilized it to fabricate monolithic hydrogels or microgels to adsorb heavy metal ions as the static adsorbents.36–41 Recently, combining the properties of hydrogels with the structure of the ENM, electrospun hydrogel membranes (EHMs) have started to draw great attention in biomedicine and engineering.42–45 However, few studies are reported about the use of EHMs as static adsorbents and flow-through membranes in dynamic processes.
Herein, according to all of the above, we presented a novel adsorptive membrane made up of cellulose acetate and poly(methacrylic acid) via the electrospinning technique. Our work aimed at the following four aspects: (1) presenting a facile electrospinning method to fabricate hydrogel-wrapped nanofibers, which can be utilized to selectively adsorb Pb(II) from aqueous solutions; (2) overcoming the poor functional modification and limited adsorption capacity of the conventional membranes to some extent;46–48 (3) providing a kind of environment-friendly adsorbent to avoid damage to the ecological system caused by the entrance of doped inorganic nanomaterials into water; and (4) breaking through the limitation of traditional hydrogels only as static adsorbents. This paper provided a new perspective in the fabrication of nanofibers wrapped by a hydrogel polymer and the application of the EHM as a flow-through membrane in dynamic adsorption processes. Therefore, this study demonstrated that the cellulose acetate/poly(methacrylic acid) nanofibrous membrane (CPNM) might be highly promising in the removal of Pb(II) from aqueous solutions.
Experimental
Materials
Cellulose acetate, copper chloride, cadmium nitrate, nickel nitrate, lead nitrate, sodium hydroxide and EDTA were provided by Sinopharm Chemical Reagent Co., Ltd. N,N-Dimethylformamide (DMF) was purchased from Tianjin Kemiou Chemical Reagent Co., Ltd. Methacrylic acid (MAA) was purchased from Aladdin Reagent Co. and treated before being used. All chemical reagents were of analytical grade.Methods
Typically, the mass ratios of CA and PMAA were 1![[thin space (1/6-em)]](https://www.rsc.org/images/entities/char_2009.gif) :
:![[thin space (1/6-em)]](https://www.rsc.org/images/entities/char_2009.gif) 1, 2
1, 2![[thin space (1/6-em)]](https://www.rsc.org/images/entities/char_2009.gif) :
:![[thin space (1/6-em)]](https://www.rsc.org/images/entities/char_2009.gif) 1 and 3
1 and 3![[thin space (1/6-em)]](https://www.rsc.org/images/entities/char_2009.gif) :
:![[thin space (1/6-em)]](https://www.rsc.org/images/entities/char_2009.gif) 1, which were added into DMF and fully stirred. The method of synthesising poly(methacrylic acid) PMAA is provided in the ESI.† The total mass factions of CA and PMAA in spinning solutions were all fixed at 15 wt%. The pushing rate was fixed at 2 mL h−1 using a micro-injection pump (LSP01-1A, Longer Pump, Halma Inc.). The working voltage was 17 kV and the nanofibers were collected by a rotary roller. The receiving distance was fixed at 30 cm. The spinning temperature and humidity were fixed at 20.8 ± 2 °C and 30.5 ± 2%, respectively. The obtained EHMs were placed in an oven at 50 °C for one night, and then were pressed at 90 °C. The as-prepared EHMs were heat-treated at 150 °C for 1 h in an oven, and different weight ratios of CA and PMAA (1
1, which were added into DMF and fully stirred. The method of synthesising poly(methacrylic acid) PMAA is provided in the ESI.† The total mass factions of CA and PMAA in spinning solutions were all fixed at 15 wt%. The pushing rate was fixed at 2 mL h−1 using a micro-injection pump (LSP01-1A, Longer Pump, Halma Inc.). The working voltage was 17 kV and the nanofibers were collected by a rotary roller. The receiving distance was fixed at 30 cm. The spinning temperature and humidity were fixed at 20.8 ± 2 °C and 30.5 ± 2%, respectively. The obtained EHMs were placed in an oven at 50 °C for one night, and then were pressed at 90 °C. The as-prepared EHMs were heat-treated at 150 °C for 1 h in an oven, and different weight ratios of CA and PMAA (1![[thin space (1/6-em)]](https://www.rsc.org/images/entities/char_2009.gif) :
:![[thin space (1/6-em)]](https://www.rsc.org/images/entities/char_2009.gif) 1, 2
1, 2![[thin space (1/6-em)]](https://www.rsc.org/images/entities/char_2009.gif) :
:![[thin space (1/6-em)]](https://www.rsc.org/images/entities/char_2009.gif) 1 and 3
1 and 3![[thin space (1/6-em)]](https://www.rsc.org/images/entities/char_2009.gif) :
:![[thin space (1/6-em)]](https://www.rsc.org/images/entities/char_2009.gif) 1) were labelled as CPNM-1, CPNM-2 and CPNM-3, respectively.
1) were labelled as CPNM-1, CPNM-2 and CPNM-3, respectively.
Characterization
The surface morphology of the membrane was characterized by field emission scanning electron microscopy (Hitachi S4800, Japan). A field emission transmission electron microscope (JEM-2100, Japan) was used to observe the inner structure of a single nanofiber. The functional groups and elements of the membrane were detected by FT-IR spectra (Spectrum one, USA) and X-ray photo-electron spectroscopy (XPS, ESCALAB 250Xi, USA). The Pb(II) concentrations were detected using an inductively coupled plasma-optical emission spectrometer (ICP-OES, Optima 8300, PerkinElmer, USA). The tensile strength of the membrane was determined using a CMT4000 testing machine (China). The membranes were cut into 50 mm × 10 mm rectangle samples before testing, and the stretching rate was fixed at 10 mm min−1. The membrane porosity was determined by the fluid displacement method.49The effects of environmental conditions on the adsorption capacity were investigated in a 50 mL centrifuge tube. The effect of solution pH was investigated at pH 2–6. The adsorbent doses were 1 g L−1 and the initial concentration of Pb(II) was 60 mg L−1. The effect of PMAA content was examined with CPNMs (1![[thin space (1/6-em)]](https://www.rsc.org/images/entities/char_2009.gif) :
:![[thin space (1/6-em)]](https://www.rsc.org/images/entities/char_2009.gif) 1, 2
1, 2![[thin space (1/6-em)]](https://www.rsc.org/images/entities/char_2009.gif) :
:![[thin space (1/6-em)]](https://www.rsc.org/images/entities/char_2009.gif) 1 and 3
1 and 3![[thin space (1/6-em)]](https://www.rsc.org/images/entities/char_2009.gif) :
:![[thin space (1/6-em)]](https://www.rsc.org/images/entities/char_2009.gif) 1), and other conditions were the same as those of pH investigation. The initial Pb(II) concentrations (C0) were 10 to 100 mg L−1 (adsorption isothermal experiments). The effect of contact time was observed in the Pb(II) solution (60 mg L−1, pH = 6) for 1–180 min (kinetic assays).
1), and other conditions were the same as those of pH investigation. The initial Pb(II) concentrations (C0) were 10 to 100 mg L−1 (adsorption isothermal experiments). The effect of contact time was observed in the Pb(II) solution (60 mg L−1, pH = 6) for 1–180 min (kinetic assays).
To study uptake selectivity, the competitive adsorption was investigated in multi-component mixtures (Ni(II), Cu(II), Cd(II) and Pb(II)). The ion concentration of each ion was 25 mg L−1 and the pH was 6. In terms of reusability experiments, 30 mL Pb(II) solution (100 mg L−1) was adsorbed by 30 mg adsorbents and shaken for 3 h at 25 °C. For the desorption test, the adsorbents were shaken in 30 mL of 0.1 M EDTA solution for 10 h.
The dynamic adsorption experiments were performed in a dead-end filtration device and the separation process was driven by gravity. Pb(II) solutions with different concentrations were prepared using Millipore water. The feed was supplied continuously to the cell. The membranes were placed in the cell and compacted at 0.05 MPa to obtain a steady flux before testing.
Results and discussion
Characterization of the CPNMs
The SEM images of the membranes are shown in Fig. 1a–c. The surface morphology of the nanofibers was all smooth after thermal treatment. Through Image J software, the average diameters of the nanofibers can be calculated. Fig. 1d–f show that the average values had a slight decline from 302.92 ± 28.09 nm to 284.73 ± 28.85 nm with the mass ratios of PMAA to CA increasing. The TEM images clearly present the core–shell structure of the nanofiber (Fig. 2). Due to the difference of molecular chain activity between the two kinds of polymers, the structure formed in a solvent evaporation process. The relatively dark part of the TEM image was CA and the light area was the PMAA shell. The average thickness of the PMAA shell and diameter of the CA core are listed in Table S1.† The above results indicated that core–shell nanofibers with adjustable thicknesses of the hydrogel layer could be fabricated via a simple, fast, economical and environmentally friendly method, which was significantly different from many traditional modification methods.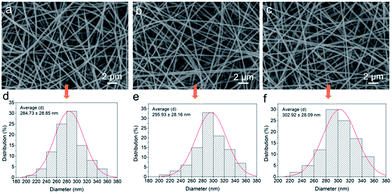 | ||
| Fig. 1 SEM images of the nanofibers with different mass ratios of CA and PMAA: (a) CPNM-1, (b) CPNM-2, and (c) CPNM-3; (d), (e) and (f) are their corresponding diameter distribution. | ||
 | ||
| Fig. 2 (a), (b) and (c) are the corresponding TEM images of CPNM-1, CPNM-2 and CPNM-3, respectively. | ||
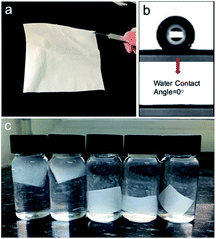
Taking CPNM-1 as an example, the membrane consisting of thousands of core–shell nanofibers was white and flexible (Fig. 3a). When a water droplet came into contact with the surface of the membrane, the water contact angle was 0° in air (Fig. 3b), which was quite beneficial for adsorbents in an aqueous system. After the membrane was completely immersed in water with different pH values (2–6), it reached a hydrogel membrane state (Fig. 3c). The above phenomena revealed the superhydrophilic properties of the CPNM, which further identified that the nanofiber was composed of a hydrophilic PMAA shell and a hydrophobic CA core. Moreover, Table S1† shows several physical parameters about the CPNMs. The data showed that the porosity of the CPNM was above 75%, and the tensile strength had an increasing trend as the content of CA decreased.
Fig. 4a shows the FTIR spectra of the CPNMs with different mass ratios of CA and PMAA. They had the same characteristic absorption peaks, for example, the C![[double bond, length as m-dash]](https://www.rsc.org/images/entities/char_e001.gif) O stretching vibration peaking around 1740 cm−1 where the strong peak belonged to PMAA. There existed a broad band at 3000–3660 cm−1 assigned to the O–H stretching vibration.50 The carboxyl groups had a weak peak at 1368 cm−1 which was assigned to –COO– symmetric stretching vibrations.51 Cellulose had two obvious peaks at 1040 and 1229 cm−1, which were assigned to C–O and C–O–C bond vibrations, respectively.52,53 The XPS test was performed to further investigate the elemental composition of the CPNM. Fig. 4b shows the wide-scan spectrum of the CPNM and the peaks of C1s and O1s can be obviously observed. Fig. 4c shows that the C1s is divided into three peaks. The binding energy of 284.8 eV was attributed to C–C. The peaks at 286.5 and 288.9 eV could be assigned to C–O and C
O stretching vibration peaking around 1740 cm−1 where the strong peak belonged to PMAA. There existed a broad band at 3000–3660 cm−1 assigned to the O–H stretching vibration.50 The carboxyl groups had a weak peak at 1368 cm−1 which was assigned to –COO– symmetric stretching vibrations.51 Cellulose had two obvious peaks at 1040 and 1229 cm−1, which were assigned to C–O and C–O–C bond vibrations, respectively.52,53 The XPS test was performed to further investigate the elemental composition of the CPNM. Fig. 4b shows the wide-scan spectrum of the CPNM and the peaks of C1s and O1s can be obviously observed. Fig. 4c shows that the C1s is divided into three peaks. The binding energy of 284.8 eV was attributed to C–C. The peaks at 286.5 and 288.9 eV could be assigned to C–O and C![[double bond, length as m-dash]](https://www.rsc.org/images/entities/char_e001.gif) O, respectively. As for the O1s spectrum, as shown in Fig. 4d, the fitted peak at the binding energy of 531.2 and 532.3 eV belonged to C
O, respectively. As for the O1s spectrum, as shown in Fig. 4d, the fitted peak at the binding energy of 531.2 and 532.3 eV belonged to C![[double bond, length as m-dash]](https://www.rsc.org/images/entities/char_e001.gif) O and C–O, respectively.
O and C–O, respectively.
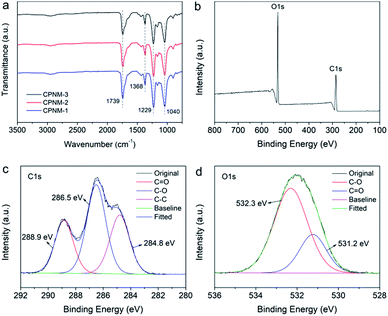 | ||
| Fig. 4 (a) FTIR spectra of the CPNMs; (b) XPS wide-scan spectrum of the CPNM; (c) and (d) are C1s and O1s spectra, respectively. | ||
Adsorption kinetics
The adsorption rate is one of the key aspects affecting the adsorption performance. Three kinetic models, namely the pseudo-first-order model and pseudo-second-order model and intra-particle-diffusion model, were established to describe the controlling mechanism of the Pb(II) adsorption process, such as mass transfer and chemical reaction. Therefore, we investigated the kinetic curves of Pb(II) adsorption, and the parameters of the three kinetic models are presented in Fig. 5 and Table S2.† For the CPNMs, according to the pseudo-first-order kinetic model, their qe,cal values were 16.92, 14.71 and 10.33 mg g−1, respectively, which were not consistent with the experimentally observed qe,exp values (37.6, 43.4 and 53.8 mg g−1). And R2 values of the pseudo-second-order kinetic model were all below 0.9997. Therefore, the results indicated that Pb(II) adsorption followed the pseudo-second-order kinetic model which involved chemical interactions, such as electron exchange or sharing between Pb(II) and binding sites of the membrane.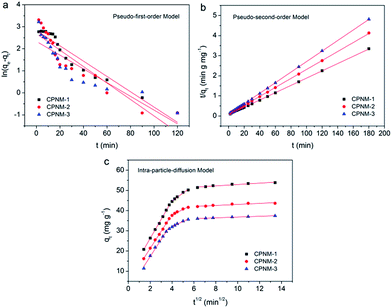 | ||
| Fig. 5 (a) The pseudo-first-order kinetic model, (b) the pseudo-second-order kinetic model, (c) and the intra-particle-diffusion kinetics for the adsorption of Pb(II) by the CPNMs. | ||
As shown in Fig. 5c, the intra-particle-diffusion curves were non-linear, indicating the complex adsorption process of Pb(II) by the CPNMs. The whole diffusion process was decided by three steps. The first step represented the diffusion process of Pb(II) from the solution to the external surface of the membranes. The second step presented further intra-particle diffusion from the surface to the inside part of the membranes. The third step occurred at the equilibrium adsorption stage. The parameters k1, k2 and k3 were the intra-particle diffusion rate constants of the three adsorption steps. The k1 values were higher than k2 and k3 values, indicating the fast transfer and adsorption of Pb(II) from the solution to the surface of the membranes. As the adsorption time increased, the binding sites reduced and were occupied by Pb(II), leading to the slow intra-particle diffusion rate in the second and third step.
Adsorption isotherms
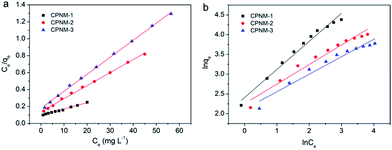
Adsorption isotherm studies are remarkably significant to determine the efficiency and capacity of adsorption. The Langmuir and Freundlich models are commonly used to describe adsorption isotherms. The Langmuir isotherm equation is suitable for the ideal monolayer adsorption and no interactions between the adsorbed molecules, and the Freundlich isotherm model is more often used to describe chemisorption properties.44The fitting lines and corresponding parameters of the two models are shown in Fig. 6 and Table 1. It can be seen that the R2 value was higher (>0.99) when the adsorption mechanism was described by the Langmuir isotherm. The result indicated that Pb(II) adsorption occurred in a monolayer manner on the homogeneous surface of the CPNMs. And the maximum adsorption capacity (Qmax) rose from 49.75 to 146.21 mg g−1 with PMAA content increasing. Therefore, the Pb(II) adsorption capacity can be controlled via changing the thickness of the hydrogel layer to a certain degree.
| Samples | Langmuir | Freundlich | ||||
|---|---|---|---|---|---|---|
| R 2 | Q max | K L | R 2 | 1/n | K F | |
| CPNM-1 | 0.9935 | 146.21 | 0.0828 | 0.9808 | 0.7102 | 11.1275 |
| CPNM-2 | 0.9974 | 68.14 | 0.1102 | 0.9635 | 0.4948 | 9.5151 |
| CPNM-3 | 0.9987 | 49.75 | 0.1128 | 0.9549 | 0.4424 | 8.2744 |
Selectivity performance and reusability study
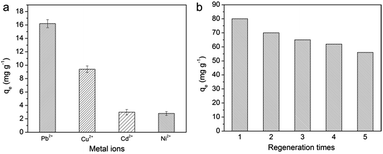
In a mixed solution of bivalent metal ions, their qe values followed the sequence Pb(II) > Cu(II) > Cd(II) > Ni(II), and Pb(II) had the highest qe value (Fig. 7a). This order was consistent with the first stability constants of the associated metal acetate: log![[thin space (1/6-em)]](https://www.rsc.org/images/entities/char_2009.gif) K1 = 2.52, 2.16, 1.5, and 1.2 for Pb(COO)+, Cu(COO)+, Cd(COO)+, and Ni(COO)+, respectively.44 As shown in Table S3,† the KD sequence (Pb(II) > Cu(II) > Cd(II) > Ni(II)+) and α (Pb(II)/Mn+) indicated that the CPNM favored the capture of Pb(II).
K1 = 2.52, 2.16, 1.5, and 1.2 for Pb(COO)+, Cu(COO)+, Cd(COO)+, and Ni(COO)+, respectively.44 As shown in Table S3,† the KD sequence (Pb(II) > Cu(II) > Cd(II) > Ni(II)+) and α (Pb(II)/Mn+) indicated that the CPNM favored the capture of Pb(II).
The desorption characteristics of CPNM-1 in 0.1 M EDTA solution are presented in Fig. 7b. After 1 cycle, due to the sufficient occupation of adsorption sites on CPNM-1, Pb(II) adsorption can eventually reach saturation. However, it can be seen that the qe values of Pb(II) decreased obviously from 80 to 58 mg g−1 after 5 cycles. The result was because some of the Pb(II) ions which were not desorbed by EDTA occupied the adsorption sites. Besides, the SEM images (Fig. S2†) indicated that the surface of the nanofibers became rough after adsorption and desorption, which was quite different from the smooth surface of the initial nanofibers. The reason was that the ion-exchange process led to the shrinkage of PMAA molecules and deformation of the nanofibers.
Dynamic adsorption experiments
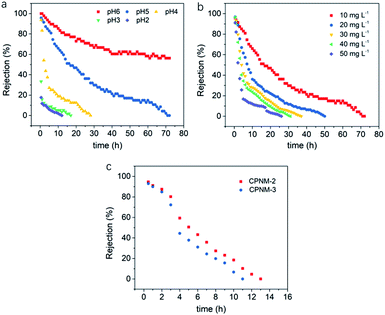
The suitability of the CPNM as a flow-through membrane adsorber was further investigated. Fig. 8a shows the curves of rejection ratios under different pH environments. It can be seen that the pH value significantly affects the rejection ratio of Pb(II) in the dynamic adsorption process. As the pH value decreased, the adsorption equilibrium time of Pb(II) became obviously shorter and the rejection rates of Pb(II) witnessed a more dramatic decline in the initial stage of the adsorption process. The reasons were that low pH values led to fewer adsorption sites, depressing the Pb(II) exchange reaction, and shortening the contact time between the membrane and Pb(II). However, under high pH value conditions, the functional groups of PMAA were deprotonated resulting in more binding sites, and higher adsorption capacity and rejection rates. When the pH value was 6, the rejection rate of Pb(II) still remained above 55% after operating for 72 h, while the rejection rates decreased to 0% at pH values <6. Therefore, the result suggested that relatively high pH values were conducive to the removal of Pb(II) in the dynamic adsorption process.Fig. 8b shows the effect of different initial concentrations of Pb(II) on the rejection rate. As the initial concentration increased, more Pb(II) took part in ion-exchange with the membrane. As a result, the swelling degree of the PMAA shell dramatically decreased, and then the contact time between the solution and the membrane also decreased accordingly. When the initial concentration of Pb(II) in aqueous solution increased from 10 mg L−1 to 50 mg L−1, the adsorption equilibrium time shortened from 72 h to 27 h. The results indicated that the low initial Pb(II) concentration was beneficial to the dynamic adsorption of the CPNM.
In addition, CPNM-2 and CPNM-3 were also operated as the flow-through membranes. As shown in Fig. 8c, the adsorption equilibrium time of the CPNM-2 and the CPNM-3 was below 13 h, which was shorter than that of CPNM-1 under the same conditions. According to the above results, high pH values of solution, low initial ion concentration and a thick hydrogel layer in nanofibers can effectively improve the rejection rate of Pb(II) during the dynamic adsorption process.
Conclusions
This work presented a kind of adsorptive membrane made of hydrogel polymer wrapped nanofibers via a uniaxial electrospinning process. The functional shell of the nanofibers provided abundant available adsorption sites between the surface and interior of the nanofibers. The adsorption capacity was affected by pH, initial ion concentration, contact time and the contents of the functional polymer. Under the optimized conditions, the rejection rates of Pb(II) by the CPNM were up to 95%. The CPNM could be reused after desorption and had selective adsorption for Pb(II) in a mixed divalent ion solution. In addition, the CPNM can be used as the dynamic adsorption membrane, and the rejection ratio of Pb(II) can remain above 55% after running for 72 h when the initial concentration was 10 mg L−1 under pH 6 conditions. The above results demonstrated that the CPNM has great potential as the adsorptive membrane for Pb(II) removal.Conflicts of interest
There are no conflicts to declare.Acknowledgements
This work was funded by the National Key R&D Program of China (2017YFA0207203), National Key R&D Program of China (2016YFC0401107), State Key Laboratory of Urban Water Resource and Environment (Harbin Institute of Technology) (2016DX04) and HIT Environment and Ecology Innovation Special Funds (HSCJ201605).Notes and references
- W. Liu, N. Xu, T. Wang, L. Xiong and J. Ni, Chem. Eng. J., 2013, 215, 366–374 Search PubMed.
- Y. Pang, G. Zeng, L. Tang, Y. Zhang, Y. Liu, X. Lei, Z. Li, J. Zhang and G. Xie, Desalination, 2011, 281, 278–284 CrossRef CAS.
- T. A. Saleh, Desalin. Water Treat., 2015, 57, 1–15 Search PubMed.
- Y. Liu, L. Wang, X. C. Wang, Z. S. Huang, C. B. Xu and J. Ma, Water Res., 2017, 124, 149–157 CrossRef CAS PubMed.
- Y. X. Liu, J. M. Yan, D. X. Yuan, Q. L. Li and X. Y. Wu, Chem. Eng. J., 2013, 218, 81–88 CrossRef CAS.
- K. Nemsadze, T. Sanikidze, L. Ratiani, L. Gabunia and T. Sharashenidze, Georgian Med. News, 2009, 172–173, 92–96 Search PubMed.
- C. H. Yan, J. Xu and X. M. Shen, Environ. Health Perspect., 2013, 121, A294–A295 CrossRef PubMed.
- P. K. Holt, G. W. Barton and C. A. Mitchell, Chemosphere, 2005, 59, 355–367 CrossRef CAS PubMed.
- H. Tokuyama, T. Yoshida and L. L. He, Ind. Eng. Chem. Res., 2011, 50, 10270–10277 CrossRef CAS.
- Z. Liu, D. D. Sun, P. Guo and J. O. Leckie, Nano Lett., 2007, 7, 1081–1085 CrossRef CAS PubMed.
- X. Lu, J. Zhou, Y. Zhao, Y. Qiu and J. Li, Chem. Mater., 2008, 20, 3420–3424 CrossRef CAS.
- Q. Bao, H. Zhang, J. X. Yang, S. Wang, D. Y. Tang, R. Jose, S. Ramakrishna, C. T. Lim and K. P. Loh, Adv. Funct. Mater., 2010, 20, 782–791 CrossRef CAS.
- J. G. Lee, E. J. Lee, S. Jeong, J. Guo, A. K. An and H. Guo, J. Membr. Sci., 2017, 526, 395–408 CrossRef CAS.
- M. Obaid, G. M. K Tolba, M. Motlak, O. A. Fadali, K. A. Khalil and A. A. Almajid, Chem. Eng. J., 2015, 279, 631–638 CrossRef CAS.
- X. Zhao, W. Shan, Y. Xia, J. Yu and B. Ding, Sci. Rep., 2016, 6, 35472 CrossRef CAS PubMed.
- S. W. Choi, J. Y. Park and S. K. Sang, Chem. Eng. J., 2011, 172, 550–556 CrossRef CAS.
- Y. Si, X. Wang, C. Yan, L. Yang, J. Yu and B. Ding, Adv. Mater., 2016, 28, 9655 CrossRef CAS.
- X. Wang, L. Dou, L. Yang, J. Yu and B. Ding, J. Hazard. Mater., 2016, 324, 203–212 CrossRef PubMed.
- S. J. Doh, C. Kim, S. G. Lee, S. J. Lee and H. Kim, J. Hazard. Mater., 2008, 154, 118–127 CrossRef CAS PubMed.
- Y. E. Miao, G. N. Zhu, H. Hou, Y. Y. Xia and T. Liu, J. Power Sources, 2013, 226, 82–86 CrossRef CAS.
- C. Kim, K. Yang, M. Kojima, K. Yoshida and Y. Kim, Adv. Funct. Mater., 2006, 16, 2393–2397 CrossRef CAS.
- T. J. Sill and H. A. von Recum, Biomaterials, 2008, 29, 1989–2006 CrossRef CAS PubMed.
- S. Xin, Z. Zeng, X. Zhou, W. Luo, X. Shi and Q. Wang, J. Hazard. Mater., 2016, 324, 365–372 CrossRef PubMed.
- Y. Tian, M. Wu, R. Liu, Y. Li, D. Wang and J. Tan, Carbohydr. Polym., 2011, 83, 743–748 CrossRef CAS.
- N. Chitpong and S. M. Husson, J. Membr. Sci., 2017, 523, 418–429 CrossRef CAS.
- R. Zhao, X. Li, B. Sun, H. Ji and C. Wang, J. Colloid Interface Sci., 2017, 487, 297–309 CrossRef CAS PubMed.
- P. Tan, J. Wen, Y. Hu and X. Tan, RSC Adv., 2016, 6, 79641–79650 RSC.
- M. Wang, X. Li, W. Hua, L. Shen, X. Yu and X. Wang, ACS Appl. Mater. Interfaces, 2016, 8, 23995–24007 CrossRef CAS PubMed.
- U. Habiba, A. M. Afifi, A. Salleh and B. C. Ang, J. Hazard. Mater., 2017, 322, 182–194 CrossRef CAS PubMed.
- R. Yang, K. B. Aubrecht and H. Ma, Polymer, 2014, 55, 1167–1176 CrossRef CAS.
- A. Z. M. Badruddoza, Z. B. Z. Shawon, W. J. D. Tay, K. Hidajat and M. S. Uddin, Carbohydr. Polym., 2013, 91, 322–332 CrossRef CAS PubMed.
- L. Jiang and P. Liu, ACS Sustainable Chem. Eng., 2014, 2, 1785–1794 CrossRef CAS.
- Y. K. Du, U. P. Shinde, B. Yeon and B. Jeong, Prog. Polym. Sci., 2013, 38, 672–701 CrossRef.
- G. Bayramoğlu and A. M. Yakup, Bioresour. Technol., 2009, 100, 186–193 CrossRef PubMed.
- Y. Liu, W. B. Wang and A. Q. Wang, Desalination, 2010, 259, 258–264 CrossRef CAS.
- P. Liu, L. Jiang, L. Zhu and A. Wang, React. Funct. Polym., 2014, 74, 72–80 CrossRef CAS.
- A. T. Paulino, L. A. Belfiore, L. T. Kubota, E. C. Muniz, V. C. Almeida and E. B. Tambourgi, Desalination, 2011, 275, 187–196 CrossRef CAS.
- C. Lin, C. Liu, G. Zhou, X. Rui, Y. Tang and Z. Zeng, J. Hazard. Mater., 2015, 300, 153–160 CrossRef PubMed.
- G. Zhou, C. Liu, L. Chu, Y. Tang and S. Luo, Bioresour. Technol., 2016, 219, 451–457 CrossRef CAS PubMed.
- R. M. Yu, Y. Z. Shi, D. Z. Yang, Y. X. Liu, J. Qu and Z. Z. Yu, ACS Appl. Mater. Interfaces, 2017, 9, 21809–21819 CrossRef CAS PubMed.
- Q. Fang and B. Chen, J. Mater. Chem. A, 2014, 2, 8941–8951 RSC.
- F. Xu, H. Sheardown and T. Hoare, Chem. Commun., 2015, 52, 1451–1454 RSC.
- S. Lee, S. Yun, K. I. Park and J. H. Jang, ACS Nano, 2016, 10, 3282–3294 CrossRef CAS PubMed.
- D. S. Puperi, A. Kishan, Z. E. Punske, Y. Wu, E. Cosgriffhernandez and J. L. West, ACS Biomater. Sci. Eng., 2016, 4, 1546–1558 CrossRef.
- H. Qi, J. Cao, Y. Xin, X. Mao, D. Xie and J. Luo, Mater. Sci. Eng., C, 2017, 70, 347–356 CrossRef CAS PubMed.
- S. An, M. Liou, K. Y. Song, H. S. Jo, M. W. Lee and S. S. Aldeyab, Nanoscale, 2015, 7, 17778–17785 RSC.
- T. H. Hwang, Y. M. Lee, B. S. Kong, J. S. Seo and J. W. Choi, Nano Lett., 2012, 12, 802–807 CrossRef CAS PubMed.
- C. Wang, K. W. Yan, Y. D. Lin and P. C. H. Hsieh, Macromolecules, 2010, 43, 6389–6397 CrossRef CAS.
- A. L. Ahmad, N. Ideris, B. S. Ooi, S. C. Low and A. Ismail, Desalination, 2011, 278, 318–324 CrossRef CAS.
- N. A. Kumar, H. J. Choi, Y. R. Shin, D. W. Chang, L. M. Dai and J. B. Baek, ACS Nano, 2012, 6, 1715–1723 CrossRef CAS PubMed.
- M. J. Park, G. M. Nisola, E. L. Vivas, L. A. Limjuco, C. P. Lawagon and J. G. Seo, J. Membr. Sci., 2016, 510, 141–154 CrossRef CAS.
- P. M. Spasojevic, V. V. Panic, M. D. Jovic, J. Markovic, C. van Roost, I. G. Popovic and S. J. Velickovic, J. Mater. Chem. A, 2016, 4, 1680–1693 RSC.
- G. L. Huang, H. Y. Zhang, X. S. Jeffrey and T. G. Langrish, Ind. Eng. Chem. Res., 2009, 48, 2646–2651 CrossRef CAS.
- Y. He, X. Chen, S. Y. Bi, C. C. Shi, L. Chen and L. Y. Li, Polym. Adv. Technol., 2013, 24, 934–944 CrossRef CAS.
- J. Wang, P. Jia, K. Pan and B. Cao, Desalin. Water Treat., 2015, 54, 2856–2867 CrossRef CAS.
- Y. S. Ho and G. McKay, Water Res., 1999, 33, 578–584 CrossRef CAS.
- T. Lu, T. Xiang, X. L. Huang, C. Li, W. F. Zhao and Q. Zhang, Carbohydr. Polym., 2015, 133, 587–595 CrossRef CAS PubMed.
- F. C. Wu, R. L. Tsengand and R. S. Juang, Chem. Eng. J., 2009, 153, 1–8 CrossRef CAS.
- Y. Huang, Y. Miao and T. Liu, J. Appl. Polym. Sci., 2014, 131, 5829–5836 Search PubMed.
- M. J. Park, G. M. Nisola, A. B. Beltran, R. E. C. Torrejos, J. G. Seo and S. P. Lee, Chem. Eng. J., 2014, 254, 73–81 CrossRef CAS.
Footnote |
| † Electronic supplementary information (ESI) available. See DOI: 10.1039/c8na00044a |
| This journal is © The Royal Society of Chemistry 2019 |

