Gene expression profile-based drug screen identifies SAHA as a novel treatment for NAFLD†
Zhujun
Cheng
a,
Yusong
Wen
a,
Bowen
Liang
b,
Siyang
Chen
b,
Yujun
Liu
c,
Zang
Wang
b,
Jiayu
Cheng
d,
Xiaoli
Tang
e,
Hongbo
Xin
a and
Libin
Deng
 *ae
*ae
aInstitute of Translational Medicine, Nanchang University, Nanchang, Jiangxi Province 330031, P. R. China. E-mail: denglb1937@163.com; Tel: +86-15170401580
bSchool of Public Health, Nanchang University, Nanchang, Jiangxi Province 330031, P. R. China
cQueen Mary School, Medical College, Nanchang University, Nanchang, Jiangxi Province 330031, P. R. China
dThe Fourth Clinical Medical College, Nanchang University, Nanchang, Jiangxi Province 330031, P. R. China
eCollege of Basic Medical Science, Nanchang University, Nanchang, Jiangxi Province 330031, P. R. China
First published on 3rd January 2019
Abstract
Non-alcoholic fatty liver disease (NAFLD) is the most common chronic liver disease worldwide. Being part of the metabolic syndrome, NAFLD is characterized by the deposition of triglycerides (TGs) as lipid droplets in the cytoplasm of hepatic cells. Recently, the rapid development of high-throughput genome analysis technologies provided opportunities to screen for new drugs for NAFLD. In this study, we screened for potential drugs based on the gene expression profiles of 73 compounds and identified histone deacetylase (HDAC) inhibitors as a novel treatment for the accumulation of lipids in hepatocytes. In the subsequent analysis and experiments, we discovered that SAHA inhibited the fatty acid and lipid metabolism pathways in hepatic cells and induced a significant deficiency of lipid accumulation in HepG2 and SMMC-7721 cells. Furthermore, SAHA inhibited lipid synthesis in hepatic cells by directly suppressing the expression of DGAT2. Hence, our study provides a novel method to screen for effective drugs for liver diseases and identifies SAHA as a potent treatment for NAFLD.
1. Introduction
Non-alcoholic fatty liver disease (NAFLD) is progressively becoming one of the leading causes of chronic liver disease worldwide1 and affects over 20% of the general population.2 Owing to the global obesity epidemic, the prevalence of NAFLD has shown a trend of rapid growth, even in younger patients.3 Moreover, NAFLD is closely associated with metabolic syndrome, insulin resistance and cardiovascular disease.2 In addition, the first hit in the pathogenesis of NAFLD is the dysfunction of hepatic lipid metabolism, which is characterized by the deposition of triglycerides (TGs) as lipid droplets in the cytoplasm of hepatic cells (hepatic steatosis).4 Lifestyle changes and increased insulin sensitivity are the major therapeutic interventions for improving the symptoms of patients with early NAFLD.5 In this context, more effective therapeutic options are urgently needed for patients suffering from NAFLD.Traditionally, drug discovery has been a challenging process that requires more than 10 years and has a high cost.6 Recently, with the rapid development of high-throughput analysis technologies, our understanding of diseases has been broadened.7 Lamb and his group first proposed Connectivity Map (Cmap) analysis based on the use of gene expression profiles from cultured human cells treated with bioactive small molecules and pattern-matching software to discover the functional connections among diseases, genetic perturbations and drug action.8
In the study of cancer therapy, Cmap analysis has made it possible to identify effective drugs for different kinds of cancers.9–16 Moreover, drugs screened by means of Cmap analysis for inflammatory bowel disease,17 Alzheimer's disease,18 pain management,19 smoking cessation20 and muscle atrophy21 also achieved exciting results, and newly identified drugs led to novel recommendations for the treatment of these diseases. However, no published study of NAFLD treatment has used Cmap analysis to identify a potential drug from a library of candidates.
Hence, according to this strategy, we performed an integrated analysis of the gene expression profiles of 73 small molecule drugs in HepG2 cells. We identified candidate drug SAHA as a potent compound for the treatment of NAFLD. In the following experiments, we discovered that lipid accumulation was dramatically decreased in liver cells treated with SAHA, accompanied by the downregulation of genes involved in lipid metabolism. Furthermore, we confirmed that the suppression of HDAC2 by SAHA directly inhibited the expression of DGAT2, which could block TG biosynthesis and reduce the accumulation of lipids in liver cells.
2. Materials and methods
2.1 Bioinformatics analysis
2.2 Experiments
![[thin space (1/6-em)]](https://www.rsc.org/images/entities/char_2009.gif) :
:![[thin space (1/6-em)]](https://www.rsc.org/images/entities/char_2009.gif) 1) with or without 10 μM SAHA for 48 hours. The extent of steatosis was quantified by an ORO staining-based colorimetric assay at 510 nm, and the ratio of the absorbance of ORO staining to cell viability was used to evaluate the extent of steatosis.
1) with or without 10 μM SAHA for 48 hours. The extent of steatosis was quantified by an ORO staining-based colorimetric assay at 510 nm, and the ratio of the absorbance of ORO staining to cell viability was used to evaluate the extent of steatosis.
3. Results
3.1 Identification of a histone deacetylase inhibitor (HDACi) as a candidate drug for NAFLD from 73 compounds
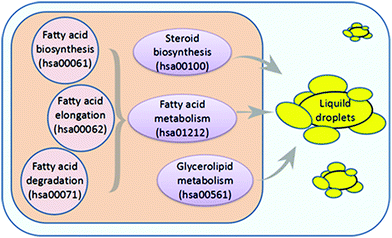
As lipid metabolism disorders play an important role in the pathogenesis of NAFLD, we hypothesized that we might discover a pharmacological inhibitor of NAFLD that could downregulate the mRNA expression of genes related to lipid metabolism. In the Kyoto Encyclopedia of Genes and Genomes (KEGG) pathway database, we collected six pathways associated with lipid and fatty acid metabolism (Fig. 1).To select microarray datasets for the Cmap analysis, we performed a comprehensive search of GEO databases from the NCBI, and used “HepG2 cells” as the keywords in our search. The datasets we choose should meet these criteria: (a) the studies had to be performed in HepG2 cells treated with compounds; (b) the gene expression data had to be profiled on the Affymetrix HU-133 plus 2.0 array platform; (c) the number of test samples and control samples had to be three or greater than three. Then, according to these inclusion criteria, eight GEO datasets were obtained: GSE28878, GSE40117, GSE4465, GSE51952, GSE5230, GSE6878, GSE12161 and GSE25547. To find effective drugs for NAFLD treatment, we downloaded these gene expression profiles from NCBI and a total of 73 compounds in HepG2 cells (Table S1, ESI†) were analyzed and screened to determine whether some of the compounds showed potency in affecting the pathways involved in lipid and fatty acid metabolism.
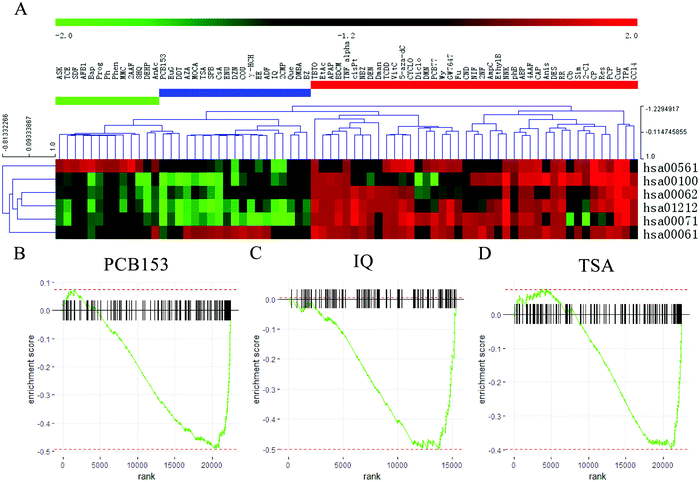
Fig. 2A showed that the 73 compounds were classified into three clusters based on the NES from GSEA analysis. Forty-one compounds, which are presented in the red area, induced upregulation of most of the six pathways; in the blue area, there were 19 compounds that promoted fatty acid biosynthesis (hsa00061) while significantly inhibiting the other 5 pathways; and the green area included 13 compounds that upregulated the glycerolipid metabolism (hsa00561) pathways and downregulated the other pathways. According to this comprehensive appraisal, the compounds in the blue area exhibited more inhibitory effects on lipid and fatty acid metabolism than the compounds in the green area. Therefore, we selected the top three compounds that significantly inhibited these pathways, which were named PCB153, IQ and TSA.
GSEA analysis was conducted to elucidate the effects of PCB153, IQ and TSA on lipid and fatty acid metabolism in HepG2 cells, and the results showed that most of the genes in the six pathways were downregulated after treatment with these three compounds (Fig. 2B–D). PCB153 is a member of the polychlorinated biphenyls (PCBs), which are widespread environmentally persistent organic pollutants that have various adverse effects on the reproductive,23,24 endocrine25 and nervous systems.26 IQ (2-amino-3-methylimidazo[4,5-f]quinoline) is a known carcinogen that causes multiple cancers in rodents, including hepatocellular carcinomas and intestinal tumours.27 Hence, PCB153 and IQ were not viable candidate drugs due to toxicity.
TSA (trichostatin A), a hydroxamic acid, is a widely used HDACi with broad spectrum. HDACs catalyse the deacetylation of histones, maintaining the equilibrium state between histone acetylation and deacetylation, and are closely related to gene transcription and expression, affecting cell proliferation, differentiation, and apoptosis.28 Nunes et al. revealed that TSA could decrease cholesterol levels in neuronal cells by modulating genes involved in cholesterol synthesis, uptake and efflux.29 Therefore, we speculated that HDACis represent a potential therapeutic approach for NAFLD.
3.2 SAHA shows inhibitory effects on lipid accumulation in OA-induced hepatic steatosis
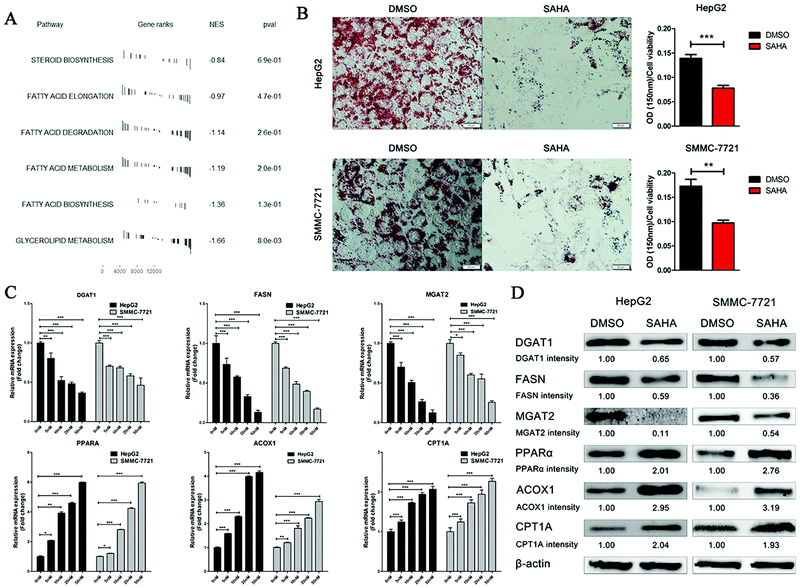
SAHA (vorinostat), which is an optimized structure with TSA as the lead compound, acquired US Food and Drug Administration (FDA) approval for the treatment of cutaneous T cell lymphoma in 2006. To explore whether SAHA has inhibitory effects on lipid metabolism, similar to TSA, the gene expression profiles of liver cells with and without SAHA treatment were acquired from the GEO database and analysed utilizing GSEA analysis. Notably, all six pathways involved in lipid and fatty acid metabolism were downregulated significantly by SAHA treatment (Fig. 3A).To confirm the impact of SAHA on lipid synthesis in vitro, we set up an OA-induced hepatic steatosis model in HepG2 and SMMC-7721 cells. Lipid accumulation in the cells was examined by ORO staining. As expected, lipid accumulation decreased dramatically in HepG2 cells treated with SAHA compared to that of the control in the presence of oleic acid (Fig. 3B). Similarly, SAHA significantly reduced the lipid content in SMMC-7721 cells.
Then, we analysed the mRNA expression levels of some enzymes that are involved in the metabolism of lipids by real-time RT-PCR in HepG2 and SMMC-7721 cells. As shown in Fig. 3C, compared to the control treatment, SAHA dramatically suppressed the mRNA expression of the key rate-limiting enzymes of triacylglycerol synthesis (MGAT2 and DGAT1) and the key lipogenic enzyme FASN in a dose-dependent manner. Furthermore, PPARα, which is closely associated with the biological processes of gluconeogenesis and fatty acid beta-oxidation, was remarkably upregulated after SAHA treatment. Additionally, the mRNA expression of the genes ACOX1 and CPT1A, the rate-limiting enzymes of fatty acid beta-oxidation, also increased progressively with increasing concentrations of SAHA.
To further confirm that treatment with SAHA can alleviate the accumulation of lipids in hepatocellular carcinoma (HCC) cells, we detected the expression of proteins involved in lipid metabolism in HepG2 and SMMC-7721 cells by western blotting. As expected, in comparison with that of the control group, the expression of MGAT2, DGAT1 and FASN was significantly decreased by SAHA. Similarly, the expression levels of the ACOX1, CPT1A and PPARα proteins were increased significantly (Fig. 3D). Analysis of these data by repeated measures demonstrated that SAHA could ameliorate hepatic steatosis by inhibiting lipid accumulation in HCC cells.
3.3 Inhibition of HDAC2 by SAHA suppresses expression of the DGAT2 transcript
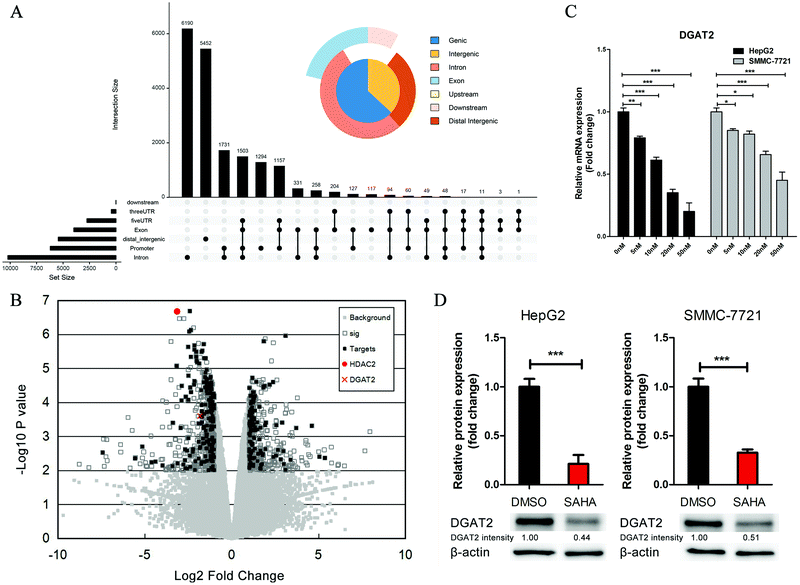
SAHA is a well-accepted HDAC2 inhibitor, and HDACs modulate histones and non-histone proteins to regulate chromatin structure and gene expression.30 To further elucidate the function of SAHA in ameliorating the accumulation of lipids in NAFLD, we analysed the ChIP-Seq data for HDAC2 from the Encyclopedia of DNA Elements (ENCODE) and obtained a total of 18![[thin space (1/6-em)]](https://www.rsc.org/images/entities/char_2009.gif) 647 enriched peaks. Among these peaks, 6206 were located from approximately −3000 to +3000 bp around the TSS of the corresponding genes (Fig. 4A). We also screened the gene expression data (GSE52232) obtained after the depletion of HDAC2 in HepG2 cells by RNA interference. There were 943 candidate genes that exhibited considerable changes in expression (P value <0.01); these genes consisted of 420 upregulated genes and 523 downregulated genes. In addition, to further explore the biological significance of HDAC2 in the transcriptional regulation of genes related to lipid metabolism in liver cells, we integrated the predicted HDAC2 target genes from the ChIP-Seq datasets with these DEGs and observed that the expression of DGAT2, which was one of the predicted target genes of HDAC2, was dramatically decreased (Fig. 4B). The mRNA level and protein levels of DGAT2 were verified, and we discovered the inhibitory effect of SAHA on the expression of DGAT2 (Fig. 4C and D).
647 enriched peaks. Among these peaks, 6206 were located from approximately −3000 to +3000 bp around the TSS of the corresponding genes (Fig. 4A). We also screened the gene expression data (GSE52232) obtained after the depletion of HDAC2 in HepG2 cells by RNA interference. There were 943 candidate genes that exhibited considerable changes in expression (P value <0.01); these genes consisted of 420 upregulated genes and 523 downregulated genes. In addition, to further explore the biological significance of HDAC2 in the transcriptional regulation of genes related to lipid metabolism in liver cells, we integrated the predicted HDAC2 target genes from the ChIP-Seq datasets with these DEGs and observed that the expression of DGAT2, which was one of the predicted target genes of HDAC2, was dramatically decreased (Fig. 4B). The mRNA level and protein levels of DGAT2 were verified, and we discovered the inhibitory effect of SAHA on the expression of DGAT2 (Fig. 4C and D).
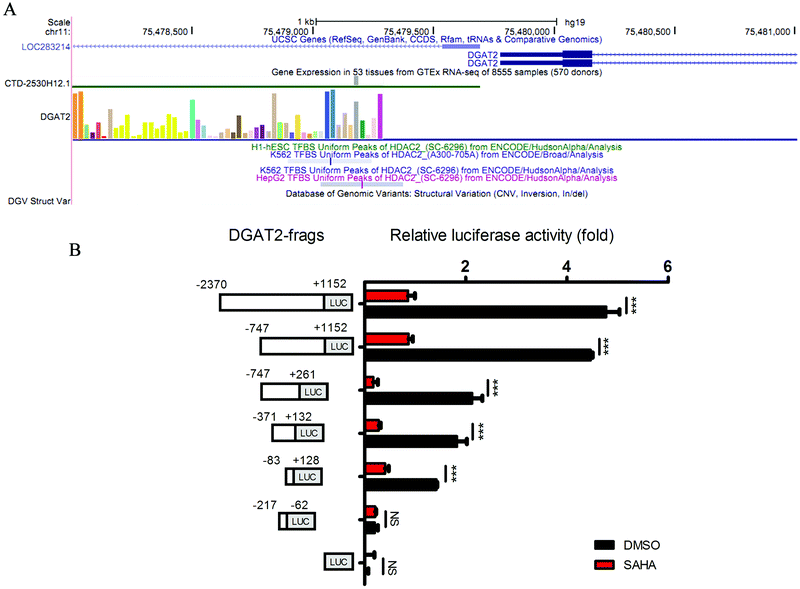
DGAT2 is the enzyme that catalyses the final step in the biosynthesis of TGs and has been recognized as a potential therapeutic target for obesity and diabetes in recent years.31,32 Subsequently, we investigated whether HDAC2 could directly regulate the transcription of DGAT2 through a luciferase assay. We constructed a series of luciferase reporter plasmids driven by the HDAC2 binding site-containing DGAT2 promoter (Fig. 5A) and performed luciferase reporter assays using HepG2 cells. As shown in Fig. 4D, the downregulation of HDAC2 by SAHA markedly decreased luciferase activity driven by the full-length DGAT2 promoter or short fragments of the DGAT2 promoter but not the region from approximately −217 to −62 in HepG2 cells; in addition, a DGAT2 promoter fragment (approximately −83 to +128) was sufficient for HDAC2 binding and regulation (Fig. 5B). Consistent with the initial analysis, these results further confirmed that directly suppressing the binding of HDAC2 to the DGAT2 promoter by SAHA treatment led to a decrease in DGAT2 expression, which could inhibit lipid accumulation and attenuate hepatic steatosis development and progression.
4. Discussion
HDACs are a family of enzymes that lead to the deacetylation of lysine residues in histone and non-histone proteins, and they control histone acetylation with histone acetyltransferases.33 Increasing evidence indicates that HDACs can regulate the expression of multiple genes associated with the pathogenesis of many diseases, such as gastric cancer,34–36 liver cancer,37 nasopharyngeal carcinoma,2 cervical cancer38 and lymphocytic leukaemia.39 Recently, more investigators have focused on the effect of HDACis on diseases involved in metabolic disorders. In HepG2 and F9 cells, TSA treatment resulted in clear repression of genes involved in the cholesterol biosynthesis, fatty acid biosynthesis and glycolysis pathways and showed potency in the control of cholesterol levels in humans.40 SAHA, which is known as vorinostat, is structurally related to the natural product TSA. It has also been revealed that the HDACis TSA and SAHA could increase both mRNA and protein levels of CLA-1/SR-BI in macrophages, which played an anti-atherosclerotic role in atherosclerosis.41In our study, Cmap analysis based on eight independent datasets screened out TSA as a compound that could inhibit most of the pathways associated with lipid and fatty acid metabolism, and we chose the optimized HDACi SAHA to conduct our experiments. To investigate the correlation of lipid metabolism and the expression of related genes following treatment with SAHA and DMSO in HepG2 cells, GSEA analysis was carried out, and the results demonstrated that SAHA significantly inhibited all the pathways of lipid metabolism. Furthermore, ORO staining also verified that SAHA significantly decreased lipid accumulation in both HepG2 and SMMC-7721 cells. In addition, the marked reduction in the expression levels of lipogenesis genes (FASN, DGAT1 and MGAT2) demonstrated that SAHA reduced hepatic cell lipid accumulation by decreasing lipid synthesis. We also observed significant increases in the mRNA and protein expression of important regulators of lipid beta-oxidation (PPARA, CPT1A and ACOX1) in HepG2 and SMMC-7721 cells treated with SAHA, implying that SAHA also induced lipid beta-oxidation in hepatic cells. In a model of obesity and diabetes (db/db mice), SAHA treatment induced a significant reduction of circulating TGs, non-esterified fatty acids and lipids that accumulate in the liver of db/db mice and dramatically decreased both fasting glycaemia and circulating insulin.40 Based on this evidence, SAHA, as a safe and effective drug that is already available commercially, exhibits potency for the treatment of metabolic diseases and activity against multiple solid tumours and haematological malignancies.
Recently, a study reported that SAHA significantly improved insulin resistance, learning and memory performance and ameliorated biochemical abnormalities induced by a high-fat diet in mice.5 To further elucidate the function of SAHA in ameliorating the accumulation of lipids in NAFLD, the ChIP-Seq data for HDAC2 from ENCODE and the gene expression data obtained after HDAC2 knockdown from the GEO database (GSE52232) identified 187 downregulated and 122 upregulated genes among all candidate target genes of HDAC2. We found that DGAT2 was among the dramatically downregulated candidate target genes of HDAC2. DGAT2, which is in the glycerolipid metabolism pathway, is the critical rate-limiting enzyme catalysing the de novo synthesis of triacylglycerols from newly synthesized fatty acids and nascent diacylglycerols. The results of real-time quantitative PCR and western blotting assays verified that the expression of DGAT2 was significantly decreased in HepG2 and SMMC-7721 cells treated with SAHA. Although the DGAT1 and DGAT2 enzymes catalyse the final step in the synthesis of TGs, they have different catalytic activities. It has been reported that DGAT2 overexpression causes more TG accumulation in rat hepatoma cells than DGAT1 overexpression, and in mice, DGAT2 deficiency results in a severe decrease in TG, while DGAT1 deficiency leads to a moderate reduction.42,43 Moreover, the result from our luciferase reporter assay further confirmed that the inhibition of HDAC2 by SAHA directly suppressed the transcription of DGAT2 in HepG2 cells through the predicted binding sites in the DGAT2 promoter area. Furthermore, Victor et al. reported that DGAT2 is the link between glycaemia and triglyceridaemia, which are important markers of the metabolic syndrome.44 Based on the results of this study and the previous reports, the inhibition of HDAC2 by SAHA might be a potential therapeutic strategy for NAFLD.
5. Conclusion
Our results highlight the pivotal role of SAHA, an HDACi, in the epigenetic regulation of transcription of genes involved in lipid metabolism based on transcriptome data and bioinformatics analytical techniques. Subsequent experiments further confirmed the anti-NAFLD effects of SAHA and suggested that SAHA is a potential effective drug for the treatment of NAFLD.Author contributions
Libin Deng designed the experiments and interpreted the data. Zhujun Cheng, Yusong Wen, Bowen Liang, Siyang Chen, Yujun Liu, Zang Wang and Jiayu Cheng performed the experiments. Xiaoli Tang, Hongbo Xin and Zhujun Cheng analysed the data. Zhujun Cheng and Libin Deng wrote the paper. All authors read and approved the manuscript.Conflicts of interest
There are no conflicts of interest to declare.Acknowledgements
This work was supported in part by the National Natural Science Foundation of China (81660041 to Libin Deng and 81200631 to Xiaoli Tang) and the Natural Science Foundation of Jiangxi Province (20181BAB205008 and 20133BCB23007 to Libin Deng and 20171BAB205109 to Xiaoli Tang).References
- A. C. Tuyama and C. Y. Chang, J. Diabetes, 2012, 4, 266–280 CrossRef CAS PubMed.
- X. L. Yang, C. D. Zhang, H. Y. Wu, Y. H. Wu, Y. N. Zhang, M. B. Qin, H. Wu, X. C. Liu, X. Lina and S. M. Lu, Asian Pac. J. Cancer Prev., 2014, 15, 4663–4670 CrossRef PubMed.
- J. M. Pappachan, S. Babu, B. Krishnan and N. C. Ravindran, J. Clin. Transl. Hepatol., 2017, 5, 384–393 Search PubMed.
- X. Zhang, J. H. Zhang, X. Y. Chen, Q. H. Hu, M. X. Wang, R. Jin, Q. Y. Zhang, W. Wang, R. Wang, L. L. Kang, J. S. Li, M. Li, Y. Pan, J. J. Huang and L. D. Kong, Antioxid. Redox Signaling, 2015, 22, 848–870 CrossRef CAS PubMed.
- S. Sharma and R. Taliyan, Neuropharmacology, 2016, 105, 285–297 CrossRef CAS PubMed.
- M. P. Licciardello, A. Ringler, P. Markt, F. Klepsch, C. H. Lardeau, S. Sdelci, E. Schirghuber, A. C. Muller, M. Caldera, A. Wagner, R. Herzog, T. Penz, M. Schuster, B. Boidol, G. Durnberger, Y. Folkvaljon, P. Stattin, V. Ivanov, J. Colinge, C. Bock, K. Kratochwill, J. Menche, K. L. Bennett and S. Kubicek, Nat. Chem. Biol., 2017, 13, 771–778 CrossRef CAS PubMed.
- A. Julia, J. Invest. Dermatol., 2017, 137, 1000–1002 CrossRef CAS PubMed.
- J. Lamb, E. D. Crawford, D. Peck, J. W. Modell, I. C. Blat, M. J. Wrobel, J. Lerner, J. P. Brunet, A. Subramanian, K. N. Ross, M. Reich, H. Hieronymus, G. Wei, S. A. Armstrong, S. J. Haggarty, P. A. Clemons, R. Wei, S. A. Carr, E. S. Lander and T. R. Golub, Science, 2006, 313, 1929–1935 CrossRef CAS PubMed.
- D. C. Hassane, M. L. Guzman, C. Corbett, X. Li, R. Abboud, F. Young, J. L. Liesveld, M. Carroll and C. T. Jordan, Blood, 2008, 111, 5654–5662 CrossRef CAS PubMed.
- F. M. Siu, D. L. Ma, Y. W. Cheung, C. N. Lok, K. Yan, Z. Yang, M. Yang, S. Xu, B. C. Ko, Q. Y. He and C. M. Che, Proteomics, 2008, 8, 3105–3117 CrossRef CAS PubMed.
- M. H. Chen, W. L. Yang, K. T. Lin, C. H. Liu, Y. W. Liu, K. W. Huang, P. M. Chang, J. M. Lai, C. N. Hsu, K. M. Chao, C. Y. Kao and C. Y. Huang, PLoS One, 2011, 6, e27186 CrossRef CAS PubMed.
- S. Claerhout, J. Y. Lim, W. Choi, Y. Y. Park, K. Kim, S. B. Kim, J. S. Lee, G. B. Mills and J. Y. Cho, PLoS One, 2011, 6, e24662 CrossRef CAS PubMed.
- A. K. Reka, R. Kuick, H. Kurapati, T. J. Standiford, G. S. Omenn and V. G. Keshamouni, J. Thorac. Oncol., 2011, 6, 1784–1792 CrossRef PubMed.
- M. Sirota, J. T. Dudley, J. Kim, A. P. Chiang, A. A. Morgan, A. Sweet-Cordero, J. Sage and A. J. Butte, Sci. Transl. Med., 2011, 3, 96ra77 CrossRef CAS PubMed.
- G. Wang, Y. Ye, X. Yang, H. Liao, C. Zhao and S. Liang, PLoS One, 2011, 6, e14573 CrossRef CAS PubMed.
- L. Yang and P. Agarwal, PLoS One, 2011, 6, e28025 CrossRef CAS PubMed.
- J. T. Dudley, M. Sirota, M. Shenoy, R. K. Pai, S. Roedder, A. P. Chiang, A. A. Morgan, M. M. Sarwal, P. J. Pasricha and A. J. Butte, Sci. Transl. Med., 2011, 3, 96ra76 CrossRef CAS PubMed.
- F. Chen, Q. Guan, Z. Y. Nie and L. J. Jin, Am. J. Alzheimer's Dis., 2013, 28, 693–701 CrossRef PubMed.
- M. Chang, S. Smith, A. Thorpe, M. J. Barratt and F. Karim, Mol. Pain, 2010, 6, 56 CrossRef PubMed.
- J. O. Boyle, Z. H. Gumus, A. Kacker, V. L. Choksi, J. M. Bocker, X. K. Zhou, R. K. Yantiss, D. B. Hughes, B. Du, B. L. Judson, K. Subbaramaiah and A. J. Dannenberg, Cancer Prev. Res., 2010, 3, 266–278 CrossRef CAS PubMed.
- S. D. Kunkel, M. Suneja, S. M. Ebert, K. S. Bongers, D. K. Fox, S. E. Malmberg, F. Alipour, R. K. Shields and C. M. Adams, Cell Metab., 2011, 13, 627–638 CrossRef CAS PubMed.
- G. Yu, L. G. Wang and Q. Y. He, Bioinformatics, 2015, 31, 2382–2383 CrossRef CAS PubMed.
- Y. Chen, M. S. McLachlan, S. Kaserzon, X. Wang, L. Weijs, M. Gallen, L. M. Toms, Y. Li, L. L. Aylward, P. D. Sly and J. F. Mueller, Environ. Res., 2016, 147, 259–268 CrossRef CAS PubMed.
- I. Ali, B. Julin, A. Glynn, J. Hogberg, M. Berglund, J. E. Johansson, S. O. Andersson, O. Andren, E. Giovannucci, A. Wolk, U. Stenius and A. Akesson, Carcinogenesis, 2016, 37, 1144–1151 CrossRef CAS PubMed.
- A. Mesnier, S. Champion, L. Louis, C. Sauzet, P. May, H. Portugal, K. Benbrahim, J. Abraldes, M. C. Alessi, M. J. Amiot-Carlin, F. Peiretti, P. Piccerelle, G. Nalbone and P. H. Villard, PLoS One, 2015, 10, e0128847 CrossRef PubMed.
- A. Szczepkowska, C. Lagaraine, V. Robert, J. Mlynarczuk, L. Dufourny, J. C. Thiery and J. Skipor, Ecotoxicol. Environ. Saf., 2016, 124, 303–308 CrossRef CAS PubMed.
- S. A. Bol, J. Horlbeck, J. Markovic, J. G. de Boer, R. J. Turesky and A. Constable, Carcinogenesis, 2000, 21, 1–6 CrossRef CAS PubMed.
- V. Moresi, M. Carrer, C. E. Grueter, O. F. Rifki, J. M. Shelton, J. A. Richardson, R. Bassel-Duby and E. N. Olson, Proc. Natl. Acad. Sci. U. S. A., 2012, 109, 1649–1654 CrossRef CAS PubMed.
- M. J. Nunes, M. Moutinho, M. J. Gama, C. M. Rodrigues and E. Rodrigues, PLoS One, 2013, 8, e53394 CrossRef CAS PubMed.
- Y. H. Lee, D. Seo, K. J. Choi, J. B. Andersen, M. A. Won, M. Kitade, L. E. Gomez-Quiroz, A. D. Judge, J. U. Marquardt, C. Raggi, E. A. Conner, I. MacLachlan, V. M. Factor and S. S. Thorgeirsson, Cancer Res., 2014, 74, 4752–4761 CrossRef CAS PubMed.
- S. Friedel, K. Reichwald, A. Scherag, H. Brumm, A. K. Wermter, H. R. Fries, K. Koberwitz, M. Wabitsch, T. Meitinger, M. Platzer, H. Biebermann, A. Hinney and J. Hebebrand, BMC Genet., 2007, 8, 17 CrossRef PubMed.
- C. S. Choi, D. B. Savage, A. Kulkarni, X. X. Yu, Z. X. Liu, K. Morino, S. Kim, A. Distefano, V. T. Samuel, S. Neschen, D. Zhang, A. Wang, X. M. Zhang, M. Kahn, G. W. Cline, S. K. Pandey, J. G. Geisler, S. Bhanot, B. P. Monia and G. I. Shulman, J. Biol. Chem., 2007, 282, 22678–22688 CrossRef CAS PubMed.
- X. X. Zheng, T. Zhou, X. A. Wang, X. H. Tong and J. W. Ding, Atherosclerosis, 2015, 240, 355–366 CrossRef CAS PubMed.
- Q. Shen, W. Tang, J. Sun, L. Feng, H. Jin and X. Wang, Am. J. Transl. Res., 2014, 6, 538–547 CAS.
- X. Zhu, J. Liu, X. Xu, C. Zhang and D. Dai, Int. J. Oncol., 2015, 46, 195–204 CrossRef CAS PubMed.
- Y. L. Li, T. S. Yang, W. M. Ruan, W. Cui, Y. Jin and X. M. Zou, Int. J. Clin. Exp. Med., 2014, 7, 1958–1966 Search PubMed.
- Q. Q. Shi, G. W. Zuo, Z. Q. Feng, L. C. Zhao, L. Luo, Z. M. You, D. Y. Li, J. Xia, J. Li and D. L. Chen, Asian Pac. J. Cancer Prev., 2014, 15, 7849–7855 CrossRef PubMed.
- D. H. Yang, J. W. Lee, J. Lee and E. Y. Moon, PLoS One, 2014, 9, e97352 CrossRef PubMed.
- L. Peiffer, S. J. Poll-Wolbeck, H. Flamme, I. Gehrke, M. Hallek and K. A. Kreuzer, J. Cancer Res. Clin. Oncol., 2014, 140, 1283–1293 CrossRef CAS PubMed.
- S. V. Chittur, N. Sangster-Guity and P. J. McCormick, BMC Genomics, 2008, 9, 507 CrossRef PubMed.
- Y. Bao, Y. Yang, L. Wang, L. Gao, W. Jiang, L. Wang, S. Si and B. Hong, Atherosclerosis, 2009, 204, 127–135 CrossRef CAS PubMed.
- S. J. Stone, H. M. Myers, S. M. Watkins, B. E. Brown, K. R. Feingold, P. M. Elias and R. V. Farese, Jr., J. Biol. Chem., 2004, 279, 11767–11776 CrossRef CAS PubMed.
- S. J. Smith, S. Cases, D. R. Jensen, H. C. Chen, E. Sande, B. Tow, D. A. Sanan, J. Raber, R. H. Eckel and R. V. Farese, Jr., Nat. Genet., 2000, 25, 87–90 CrossRef CAS PubMed.
- V. A. Zammit, Biochem. J., 2013, 451, 1–12 CrossRef CAS PubMed.
Footnote |
| † Electronic supplementary information (ESI) available. See DOI: 10.1039/c8mo00214b |
| This journal is © The Royal Society of Chemistry 2019 |

