
 Open Access Article
 This Open Access Article is licensed under a Creative Commons Attribution-Non Commercial 3.0 Unported Licence
Progress in understanding the four dominant intra-particle phenomena of lignocellulose pyrolysis: chemical reactions, heat transfer, mass transfer, and phase change
M. Brennan
Pecha
 *a,
Jorge Ivan Montoya
Arbelaez
b,
Manuel
Garcia-Perez
c,
Farid
Chejne
b and
Peter N.
Ciesielski
a
*a,
Jorge Ivan Montoya
Arbelaez
b,
Manuel
Garcia-Perez
c,
Farid
Chejne
b and
Peter N.
Ciesielski
a
aBiosciences Center, National Renewable Energy Laboratory, Golden, CO, USA. E-mail: brennan.pecha@nrel.gov; Tel: +1-303-275-4817
bFacultad de Minas, Universidad Nacional de Colombia, Medellín, Colombia
cBiological Systems Engineering, Washington State University, Pullman, Washington, USA
First published on 17th April 2019
Abstract
Four principal intra-particle phenomena occur in a highly concerted manner during the pyrolysis of lignocellulosic materials: heat transfer, mass transfer, chemical reactions, and phase changes. Achieving a holistic understanding of these processes has been challenged by their intricate coupling, high temperatures, and rapid rates at which they occur. Heat and mass transfer have been well studied at the single-particle level but their coupling with chemical reactions and phase change within single particle models remains problematic. Equally challenging is the multiscale coupling of reactor- and single particle-scale models. Too little attention has been given to phase change. Similarly, the presence of oligomeric compounds (constituting up to 20% of the oil) has not been fully accounted for in chemical reaction schemes and physical models developed for pyrolysis. Recent studies have shown that a multiscale approach is key to predictive modelling across a variety of reactor systems. Historical and recent developments are outlined in this pyrolysis review paper regarding these four intra-particle phenomena, as well as modelling efforts to capture their effect on product yields and composition. It is critical for the design of future biomass pyrolysis systems to appropriately account for all four intra-particle phenomena and their inter-connectivities in order to predict, achieve, and maintain optimal operation.
 M. Brennan Pecha | Dr M. Brennan Pecha is a researcher at the National Renewable Energy Laboratory. During his PhD in Chemical Engineering at Washington State University he studied fundamental heat transfer, mass transfer, chemistry, and phase change phenomena in biomass pyrolysis. His current work at NREL focuses on simulation of chemical reactions in biomass pyrolysis and catalytic systems. |
 Jorge Ivan Montoya Arbelaez | Dr Jorge Montoya studied Chemical Engineering at Universidad Nacional de Colombia-Medellín. He finished his MSc in chemical engineering and PhD in engineering-Energetic systems at Universidad Nacional de Colombia-Medellín. In 2015 he was at WSU for one year, working in a fundamental aspects of biomass pyrolysis. Since 2017 Jorge Montoya has been working at CELSIA-Colombia developing projects at industrial scale of cogeneration with biomass and biogas. |
 Manuel Garcia-Perez | Dr Manuel Garcia-Perez is a professor for the Biological Systems Engineering department at Washington State University. He has been working for the last 20 years on projects related to thermochemical conversion of lignocellulosic materials for producing bio-fuels and chemicals. Dr Garcia-Perez has studied thermochemical reactions of cellulose, hemicelluloses and lignin as well as the characterization and uses of crude bio-oils and chars. He is currently working on the development of more selective pyrolysis reactors and on new concepts to refine pyrolysis oils. Dr Garcia-Perez is also very active on the development and characterization of engineering carbonaceous materials. |
 Farid Chejne | Dr Farid Chejne-Janna is an associate professor in the Department of Processes and Engineering at the Universidad Nacional de Colombia-Medellín. He is also a member of the Colombian Academy of Science. His research focuses are modeling and process simulations, analysis of energy systems, advanced thermodynamics, and energy resource evaluations. |
 Peter N. Ciesielski | Dr Peter Ciesielski is a Senior Scientist at the National Renewable Energy Laboratory. He has an interdisciplinary background and training in Chemical and Biological Engineering and Materials Science. Dr Ciesielski's research encompasses many aspects of bioenergy and biomaterials science and aims to improve ways by which renewable feedstocks can be used for the sustainable production of fuels, chemicals, and materials. |
Introduction
The total worldwide energy consumption in recent years is estimated to be approximately 515 EJ y−1, 80% of which is currently supplied by fossil fuels like coal and petroleum.1,2 Global energy consumption has increased exponentially over the last century due to population growth and increased per capita demands, particularly from emerging countries like Brazil, Russia, India, and China (BRIC).3,4 Renewable energy sources such as biomass, solar radiation, wind, water and geothermal are all potential alternatives that can be used to offset fossil energy consumption. Of these sustainable sources, biomass is the only direct source of carbon for renewable fuels and chemicals production that can be inserted into existing markets. The global biomass supply potential is estimated from 97–147 EJ in 2030.5 While it is feasible to use all of this for power, heating, transportation,5 further technical advances and investments need to be made first. Recent progress has been made in developing advanced bioproducts and biomaterials, which greatly enhance profit margins for biofuels technologies.6 Fast pyrolysis processes offer a promising opportunity for the rapid thermal processing of agro-industrial wastes into bio-oil. The development of this technology is relevant and appropriate with benefits over current biofuel productions methods. In particular, it need not compete with food security, unlike first generation transesterification and fermentation processes commonly used to produce ethanol and biodiesel, and has the potential to be incorporated into existing petroleum refining infrastructure.7–12Pyrolysis processes require heating of biomass at temperatures between 400–600 °C in an inert or anoxic atmosphere to produce bio-oil, biochar, and non-condensable gases with high calorific value. Heat transfer, chemical reactions, phase change, and mass transport occur in concert, as illustrated in Fig. 1. Volatiles are released as both condensable compounds (bio-oil or pyrolysis oil) and non-condensable gases rich in CO, CH4, and H2. The remaining solid char (biochar or biocarbon) from this process is high in carbon content with a low oxygen/carbon ratio. Bio-oil is considered to be largely compatible when blended with vacuum gas oil in FCC units of oil refineries12 while the solid char can be combusted to provide heat to the pyrolysis reactor and other integrated processes. Low-ash char is also attractive for metallurgical applications as a reducing agent, as a gas/water filtration medium, soil additive, etc.13–15 Without government regulation on carbon emissions, bringing char to market is currently more profitable than bio-oil,16 as argued early on by Antal et al.17,18 Non-condensable pyrolysis gas are typically combusted and recirculated into the reactor to provide heat and act as fluidization medium, or can be used in downstream processes such as catalytic methane reforming or Fisher Tropsch.19,20
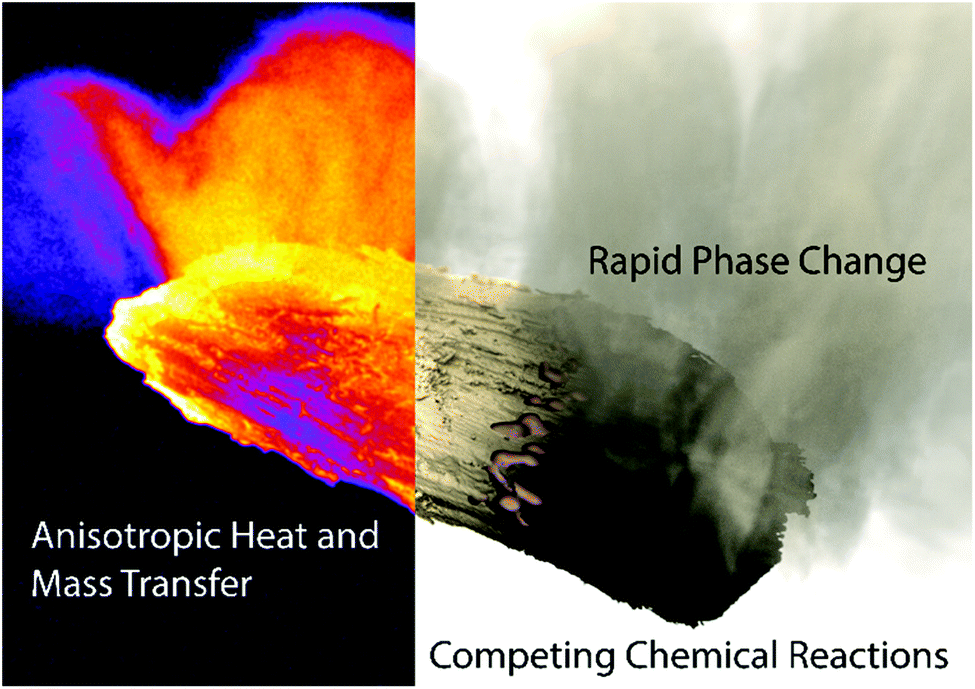 | ||
| Fig. 1 Depiction of the four primary phenomena that occur during biomass pyrolysis: heat and mass transfer occur as anisotropic processes due to the aspherical geometry and directional internal porosity of biomass particles (left); these are coupled to thermally-drivel chemical reactions which promote transition into molten and vapor phases (right). | ||
Depending on operating conditions, the pyrolysis process has historically been classified typically as slow pyrolysis, intermediate pyrolysis and fast pyrolysis. Slow pyrolysis, with particles larger than 1 cm, is used primarily for char production whereby 30–35% w/w of the carbon is converted to char with the remainder being bio-oil and non-condensable gases.21 The char can resemble a high-rank coal as it converts, as shown in Fig. 2 in a van Krevelen diagram.22 Fast pyrolysis, with high heating rates and small particle sizes typically 1–5 mm, is employed when the primary desired product is bio-oil which is produced at yields ranging from 50–80% yield in conjunction with minor yields of biochar (10–20% w/w) and non-condensable gas (10–20% w/w).11,23 In each case, yields are strongly influenced by the type of biomass, operating temperature, gas residence time in the reactor, heating rate, particle size and mineral content. High heating rates and small particle sizes are key for achieving high selectivity towards the production of bio-oil. A variety of pyrolysis technologies have been developed for producing bio-oils via fast pyrolysis, some of which have been put into commercial operation by entities including Ensyn, BTG, Dynamotive, GTI, KIT, VTT, and PyroTec.24,25
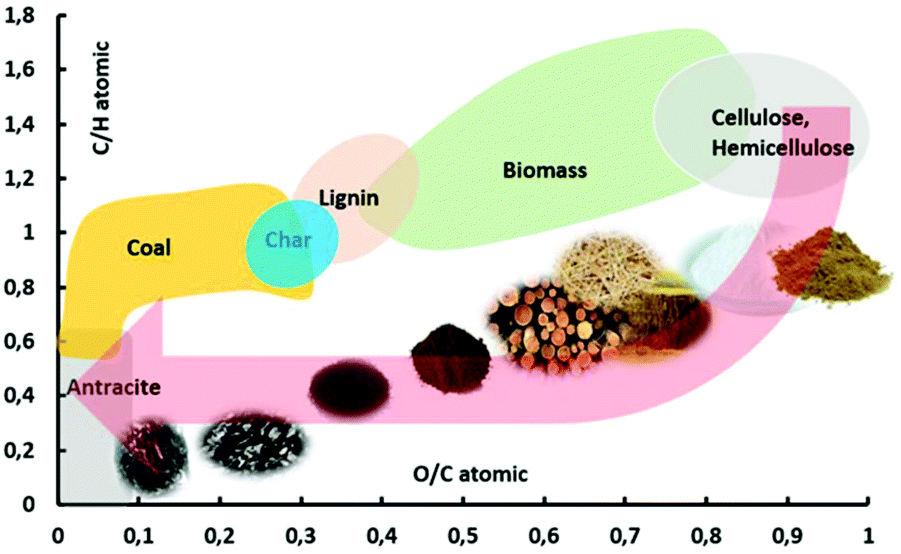 | ||
| Fig. 2 Van Krevelen diagram comparing biomass and pyrolysis products to coal. | ||
Despite substantial research in the field of biomass pyrolysis, very few companies have succeeded in commercializing the technologies that produce bio-oil as the primary product, although many examples exist of companies who employ “slow” pyrolysis to produce char briquettes such as Kingsford and Weber. It has been argued that one reason for failure to scale up is a lack of understanding of the fundamental phenomena of biomass pyrolysis.26 The purpose of this review is to describe the four principal intra-particle phenomena of biomass pyrolysis: chemical reactions, heat transfer, mass transfer, and phase change. The authors believe that too little attention has been given to phase change, particularly with regards to the liquid intermediate stage between native biopolymer and vaporized organic compounds. This work will have a special emphasis on recent developments in understanding this phenomenon.
Chemical reactions
Chemical composition of lignocellulosic materials
Biomass can be defined as an organic material composed primarily of a heterogeneous mixture of polymers and a small fraction of inert materials which comes from previously living plants. The organic fraction consists of polymers containing three major macromolecules: cellulose, hemicellulose, and lignin as shown in Fig. 3. In addition to these primary polymers, some biomasses contain a small quantity of lipids, pectin, and extractives, which do not exceed 10% w/w.11,27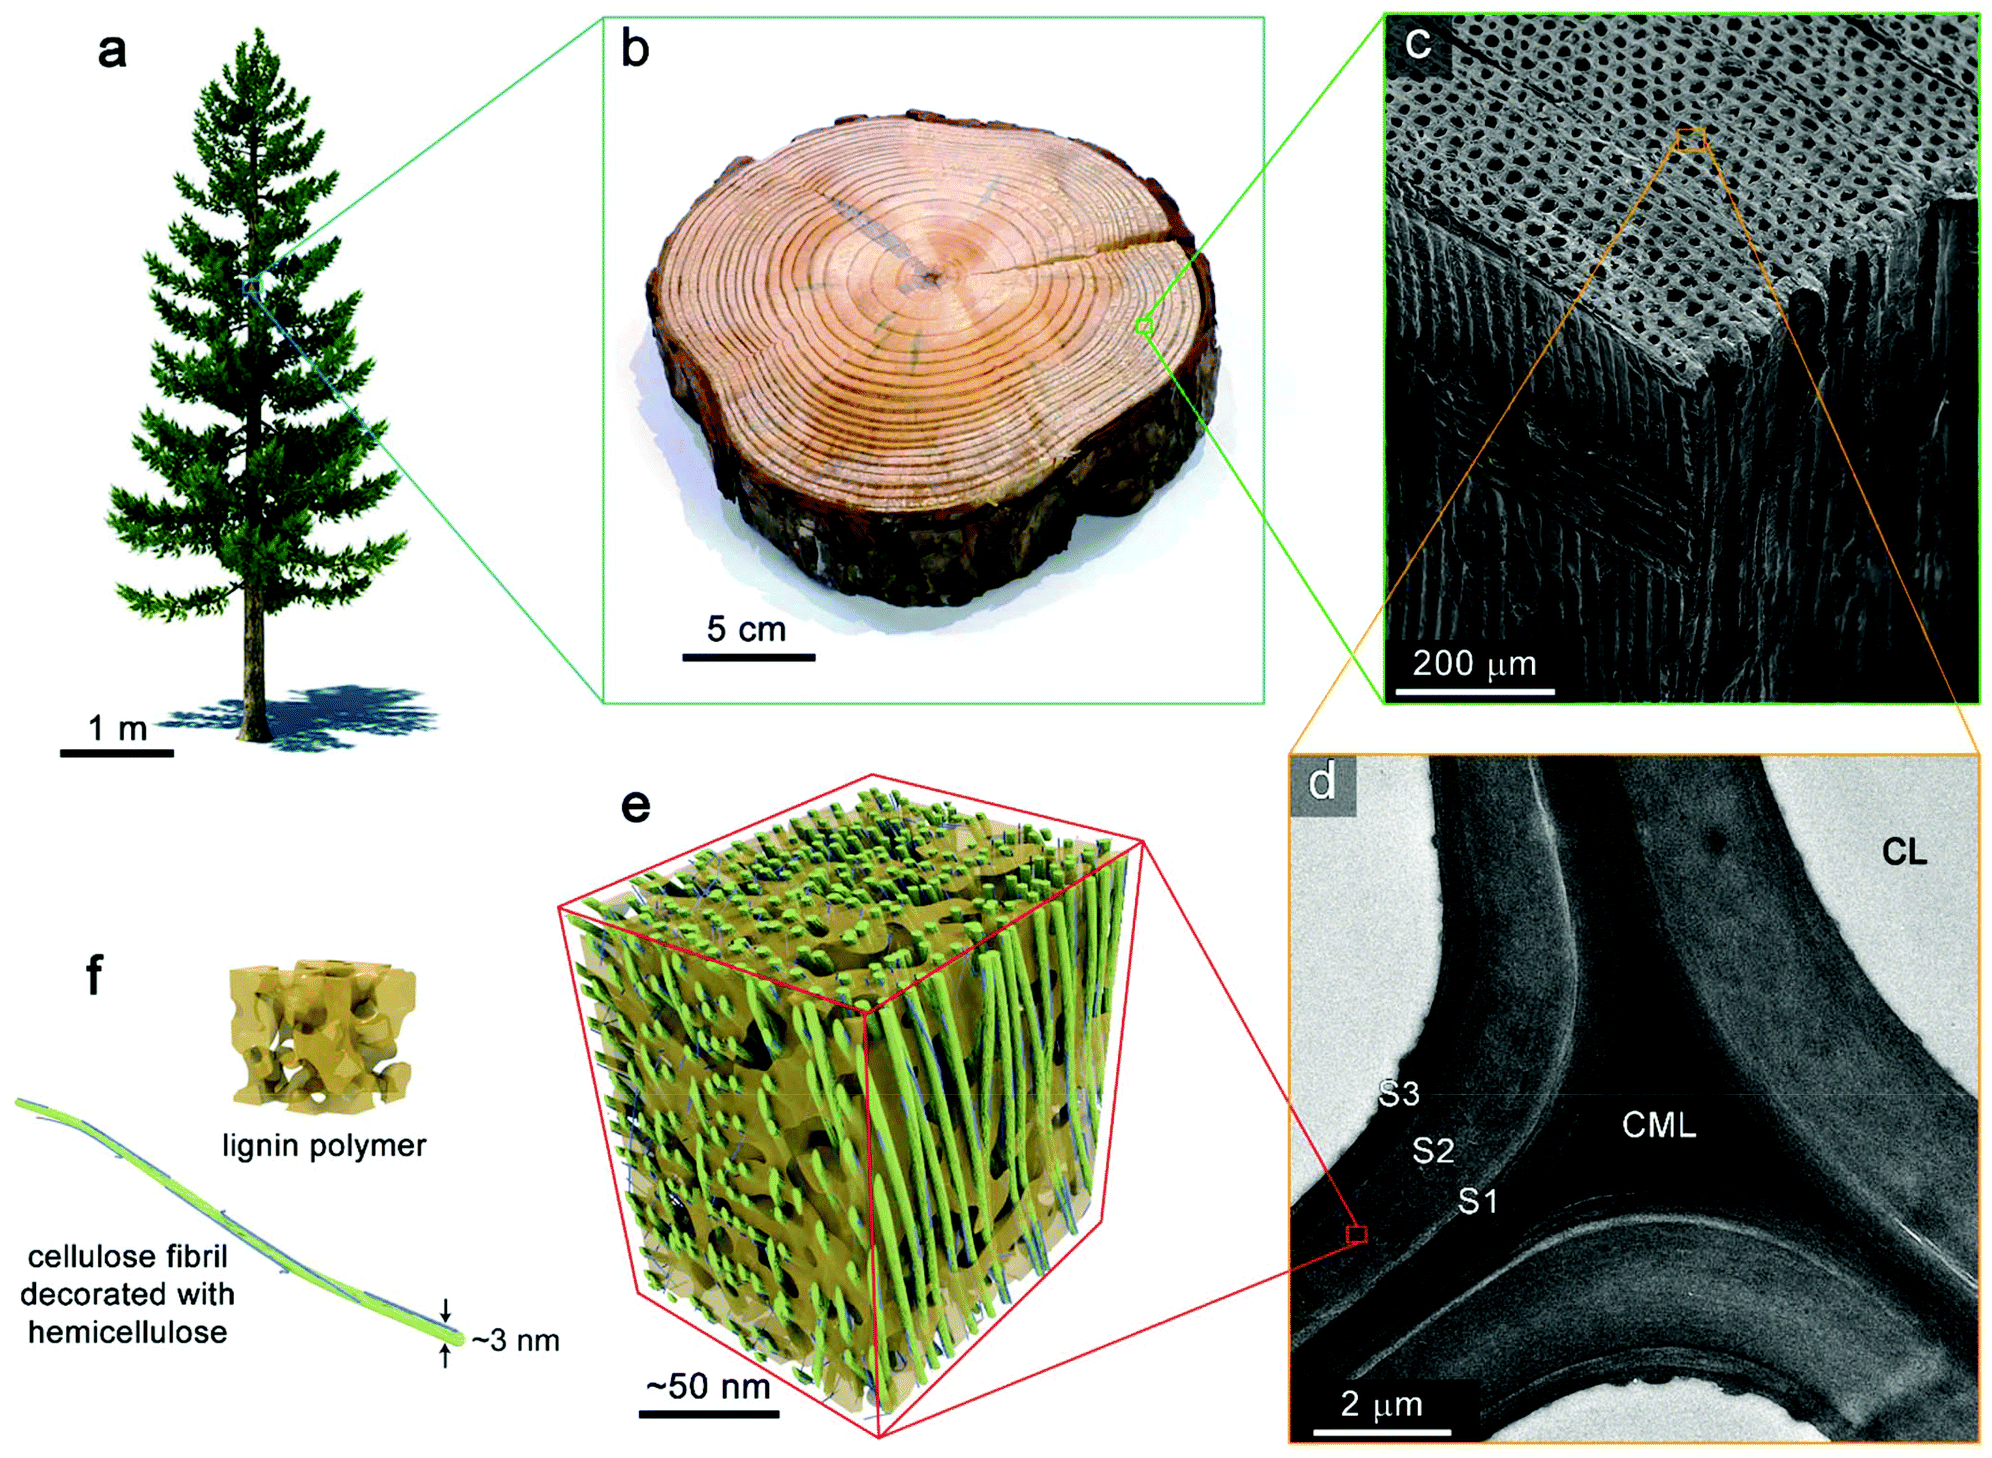 | ||
| Fig. 3 Hierarchal structure of wood. (a) Coniferous tree. (b) Photograph of trunk section from a pine tree. (c) SEM image of the tissue structure softwood (yellow pine). (d) TEM image showing the ultrastructure wood cell wall. CL, cell lumen; CML, compound middle lamella; S1, S2, and S3 denote layers of the secondary cell wall. (e) Schematic of the nanoscale architecture of lignocellulose. (f) Idealized depiction of an amorphous lignin polymer and a cellulose elementary fibril decorated with hemicellulose (microfibril). Reprinted (adapted) with permission from Zhu et al.39 Copyright (2016) American Chemical Society. | ||
Cellulose makes up about 40 to 60% of the total biomass weight, hemicellulose 15–25%, and lignin 15–25%.28–30 Cellulose is a linear, mostly crystalline, polymer composed of glucose structural units linked by β-D type glycosidic bonds. These monomeric units link together to form chains of 10![[thin space (1/6-em)]](https://www.rsc.org/images/entities/char_2009.gif) 000 or more structural units. Cellulose polymers form fibers inside biomass, and are responsible for the fibrous nature of cell walls. Hemicelluloses are polysaccharides with an amorphous, branched polymeric structure and a substantially lower degree of polymerization than cellulose, approximately 100, primarily of the following types: xylans, homoxylans, glucoronoxylans, arabinoxylans, glucuronoarabinoxylans, mannans, and others.31 It is primarily composed of sugars with 5 and 6 carbons per unit like xylose, mannose, arabinose, galactose and glucose. Angiosperm species have mostly xylan and gymnosperm species have mostly glucomannan based hemicellulose.32 Lignin is a complex, branched, non-crystalline macromolecule, composed of three primary aromatic monomeric constituents: sinapyl, coniferyl, and coumaryl alcohols linked by β-ether linkages and other variety of C–C and C–O–C bonds exist between monomer units of lignin as β-O-4, α-O-4, β-5, 5–5, 4-O-5, β-1, and β–β bonds.29,33 Both lignin and hemicellulose are responsible for binding cellulose fibers together, maintaining the structure of the cell walls.33,34
000 or more structural units. Cellulose polymers form fibers inside biomass, and are responsible for the fibrous nature of cell walls. Hemicelluloses are polysaccharides with an amorphous, branched polymeric structure and a substantially lower degree of polymerization than cellulose, approximately 100, primarily of the following types: xylans, homoxylans, glucoronoxylans, arabinoxylans, glucuronoarabinoxylans, mannans, and others.31 It is primarily composed of sugars with 5 and 6 carbons per unit like xylose, mannose, arabinose, galactose and glucose. Angiosperm species have mostly xylan and gymnosperm species have mostly glucomannan based hemicellulose.32 Lignin is a complex, branched, non-crystalline macromolecule, composed of three primary aromatic monomeric constituents: sinapyl, coniferyl, and coumaryl alcohols linked by β-ether linkages and other variety of C–C and C–O–C bonds exist between monomer units of lignin as β-O-4, α-O-4, β-5, 5–5, 4-O-5, β-1, and β–β bonds.29,33 Both lignin and hemicellulose are responsible for binding cellulose fibers together, maintaining the structure of the cell walls.33,34
Less-discussed are the “extractives” and mineral matter in biomass. Extractives include chemical families such as turpentine, rosin, tall oil fatty acids, tanning materials, camphor, volatile oils, gums, and rubber.35 Huge industries have historically been built around these high-value chemicals. Extractives are more abundant in oily biomass species like olive pomace and nut shells than common wood species like pine and poplar, which typically less than 2 wt%. Metal matter content depends on the type of biomass, but comprises 2–25% of the total solid weight and commonly consist of minerals such as Si, Na, K, Ca, Mg, Mn, Co, Zn, and Cu. These minerals are present as like oxides and salts such as chlorides, carbonates, phosphates and sulphates.36–38 Mineral matter plays an important role in thermal decomposition of biomass, acting as catalyst for critical reactions, such as dehydration and catalytic cracking of the volatiles, though Si is not considered a catalytic species.
The complex, hierarchical structure of biomass visualized in Fig. 3 originates from tissue structure of the once-living plant. This structure is highly specific to the plant species of origin and can vary dramatically. At the nanoscale, the lignocellulosic material comprising plant cell walls is an impressive, highly-ordered assembly of biopolymeric components. Bundles of several 18–24 chains of cellulose form elementary cellulose fibrils which are often further aggregated into macrofibrils. These are decorated and crosslinked by hemicelluloses. Lignin acts as matrixing material which provides additional structural support, defence from fungal and microbial attack, moisture control. This nanocomposite material forms the cell walls of plant tissue. Assemblies of cells make up the microstructure of plants in highly directional pores that transport water and nutrients throughout the organism during its lifetime. The anisotropic transport of heat and mass throughout biomass during pyrolysis results from this microstructure which is retained within biomass particles after comminution processes.
Biopolymer breakdown at pyrolysis temperatures: studies on isolated constituents
The compounds present in pyrolysis oil are derived from the biopolymers present in the biomass. Thus, the composition of bio-oil is highly dependent on the proportions and characteristics of cellulose, lignin, hemicellulose, and extractives as well as interactions between these moieties inside biomass solid matrix.40–43 This variety of biopolymers causes thermal decomposition to progress in several stages. Initially, hemicellulose breaks down at temperatures between 200–300 °C. This is followed by the degradation of cellulose, which decomposes between 300 and 450 °C. Lignin decomposition occurs across the full temperature range of 250–500 °C, but is the last polymer to fully degrade. Lignin is the major contributor to char production at the end of pyrolysis.43–46Cellulose has been by far the most studied component of biomass. The position and orientation of glucan linkages do not have a significant effect on levoglucosan yields, which is the chief monomeric compound obtained from the devolatilization of cellulose.47 Other fundamental work demonstrated that cellulose that has a high degrees of polymerization (DP) produced more levoglucosan and less char than cellulose with lower DP.48 The regions under maximum stress, and therefore the most likely to fracture during pyrolysis, are precisely those that are located at the interface of the amorphous and crystalline structures.49 It has also been illustrated that the maximum temperature required to achieve cellulose decomposition is higher for crystalline cellulose structures than for amorphous cellulose due to the extra energy required to disrupt the crystal lattice structure.50,51 As cellulose degrades, the chains continue to break down in a continuous fashion, passing through oligomeric compounds (two or more glucan units) all the way to monomeric levoglucosan.52 Cellulose pyrolysis has been recently reviewed in detail for further reading.53
Due to the complex structure of lignin within biomass, the final structure of isolated lignins shows significant differences in molecular weight and aromatic structures distribution based on the separation methods employed and biomass used.54,55 Product yields have been found to vary substantially depending on the type of lignin used for pyrolysis.56,57 Saka et al.57 reported that lignins from softwoods tend to pyrolyze at lower temperatures and produce more volatiles and less char than lignins derived from hardwoods. This observation is attributed to the molecular structure of hardwood lignins, which are more complex, and have a high molecular weight than softwood lignins, providing greater resistance to thermal decomposition. Unfortunately, there are very few studies regarding the effect of the type and nature of lignins on the product distribution during pyrolysis. Further review on lignin pyrolysis studies can be found elsewhere.58
Pyrolysis of isolated hemicelluloses has been studied even less than lignin. This is largely because of the difficulty associated with extracting well-preserved hemicelluloses. Nevertheless, some studies have been performed on isolated polysaccharides similar to hemicelluloses, with primary products being acetic acid, furfural, formic acid, furfural, 5-hydroxymethyl furfural, and neutral sugars, as reviewed in detail by Zhou et al.31 Furthermore, studies using xylan, one of many types of hemicellulose, are often unreliable because commercial xylan is up to 10 wt% potassium (a catalyst for gas production).59 At temperatures between 150 and 240 °C, the methoxy and acetyl bonds of hemicellulose dehydrate.60 Between 240 and 350 °C, the glycosidic bonds break, similar to cellulose.60–62 Char formation reactions in xylan dominate above 300 °C.61,62
Further reading on studies to understand the chemistry of biomass pyrolysis can be found by Wang et al.63 and Collard et al.53
Catalytic effect of metal content native to biomass
Biomass contains traces of mineral material (K, Na, Ca, Zn, Cu, P, Mg, Mn), usually in the form of oxides or salts such as chlorides, sulphates, carbonates and phosphates.36,38,64–66 The proportions of these minerals depends on the type of biomass, as well as collection, drying, and grinding conditions. The content of inorganic material affects product yields and is an important parameter for the study of side reactions; generally, as the mineral material content increases, bio-oil yields decrease and gas and char production increase.11,25,30,37,44,67–69 Changes in product composition are largely due to the catalytic effect of the mineral matter on several reaction pathways including the dehydration and decarboxylation reactions.70 Alkalis strongly interact with functional groups such as –COOH and –OH, forming alkali-oxygen clusters that promote cracking reactions.66 The common metals with the greatest impact on volatile yields were, in descending impact: K+, Na+, Ca2+, Mg2+. Low concentrations, e.g. 0.5% w/w, increase char yields by up to 10% and increase the yield of low molecular weight species such as acetol, glycol aldehyde, and formic acid while the anhydrosugar (e.g. levoglucosan) yield decreases.65,70 Although some studies differ on impacts of various metals, consensus is that potassium is the biggest offender.36,38,64,71–73Additional effects on reaction pathways have also been observed; for example, sodium restricts cellulose and hemicellulose transglycosylation reactions but facilitates demethoxylation, demethylation, and dehydration of lignin.74 The presence of silicon has also been found to decrease the production of volatiles.72 In contrast to the effects of alkali and alkaline metals, adding anions (chloride, nitrates, sulfates) has been found to increase levoglucosan production and decrease char yields.73 In recent years, numerous works have been published that examine the effect of mineral matter on final product distribution.36,38,65,75–77 Despite these efforts, very few theoretical models for the quantitative prediction of the effects of inorganic material on the product distribution of fast pyrolysis processes are available.78,79
The presence of mineral matter has also been found to affect morphological changes during biomass pyrolysis. Iwasaki et al.80 showed that a possible cause of particles agglomeration inside fluidized bed reactors is the formation of an intermediate liquid phase during devolatilization, that covers all particles inside the fluidized bed and promotes agglomeration. The formation of this liquid phase is favored for biomasses that have been pretreated with acids. Visualization of inert material particles from fluidized beds revealed a coating which acts to promote particle agglomeration. The formation of this film is most evident for biomasses that were previously pre-treated with organic acids.81 Oudenhoven et al.81 have shown that part of the solid residue left by biomasses treated with acid has lost its original structure, forming new structures similar to a melted polymer. Cavities were observed that presumably formed when bubbles rupture inside the liquid phase. Recent work has showed the corollary result that materials that still have mineral content tend to maintain their original tissue structure after pyrolysis.82
Effect of reaction temperature on chemical reactions
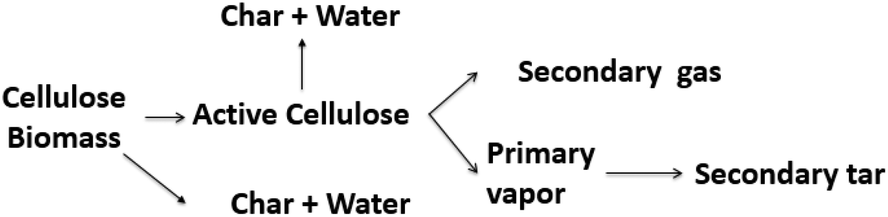
The devolatilization process is sequential and depends on the temperature reached by the particle. The first stage occurs between 20–120 °C and corresponds to water evaporation from the biomass. The second stage between 120–300 °C shows no appreciable biomass weight loss, though small quantities of some gases, such as CO, CO2, and steam are released from dehydration reactions and decarboxylation of R–CO–R groups belonging to hemicellulose and lignin.29,83,84 Between 250 and 370 °C,50,85–88 cellulose undergoes endothermic reactions and becomes plasticized, often called “active cellulose”, wherein the amorphous parts of the cellulose degrade and expose reducing ends of cellulose chains.51 Above 300 °C, an intermediate liquid phase known by many researchers as “molten cellulose”, or “intermediary liquid compound” due to formation of anhydrous oligomers that have low vapor pressure at these temperatures.87,89,90 Between 300 and 400 °C, about 80% weight loss can occur without mass or heat transfer limitations.87 In this stage, random fragmentation of glycosidic bonds in cellulose, hemicellulose and their oligomers generate volatile compounds with high oxygen content, leaving a carbonaceous residue known as char or biochar.23,91,92 At temperatures above 400 °C, CO and CO2 are released by depolymerization reactions from the lignin-rich aromatic carbonaceous matrix.Fig. 4 provides one example of a large particle in which temperature was measured in situ. Though spherical particles are not representative of industrially-relevant biomass feedstocks,93 the thermal pathway is still characteristic of wood. Here it can be seen that endothermic phenomena occur around 400–500 °C and exothermic phenomena dominate between 600 and 800 °C. The first event around 630 K (357 °C) is associated with the pyrolysis of cellulose and the evaporation of the products of this reaction. The exothermic phenomena which occur at higher temperatures are due to the release of heat by polycondensation reactions.94,95 “Thermal runaway” is notable in larger particles, where conductive heat transfer is slow compared to exothermic secondary reactions of slowly diffusing products.96
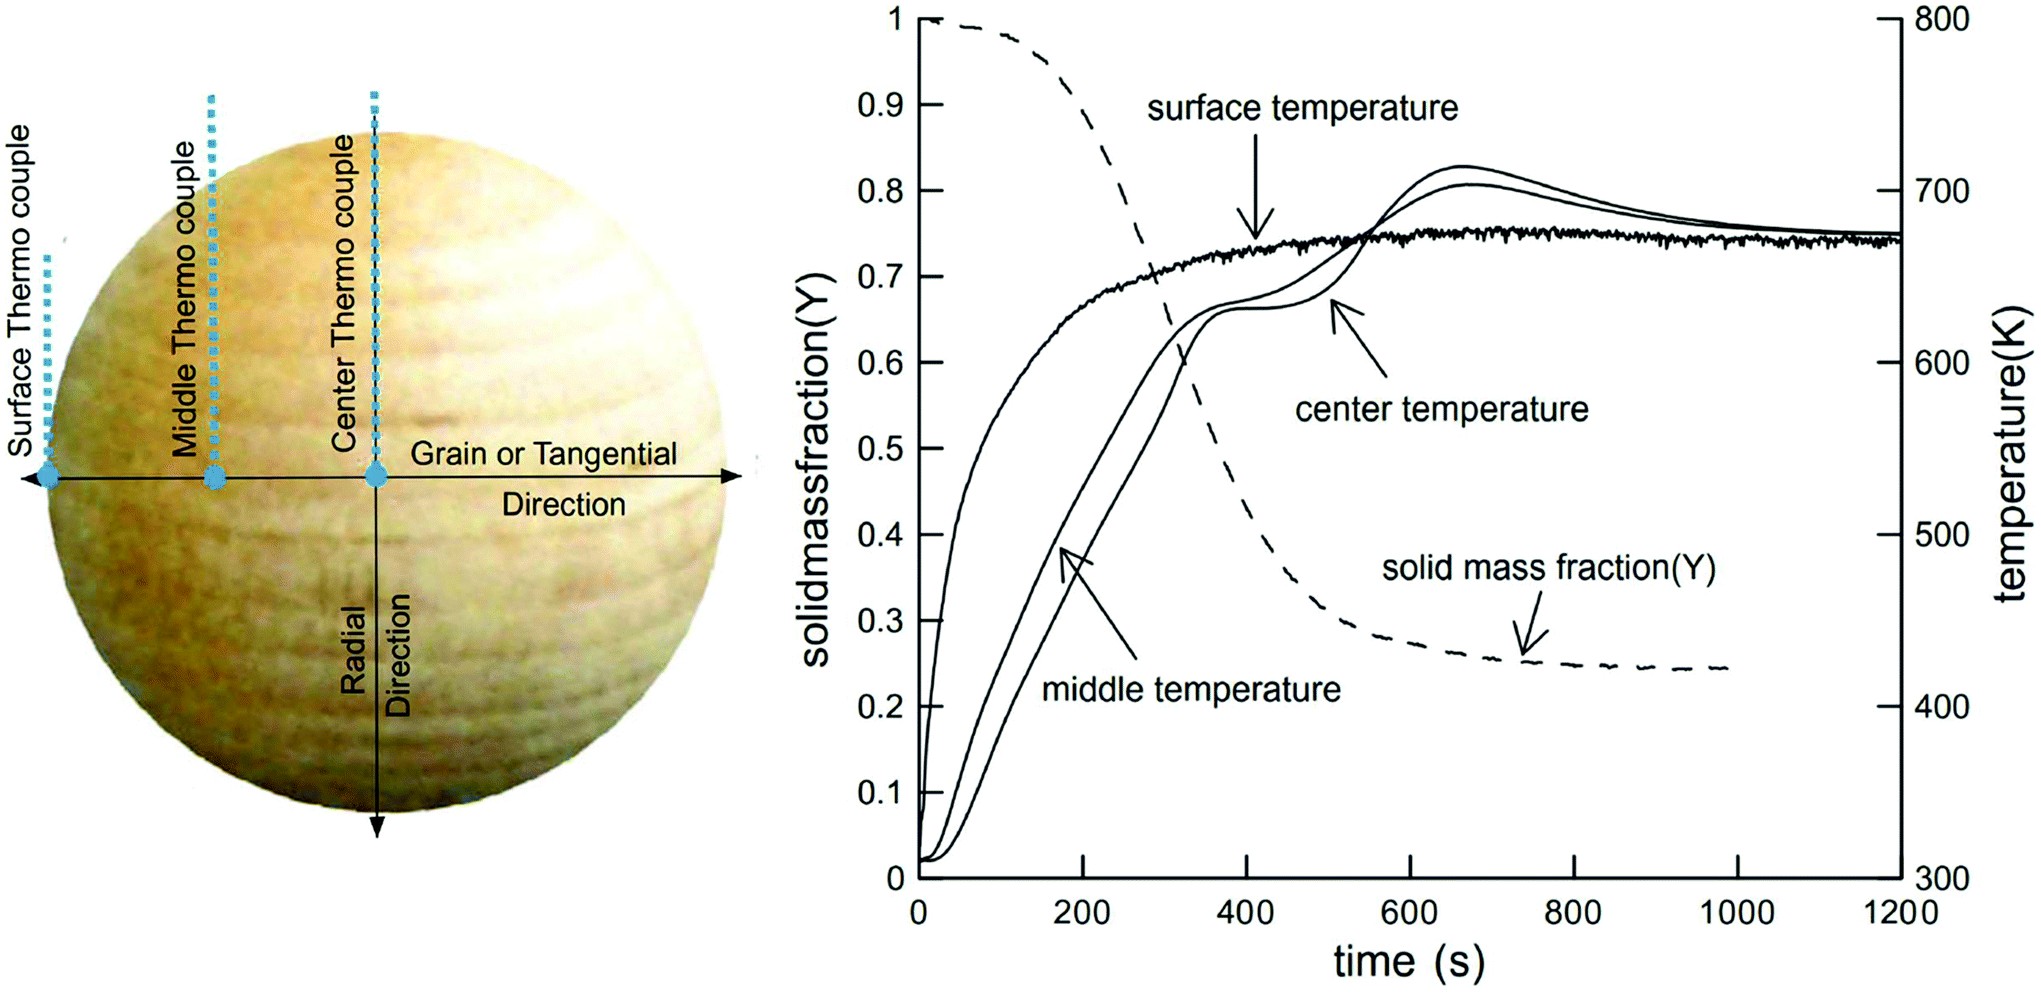 | ||
| Fig. 4 Solid mass fraction and temperature of wood sphere pyrolysis at 688 K. Reprinted from Park et al.,111 Copyright (2010), with permission from Elsevier. | ||
The effect of temperature on bio-oil production is well understood and has been explored in the literature. It has been shown that there is a parabolic behavior for bio-oil production with temperature wherein the maximum bio-oil yield is obtained with reactor temperatures between 400 and 550 °C, depending on the type and size of biomass and heat transfer mechanism.10,36,80,97–100 The maximum yields of lignin-derived oligomers has been reported between 450 and 500 °C;101 this reflects the balance between primary reactions, which release oligomeric products from biomass, and secondary reactions which degrade these products into monomers and eventually small organics and gas above 500 °C.102
As temperature increases, there is less char. However, at higher temperatures above 500 °C, volatile cracking reactions reduce the yield of bio-oil and increase the production of non-condensable gases.103–106 Due to this phenomenon, many studies show that maximum production of bio-oil in systems with good heat transfer and small particles is achieved 450 °C, with yields of up to 80% for cellulose but more commonly 60% for wood.107–110
The composition of the resultant oil also changes with temperature.112 At low temperatures (<300 °C), most volatiles originate from hemicellulose degradation and the scission of weak cellulose linkages, with the main products levoglucosan, levoglucosenone, hydroxymethyl furfural, acetic acid, acetone, guiacyl acetone, glyoxal, methanol and formic acid. Fu et al.113 demonstrated the formation of short chain vapors and gases, including: formic acid, methanol, ethane, ethylene, formaldehyde, acetone, hydrogen cyanide, carbon monoxide and carbon dioxide, during pyrolysis of cotton stalk, corn and rice, at a temperature range of 300–400 °C. At temperatures above 400 °C, intact rings such as benzene, carboxylic acids, phenols, p-cresol, furans, furfural, and sugars are the most abundant species.36 As the temperature increases further, the yield of these volatile compounds decreases and the yield of more thermally stable polyhydroxyl aromatic compounds (PHA) increases. Between 580–800 °C, new aromatic compounds such as benzene, naphthalene, cresol, and toluene can be formed.37,83,114 Chaiwat et al.115 proposed a set of competitive reactions in cellulose depolymerization and dehydration, as shown in Fig. 5. At low temperatures and low heating rates, strong intra-chain hydrogen bonds of cellulose functional groups, increasing the probability of dehydration reactions. At high heating rates, intra-chain hydrogen bonds weaken and decrease the possibility of collisions that facilitate dehydration reactions.116
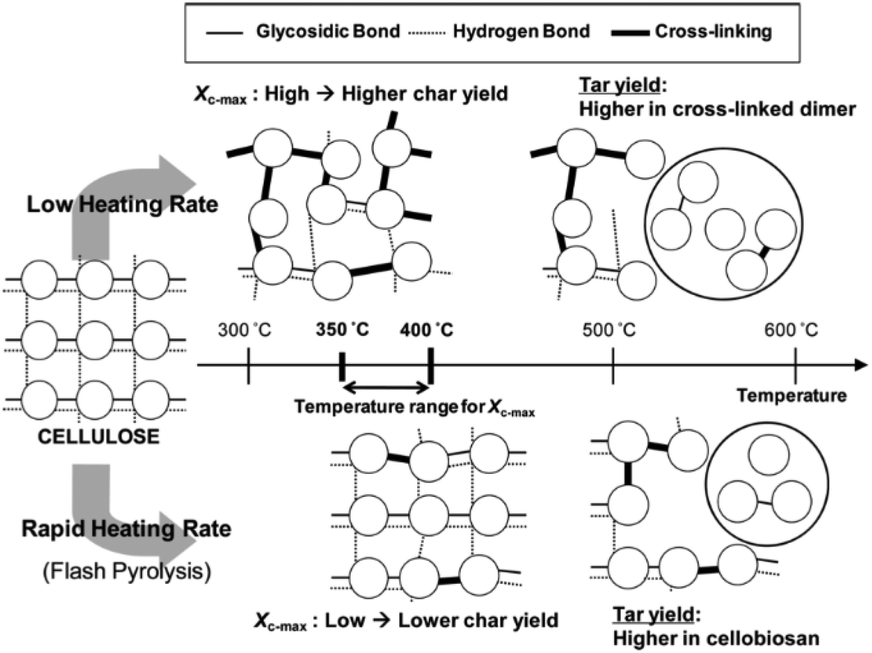 | ||
| Fig. 5 Effect of the heating rate on the mechanism of thermal decomposition of the cellulose. Reprinted (adapted) with permission; Chaiwat et al.115 Copyright (2009) American Chemical Society. | ||
Lignin oligomers are lignin derived compounds with two or more aromatic rings, with molecular weight greater than 180 g mol−1. Garcia-Perez et al.101 found that that the lignin oligomer yields increase with temperature until 500 °C. At temperatures higher than 500 °C, decomposition reactions for aerosols, which contain these oligomers, become more intense, generating secondary lower molecular weight volatiles. Westerhof et al.100 reported an increase in lignin oligomer yields between 380–480 °C for pine pyrolysis, attributing this behavior to increased biomass conversion. Above 480 °C, oligomer yields decreased presumably due to secondary vapor cracking reactions.117 It is also thought that the particle size reduces the yield of large compounds like lignin oligomers due to mass transfer issues. In one recent publication, the yield of pyrolytic lignin increased as particle size decreased; the authors hypothesized that this is due to collision of aerosol droplets with the cell walls after they are ejected,118 as will be discussed in the next subsection.
Despite the wide assortment of studies conducted to evaluate the effect of temperature on the yield of char, bio-oil and non-condensable gases, there is ambiguity in the definition of the optimum temperature of pyrolysis. It is not typically possible to directly measure the temperature of very small biomass particles, and so it is often assumed to be equal to the reactor temperature84,85 or in some cases is estimated by mathematical modelling,86,119 with some exceptions when using large particles, as illustrated in Fig. 4.111 For slow pyrolysis conditions utilizing small particle sizes (less than 1 mm), the assumption that the biomass particle temperature is equal to the reactor temperature is valid due to longer heating times, which allows thermal equilibrium between the biomass particles and surroundings to be achieved.89,104 However, these assumptions are often far from reality for fast pyrolysis conditions, resulting in mismatches (“thermal lag”) of temperatures of 100 °C or more. This thermal lag causes errors in estimating the actual particle temperature, which can result in over-estimates of kinetic parameters such as the activation energy and the coefficient of the reaction rate.104,105
There are many reports in the literature that point out the importance of heating rate effects on bio-oil and char yields. Onay et al.120 studied the fast pyrolysis of safflower seeds at heating rates of 100, 300 and 800 °C min−1. Results showed that above 300 °C min−1, maximum yields of bio-oil (55%) and char (17%) were achieved. Thangalazhy-Gopakumar et al.121 pyrolyzed pine and grass fodder at reactor heating rates of 50, 100, 500, 1000, 2000 °C s−1 and did not find an impact of heating rate due to slow heat transfer into the biomass. This highlights the importance of accurately measuring temperature in basic studies.122
As with temperature, the heating rate plays an important role on the quality of bio-oil and char structure obtained. Bio-oils can be obtained with lower moisture content at higher heating rates, primarily due to the inhibition of secondary volatile dehydration and cracking reactions.123 Higher heating rates also reduce the formation of the water-soluble fractions (formic acid, methanol, acetic acid) and aromatic fractions (rich in phenol and its derivatives). In contrast, CO and CO2 yield increase with higher heating rates.69 Ketones, levoglucosan, phenol and toluene yields also increase with heating rate for the fast pyrolysis of pine wood and grasses when heating rates exceed 50 °C s−1.
Chemical reaction schemes to describe the effect of temperature and composition
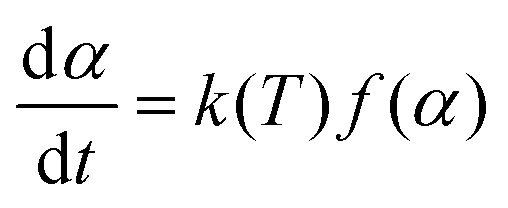
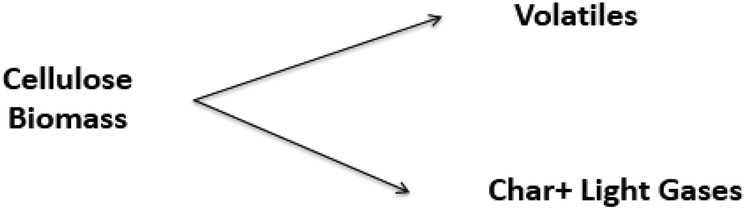
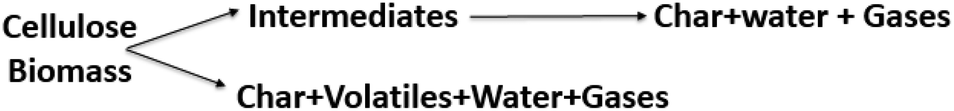
Due to the complex physicochemical nature of biomass pyrolysis, there are a wide array of reaction mechanisms and products associated with thermal decomposition. The search for these reaction mechanisms is a developing science; new results are frequently published, with sophisticated experimental equipment, new analytical techniques, and computational tools to elucidate the evolution of species and thereby kinetics of devolatilization processes. The reaction mechanisms and rate expressions are the heart of the analysis of pyrolysis processes.23,122 Most models are lumped schemes with global products obtained from biomass (total volatiles, total light gases, char) and simultaneous multi-stage and/or competitive reactions. These models can be classified under the following categories: global models in a single step, global models in multiple steps, semi-global models, and models focused on the formation of volatile species.| Biomass → Char + Volatiles | (1) |
The expressions for the reaction rate are represented as a function of temperature and biomass conversion (see eqn (2) and (3)) according to the mathematical expressions:
 | (2) |
 | (3) |
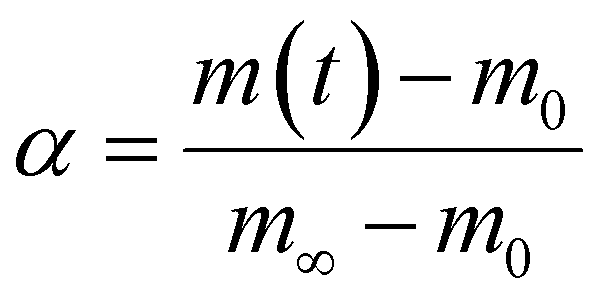
And where dα/dt represents the rate of decomposition of biomass, t represents the reaction time, α represents the biomass conversion, T represents the temperature of the sample, f(α) represents the expression for the conversion function, m(t) represents the weight of biomass at a given time t. For non-isothermal systems such as thermogravimetric processes, the mathematical expression of the reaction rate may be expressed as a function of temperature such that the reaction rate can be expressed as:
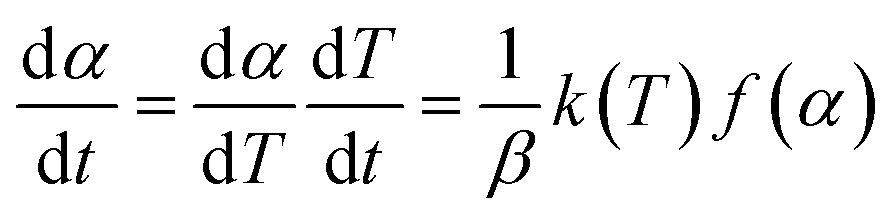 | (4) |
Grønli,125 Orfão,124 Várhegyi,126,127 Antal,128 and others have extensively used this reaction scheme, which can accurately represent the thermogravimetric curves without byzantine data-fitting algorithms. However, because of the simplicity of the physical model used, this type of model does not allow prediction of the individual species generated in devolatilization. The reaction rate is monitored by following the change in the weight of the solid residue with time, which is usually done using a thermobalance; this limits most knowledge to slow-heating conditions which are not comprehensive enough to represent fast pyrolysis processes.129


Models 3, 4, 5, and 10 have the novel inclusion of an intermediate plastic/liquid phase.87 The presence of this phase explains the “Lag” in biomass mass loss at temperatures below 320 °C when evaluating the experimental results obtained by thermobalance.134,135 These schemes have been widely used by many researchers studying biomass slow and fast pyrolysis.131,133,136 Alexander67 compared five different reaction schemes for slow and fast pyrolysis of Loblolly pine and found that the kinetic parameters obtained using low and high heating rates are distinct and not interchangeable; i.e. kinetic parameters obtained at low heating rates (5–20 K min−1) do not explain behavior at high rates heating (400 °C s−1). These results corroborate those presented by Milosavljevic.129
Di Blasi135 presented the results of a comparative study of most models presented in Table 1 (models 1, 3, 4, 6, 8) for cellulose and biomass slow pyrolysis at heating rates of between 20 and 50 K min−1 at a temperature range between 550 and 1000 K. The primary findings of this study were:
• For cellulose, all schemes have the same trend: volatile species and char increase and non-condensable gases decrease with higher heating rate and temperature.
• Models 1 and 3 predict similar volatile yields, while model 4 under predicts volatile yields.
• For biomass, from the qualitative point of view, there are large differences in data trends, especially in the yield of non-condensable gases.
• Models 6 and 8 predict that char yield remained constant as the heating rate increases from 40 to 160 K min−1. The authors suggest that at high temperatures, the reaction is thermally controlled, and no kinetic control exists. The primary reactions responsible for the formation of condensable volatile compounds are strongly endothermic, with part of the energy supplied to the reaction used to evaporate the tar condensate (liquid phase within the biomass), cooling the particle as the vapors escape.
All kinetic models obtained for both cellulose and biomass, were developed using data collected under different particle sizes and temperature ranges and different process equipment, including fluidized bed, fixed-bed thermobalance, and pyroprobe reactors. This means that there is subjectivity in each model since, in some, kinetic control could exist and not others, or the experimental conditions are tightly controlled by some teams, minimizing the risk of uncontrolled secondary effects.
In summary, the study of the reaction rate expressions within these models is based on monitoring global yields, such as the total weight of the solid residue char (char + unprocessed biomass + liquid phase), total volatiles (obtained by condensing the total gas), and light, non-condensable gases (gas chromatography). These models do not predict the evolution of species released during devolatilization, and many of them contain high degrees of freedom for the estimate the kinetic parameters (more variables than experimental data), which limits there predictive utility for systems and feedstocks other than those from which they were obtained. This topic has been reviewed elsewhere in the literature.68,147
 | (5) |
Yang et al.148 found that synthetic biomass pyrolysis can be explained as the sum of the decomposition of each component separately and that this behavior is similar that of real biomass. Rao et al.150 proposed a kinetic model of order n to assess the behavior of cellulose, hazel, wood, rice husks and olive husk under slow pyrolysis conditions (20 K min−1), using predefined kinetics parameters for cellulose, hemicellulose and lignin, finding good comparison between the model and experiments. Oyedun et al.153 adopted a two-stage model (model 7 Table 1) to explain the behavior of each biomass component during bamboo pyrolysis. The results showed that this model represented the experimental data well. The activation energy obtained varied from 33 to 144 kJ mol−1 for the formation of volatiles and 60–91 kJ mol−1 for the formation of char for each component.
Hosoya et al.40 concluded that cellulose–hemicellulose interactions are negligible but that interactions between cellulose and lignin enhanced the formation of guaiacol, 4-methyl-guaiacol, 4-vinyl-guaiacol, and light gases such as CO and CO2 while decreasing the formation of char. Couhert et al.43 obtained similar results, concluding that it is not possible to represent the behavior of a biomass as the sum of components. The authors suggest that the type of contact between constituents is very important in raw biomass, since there are components that are inter-linked by covalent and non-covalent intermolecular forces that hold them together. The complex arrangement of biopolymers and their interactions established during biosynthesis are not adequately represented by a simple mixing components, but may reflect general degradation patterns during thermal devolatilization.
Williams67 concluded that a two-component two-stage model (model 7, Table 1) is not a suitable representation for loblolly pine pyrolysis. As mentioned in the previous section, there is uncertainty regarding the use of additive laws to represent the behavior of whole biomass from its components because of arguments regarding the arrangement and potential interaction of each component in raw biomass. In most of these models, only global components such as total volatiles, char, and light gases are used to describe the evolution of species or of the condensed intermediate phase. Experiments used to develop such models are usually restricted to the use of a thermobalance to measure the experimental conditions. The next subsection describes kinetic schemes developed with chemical speciation.
| Reaction | A [s−1] | E [kJ mol−1] | Δh [kJ g−1] | |
|---|---|---|---|---|
| Cellulose scheme | ||||
| 1 | CELL → CELLA | 188.37 | 0.0 | |
| 2 | CELLA → (1 − xCELL) × (0.45 HAA + 0.2 GLYOX + 0.3 C3H6O + 0.25 HMFU + 0.05 H2 + 0.31 CO + 0.41 CO2 + 0.4 CH2O + 0.15 CH3OH + 0.1 CH3CHO + 0.83 H2O + 0.02 HCOOH + 0.05 G{H2} + 0.2 G{CH4} + 0.61 Char) + xCELL × (5.5 Char + 4 H2O + 0.5 CO2 + H2) | 4 × 10¹³ | 80.0 | 0.56 (1 − xCELL) − 1.47xCELL |
| 3 | CELLA → (1 − xCELL) × (LVG/same products as R2) + xCELL × (5.5 Char + 4 H2O + 0.5 CO2 + H2) | 2 × 10⁶ | 41.86 | 0.53 (1 − xCELL) − 1.47xCELL |
| Hemicellulose scheme | ||||
| 4 | HCE → 0.4 AA (HW)/0.1 AA (SW) + 0.58 HCEA1 + 0.42 HCEA2 | 1 × 10¹⁰ | 129.77 | 0.0 |
| 5 | HCEA1 → (1 − xHCE) × (0.5 CO + 0.5 CO2 + 0.325 CH4 + 0.8 CH2O + 0.1 CH3OH + 0.25 C2H4 + 0.125 ETOH + 0.025 H2O + 0.025 HCOOH + 0.275 G{CO2} + 0.4 G{COH2} + 0.125 G{H2} + 0.45 {CH3OH} + 0.875 Char) + xHCE × (4.5 Char + 3 H2O + 0.5 CO2 + H2) | 1.2 × 10⁹ | 125.58 | 0.25 (1 − xHCE) − 1.42xHCE |
| 6 | HCEA1 → (1 − xHCE) × (0.1 CO + 0.8 CO2 + 0.3 CH2O + 0.25 H2O + 0.05 HCOOH + 0.15 G{CO2} + 0.15 G{CO} + 1.2 G{COH2} + 0.2 G{H2} + 0.625 G{CH4} + 0.375 G{C2H4} + 0.875 Char) + xHCE × (4.5 Char + 3 H2O + 0.5 CO2 + H2) | 0.15 × T | 33.5 | −0.64 (1 − xHCE) − 1.42xHCE |
| 7 | HCEA1 → (1 − xHCE) × (XYL/same as R6) + xHCE × (4.5 Char + 3 H2O + 0.5 CO2 + H2) | 3 × T | 46.05 | 0.77 (1 − xHCE) − 1.42xHCE |
| 8 | HCEA2 → (1 − xHCE) × (0.2 HAA + 0.175 CO + 0.275 CO2 + 0.5 CH2O + 0.1 ETOH + 0.2 H2O + 0.025 HCOOH + 0.4 G{CO2} + 0.925 G{COH2} + 0.25 G{CH4} + 0.3 G{CH3OH} + 0.275 G{C2H4} + Char) + xHCE × (4.5 Char + 3 H2O + 0.5 CO2 + H2) | 0.5 × 10¹⁰ | 138.14 | −0.14 (1 − xHCE) − 1.42xHCE |
| Lignin scheme | ||||
| 9 | LIG-C → 0.35 LIG-CC + 0.1 pCOUMARYL + 0.08 PHENOL + 0.32 CO + 0.3 CH2O + H2O + 0.7 G{COH2} + 0.495 G{CH4} + 0.41 G{C2H4} + 5.735 Char | 1.33 × 10¹⁵ | 203.02 | −0.47 |
| 10 | LIG-H → LIG-OH + 0.25 HAA + 0.5 C3H6O + 0.5 G{C2H4} | 0.67 × 10¹³ | 156.97 | 0.10 |
| 11 | LIG-O → LIG-OH + CO2 | 0.33 × 10⁹ | 106.74 | −0.21 |
| 12 | LIG-CC → (1 − xLIG) × (0.35 HAA + 0.3 pCOUMARYL + 0.2 PHENOL + 0.4 CO + 0.65 CH4 + 0.6 C2H4 + 0.7 H2O + 0.4 G{CO} + G{COH2} + 6.75 Char) + xLIG × (15 Char + 4 H2O + 3 H2) | 3 × 10⁷ | 131.86 | −0.09 (1 − xLIG) − 1.30xLIG |
| 13 | LIG-OH → LIG + 0.55 CO + 0.05 CO2 + 0.1 CH4 + 0.6 CH3OH + 0.9 H2O + 0.05 HCOOH + 0.6 G{CO} + 0.85 G{COH2} + 0.1 G{H2} + 0.35 {CH4} + 0.3 G{CH3OH} + 0.2 G{C2H4} + 4.15 Char | 1 × 10⁸ | 125.58 | −0.17 |
| 14 | LIG → (1 − xLIG) × FE2MACR + xLIG × (10.5 Char + 3 H2O + 0.5 CO2 + 3 H2) | 4 × T | 50.2 | 0.95 (1 − xLIG) − 1.52xLIG |
| 15 | LIG → (1 − xLIG) × (0.2 C3H6O + CO + 0.2 CH4 + 0.2 CH2O + 0.4 CH3OH + 0.2 CH3CHO + 0.95 H2O + 0.05 HCOOH + 0.45 G{CO} + 0.5 G{COH2} + 0.4 {CH4} + 0.65 G{C2H4} + 5.5 Char) + xLIG × (10.5 Char + 3 H2O + 0.5 CO2 + 3 H2) | 0.4 × 10⁹ | 125.58 | −0.35 (1 − xLIG) − 1.52xLIG |
| 16 | LIG → (1 − xLIG) × (0.4 CO + 0.2 CH4 + 0.4 CH2O + 0.6 H2O + 0.2 G{CO} + 2 G{COH2} + 0.4 {CH4} + 0.4 G{CH3OH} + 0.5 G{C2H4} + 6 Char) + xLIG × (10.5 Char + 3 H2O + 0.5 CO2 + 3 H2) | 0.083 × T | 33.5 | −0.50 (1 − xLIG) − 1.52xLIG |
| Trapped gas scheme | ||||
| 17 | G{CO2} → CO2 | 1 × 10⁵ | 100.46 | 0.0 |
| 18 | G{CO} → (1 − xG{}) × CO + xG{} × (0.5 Char + 0.5 CO2) | 3 × 10¹³ | 209.3 | −3.08xG{} |
| 19 | G{COH2} → 0.75G2{COH2} + 0.25 (H2 + 0.5 CO + 0.25 CO2 + 0.25 Char) | 1 × 10⁶ | 100.46 | 0.31 |
| 20 | G{H2} → H2 | 1 × 10¹² | 313.96 | 0.0 |
| 21 | G{CH4} → CH4 | 2 × 10¹³ | 300.0 | 0.01 |
| 22 | G{CH3OH} → (1 − xG{}) × CH3OH + xG{} × (Char + H2O + H2) | 1.2 × 10¹³ | 209.3 | −1.27xG{} |
| 23 | G{C2H4} → 0.3 C2H4 + 0.7 (CH4 + Char) | 1 × 10⁶ | 100.46 | 0.46 |
| 24 | G2{COH2} → 0.2 G3{COH2} + 0.8 (CO + H2) | 1.5 × 10⁹ | 209.3 | 0.0 |
| Extractives scheme | ||||
| 25 | TANN → FENOL + ITANN | 50 | 46.02 | |
| 26 | ITANN → 5CHAR + 3CO + GCOH2 + 2H2O | 6100 | 25.52 | |
| 27 | TGL → acrolein + 3FFA | 7 × 10¹² | 191.2 | |
| Reaction parameters | Low charring | High charring | ||
| X_CELL | 0.025 | 0.1 | ||
| X_HCE | 0.05 | 0.2 | ||
| X_LIG | 0.1 | 0.4 | ||
| X_G{} | 0.1 | 0.4 | ||
| Sugar formation in R3 and R8 | Yes | No | ||
Liao et al.159 created a modified Broido-Shafizadeh model that considers the evolution of levoglucosan, acetol, 5-HMF, HAA, CO, CO2, H2, H2O, and furfural. Although the model includes the formation of an intermediate phase (activated cellulose), this phase is not directly monitored but is fit implicitly from experimental data. Other similar schemes may be found the literature.160,161 Vinu et al.155 developed a microkinetic model for pyrolysis of glucose-based carbohydrates. The scheme is rigorous, involving 41 elementary reactions, including depolymerization, cracking, drying, aldol condensation, and tautomerization reactions among others. This model describes the step by step the evolution of the primary volatile condensable and non-condensable gases, as well as the evolution of char and intermediate anhydrosugars. Yanez et al.162 recently published a detailed lignin pyrolysis microkinetic model based on advanced lignin modelling that has 1615 species and 4313 reactions.
Some commercial packages have also been developed to explain the evolution of species during biomass devolatilization. However these models remain “black boxes” which do not disclose the underlying theory and formulation of their implementation: Prime Kinetics Model (Reaction Network), Bio-Flashing,163 Bio-FG-VDC (Functional Group-Depolymerization-Volatilization-Crosslinking).
Usually in the study of the effect of heating rate on the overall yield of volatiles, char and non-condensable gases, there are very few models that extend to the study of individual chemical species of both condensable and non-condensable gases.177 To achieve this level of detail in the analysis of product species, integral kinetic modes, such as the one given in eqn (6) are employed. The main advantage of this model is that it covers a wide range of experimental conditions, including temperatures and heating rates, and can represent slow and fast heating kinetics in one kinetics scheme. The activation energy distribution can be represented by continuous functions as normal, lognormal and Weibull distributions.
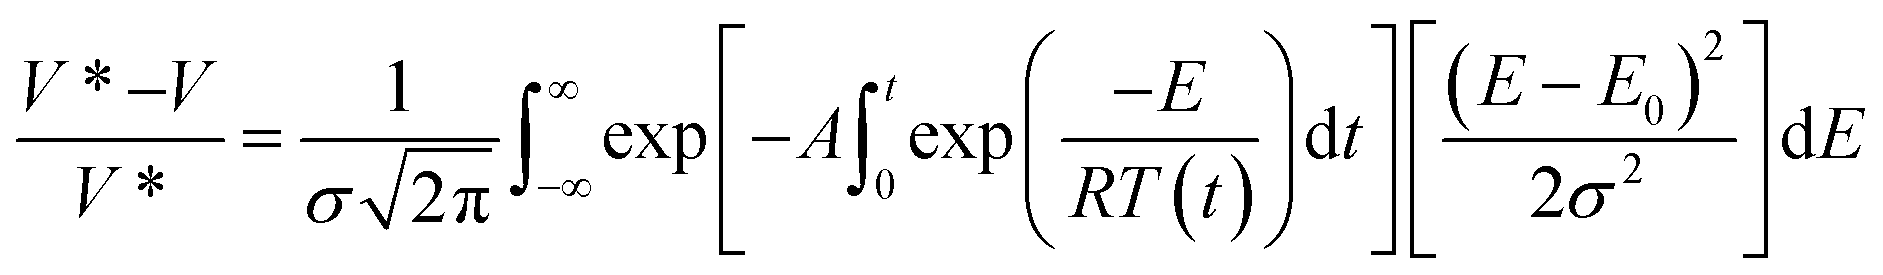 | (6) |
Here V* and V represent the maximum amount of volatile or individual species in the gas or vapor phase at a given time t, A is the rate constant, E is the activation energy, σ is the variance and E0 is the mean of the statistical distribution of activation energies. The kinetic parameters can be obtained by regression methods using numerical methods to solve the exponential integral170,174,178 or with differential methods as proposed by Miura, et al.179,180 This type of model is becoming widely recognized as the most accurate available to correlate the experimental data from biomass pyrolysis. These models avoid underestimating the activation energy compared to single stage reaction schemes, but the most striking feature of this scheme is that a mathematical model is derived that is applicable at various heating rates, unlike either single or multi stage that only apply to a single heating rate.181 The difficulty with this technique is that the right side integral has no analytic solution, so approximations or numerical methods must be used to obtain a solution.
Secondary reactions
Secondary reactions convert primary products into char and gas. These reactions can occur in the gas phase of the reactor, or inside the particle if transport out of the particle is slow. Several types of intraparticle secondary reactions have been described, including reactions of condensable volatiles at the gas/liquid interface,57 reactions of condensable volatile in the liquid phase182–184 (polymerization, crosslinking, dehydration) and reactions of gases and condensable volatiles with the mineral matter in char.185,186 The Ranzi scheme discussed above has secondary reactions in the scheme.78,79,158The most studied reactions are thermal decomposition, or cracking, reactions that occur in the gas phase and solid–gas phase reactions including gasification, combustion, and oxidation.187–190 Cracking reactions are important at high temperatures (T > 500 °C) and are more prominent when long residence time in the hot zones exist.188,191,192 Numerous studies related to solid–gas secondary reactions have also been reported.189,193–196 These reactions have been studied at an experimental level, and have been measured by increases in char production and decreases in volatiles caused by an increase in the time of solid–gas contact.
Several studies conducted at both the experimental and theoretical level, have reported the reactions responsible for the thermal decomposition of volatiles. Hayashi et al.188 reports a rigorous theoretical and experimental study of volatile cracking reactions released from biomass fast pyrolysis. The model predicted with good accuracy the behavior of light gases (CO, CO2, H2, CH4, C2H4), but provided less accurate predictions for furanic compounds as well as benzene, toluene, acetic acid, aldehyde, methanol. Shin et al.197 proposed a 3 stage kinetic model for the decomposition of volatiles produced from cellulose, levoglucosan and 5-HMF pyrolysis. They found that in 0.6 seconds at 750 °C, 80% of the volatiles generated in during pyrolysis decompose. Further experimental studies at fast pyrolysis conditions were carried out by Morf et al.,192 Graham et al.,198 and Zhang et al.199 Each evaluated char, total volatiles, condensable species and light gases yields as a function of temperature and gas residence time in two stage reactors. In these studies, it was found that the maximum decomposition rate was achieved at a temperature range of between 600–700 °C. The poly-hydroxy-aromatic (PHA) formation is another interesting secondary reaction that results primarily from the volatile aromatic derivatives of lignin. Investigations have shown that these reactions are favored at very high temperatures (>800 °C) and long residence times (>10 s),199,200 which are typical operational conditions for gasification and combustion processes.
Another set of solid–gas and gas phase secondary reactions are related to char gasification with steam or CO2. These reactions include char oxidation, the Boudouard reaction, reforming reactions, water gas-shift reactions and methanation, which have been widely explored, in biomass and coal gasification and combustion processes.72,201,202
The liquid–gas and liquid–liquid phase reactions that occur during biomass pyrolysis are largely unexplored with no theoretical models to report. This is primarily due to uncertainty regarding the components present in the liquid phase and the difficulties associated with monitoring these species during pyrolysis. Understanding of the liquid phase reaction is one of the main challenges to be addressed in order to better elucidate of the reactivity of biomass during the pyrolysis process.122 Despite this lack of knowledge, it is know that reactions in the liquid phase are the primary contributors to the production of secondary char, light oxygenated compounds and permanent gases.132,182
Paulsen203 looked at the reactivity of mixtures of levoglucosan/fructose to simulate the environment and interactions inside the intermediate liquid phase formed during cellulose fast pyrolysis. Cyclization and elimination reactions were found to be responsible for the production of light oxygenated compounds and char. Both reactions are more intense in the pyrolysis of powders than for thin films. Furthermore, the author suggested that catalysts, such as palladium, promote decarbonylation reactions in the liquid phase, reducing aldehydic furans and improving the bio-oil quality (less oxygen content in bio-oil). Bai et al.204 suggested a competitive mechanism between levoglucosan evaporation and polymerization during cellulose pyrolysis in TGA. The intensity of both reactions depends on the quantity of sample, the carrier gas flow rate, and the heating rate. They show that low sample quantities and high carrier gas flow promote evaporation due to lower mass transfer resistance. Similar mechanisms were proposed by Hosoya et al.205 for levoglucosan pyrolysis in an ampoule reactor. Other important reactions in the liquid phase are related to the decomposition of lignin oligomers to produce monomers, char and permanent gases. However, there are few studies focused on the pyrolysis of lignin oligomers, and none relating experimental results using kinetic parameters. It has been suggested that these compounds are generated by thermal ejection caused by intense bubbling of the liquid intermediates.117,206,207 These aerosols can be trapped inside the solid matrix after ejection and the collision probability will increase with particle size.106,207,208
Heat transfer
Effect of particle size and pore structure on heat transfer
Biomass from any source is a poor conductor of heat, with a thermal conductivity on the order of 0.1 W m−1 K−1 which promotes formation significant temperature gradients within particles when subjected to rapid heating. Temperature gradients are strongly influenced by particle size and shape, and are typically anisotropic due to the direction microstructure of biomass and the aspherical shape typical of milled particles, as illustrated in Fig. 6.209–211 The primary purpose of milling biomass before pyrolysis is to enhance heat transfer. In an industrial or pilot scale process, the cost of this milling may be a significant operating expense, so it is critical to find the “sweet spot” that maximizes yield and minimizes reactor cost. Bridgwater et al.69 presented specifications for particle sizes to be used with each of the major technologies available. For example: particle sizes less than 6 mm are well suited for fluidized bed reactor and circulating bed designs, and up to 10 cm are suitable for ablative rotary disc processes.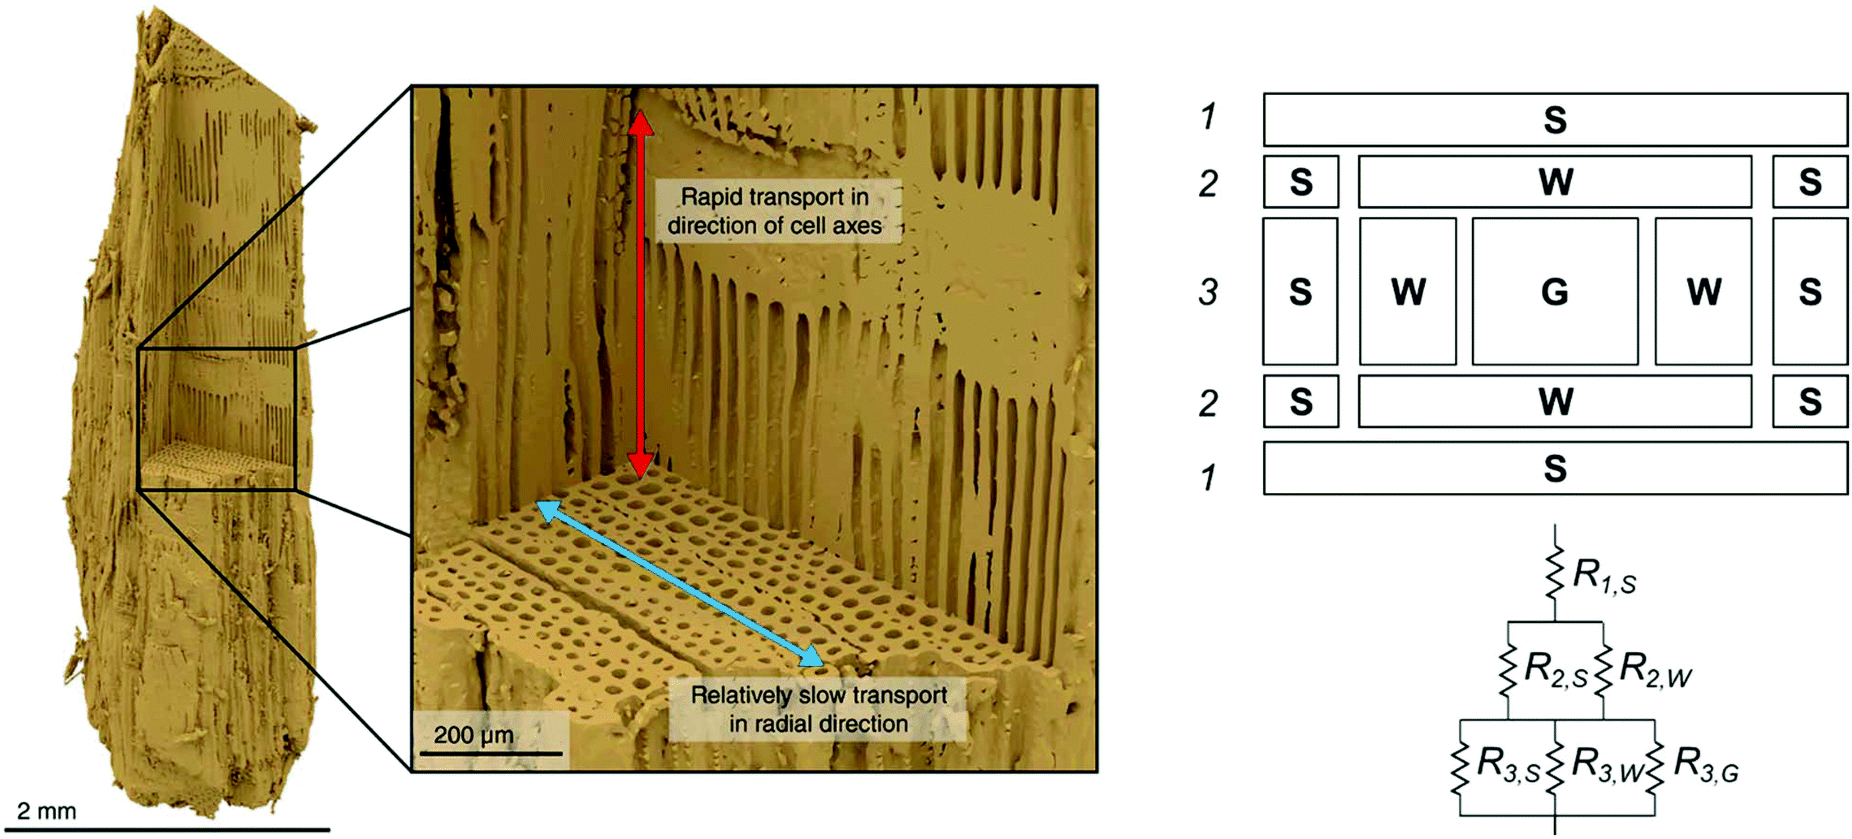 | ||
| Fig. 6 (Left) A visual reconstruction of the softwood fiber structure of pine based on X-ray tomography data26 illustrates that heat and mass both move more readily in the direction of cell axes than in radial direction and (right) heat flux resistance pathways for wood, depending on the direction of the flux.212 Left image reprinted (adapted) with permission from Ciesielski et al.26 Copyright (2018) Wiley. | ||
The shape and hierarchical pore structure also impact the heat and mass transfer properties of wood. Ciesielski et al.93 have shown, for example, that spherical representations of realistic biomass feedstocks fail to accurately capture the thermal gradients in a particle, though some effort has also been made to employ develop low-order mathematical approximations in spherical models to make them more accurate.213 Pecha et al. have further illustrated that the pore structure between even pine and poplar wood makes for differences in the external heat transfer coefficients.214 Thunman and Leckner212 developed a model for thermal conductivity in wood based on the pore structure for perpendicular and parallel directions relative to the fibers in the wood, as well as density and moisture content. Conductivity parallel to the fiber was found to be approximately twice (e.g. 0.4 W m−1 K−1) the conductivity in perpendicular direction (0.2 W m−1 K−1). Some unique models for approximating the resistance of cell walls have been developed (see Fig. 6).212
Several dimensionless numbers have been developed for examining heat transfer in pyrolysis of biomass particles. The Biot number compares external and internal heat transfer rates:
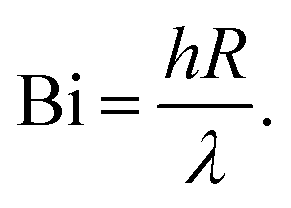 | (7) |
Pyrolysis number 1 compares internal heat transfer rate and reaction rate,
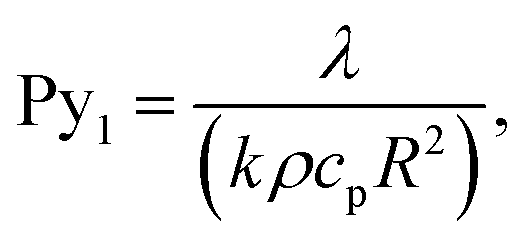 | (8) |
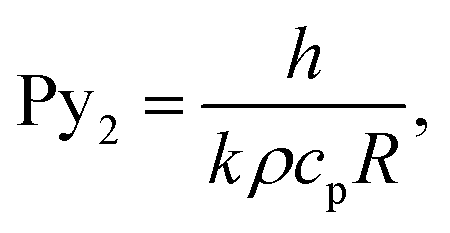 | (9) |
Pyle and Zaror authored a seminal paper describing various regimes in which one phenomenon controls the effective rate of pyrolysis, as shown in Table 3.215 If the particle is large enough that Biot number is greater than 10 and the Py1 is less than 1, the heating is limited by internal thermal conduction. Hence, heating rate of the reactor in some respects is less important than particle size.216–218 Dauenhauer's group extended this analysis into a pyrolysis transport map as shown in Fig. 7.48,122
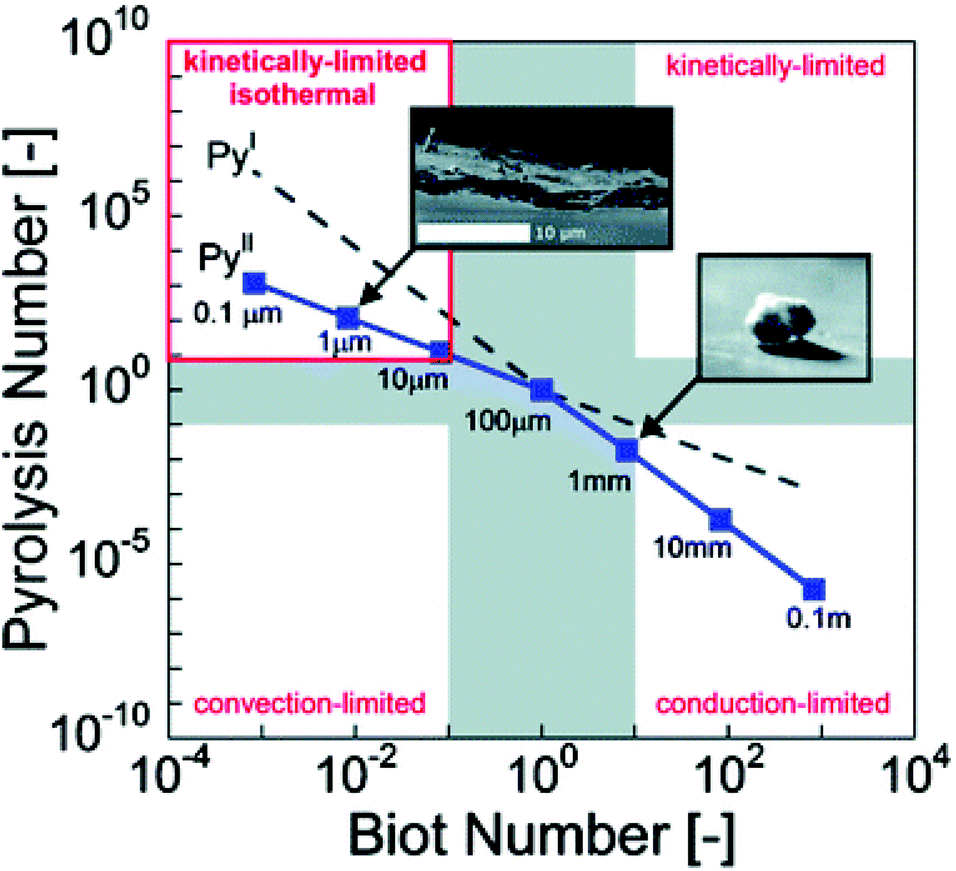 | ||
| Fig. 7 Pyrolysis transport map. Relative rates of biomass reaction and heat transfer by conduction or convection at 500 °C are compared in terms of Pyrolysis number and Biot number; four pyrolysis regimes are identified (clockwise from top left): isothermal and reaction limited, reaction-limited, conduction-limited, and convection-limited.122 Republished with permission of the Royal Society of Chemistry, Mettler et al.;122 permission conveyed through Copyright Clearance Center, Inc. | ||
| Approximate range of validity | |||
|---|---|---|---|
| Model | Bi | Py1 | Py2 |
| I: Non-controlled conditions | All | All | All |
| II: External heat transfer controlled | <1 | >1 | >1 |
| III: Kinetics controlled | <1 | >10 | >10 |
| IV: Internal heat transfer controlled | >50 | <10−3 | ≪1 |
In micro-reactors at pyrolysis temperatures, conductive and convective heat transfer account for 90% of the heat flux, while radiation accounts for less than 10% of the total heat transfer.219 However, in larger wall-heated reactors it is well-known that radiative heat transfer can account for a significant portion of the total heat transfer and can be modeled using the Stefan–Boltzmann law.220 For more accurate use of the dimensionless numbers described above total surface heat transfer may be accounted for in a lumped heat transfer coefficient comprised of the sum of the convective and radiative heat transfer coefficients.221
Although heating rate is a critical factor to define the conditions of fast pyrolysis, it cannot typically be measured experimentally; it is instead estimated with theoretical models or by using engineering approaches to minimize the thermal thickness, like using a thin film.222 Often, these parameters are subjective and depend strongly on the pyrolysis system, measurement equipment, model assumptions, and experimental conditions (see Table 4). This makes it difficult to compare experimental results obtained for global yields and kinetic parameters published in scientific papers. There is ambiguity in determining the correct heating rate from values reported in publications. In most cases, heating rate is reported as being the programmed rate for heating elements (electrical resistance, radiation lamp, hot plate), rather than a particle heating rate.
| Reactor | T (°C) | HR (°C s−1) | Time (s) | P (atm) | Sample | Remarks |
|---|---|---|---|---|---|---|
| HR: heating rate, Vac: vacuum, P: pressure. | ||||||
| Drop tube | 1500 | 104–105 | 4 | Vac – 69 | Powder | High heating rates. It is not possible to measure particle temperatures. Moderate gas residence time. Small sample size |
| Wire mesh | 1500 | 1000 | 1–3600 | Vac – 69 | Powder | Uncertainty in particle temperature measurement. Short residence times of volatiles. Low uncertainty in the mass balances |
| TGA | 1200 | 1 | h | Vac – 2 | <2 mm | Low heating rates and temperatures. High volatile residence time. Good estimation of sample temperature. Online monitoring sample weight |
| Radiation | 2000 | 104–106 | ms | 1 | Powder | High heating rates. Difficult temperature measurement |
| Shock tubes | 700–2200 | 106 | ms | Vac | Fine | The temperature history of the system is well established. In shock tube reaction, times longer than 3.0 ms cannot be achieved. Also, sampling of the reaction zone for gas chromatographic analysis is time consuming |
| Py-MS | 700 | 20000 |
10–3600 | Vac – 1 | Fine | Direct measurement of volatile and light gases. Indirect measurement of the sample temperature |
| Fluid bed | 700–1200 | 1000–10000 |
1–3600 | 1–100 | 1–5 mm | High uncertainties in the closure of mass balances. Volatile quantifying uncertain. It is not possible to accurately determine particle temperature and residence time |
| Plate reactor | 300–700 | 102–106 | s | 1–2 | μm–film | Accurate temperature measurement of the particle. Uniformity on solid and temperature distribution. Visualization of solid sample |
| Ablative | 600 | — | 1 | 1 | cm–m | Volatile cracking reactions. Solids temperature measurement is not possible. Difficult volatile monitoring |
| Auger | 600 | — | min | 1 | Chips | Bio-oil contamination of sand. Difficult estimation of solids temperature. Higher volatile residence times |
| Curie point | 300–900 | — | s | 1 | μm–mm | The temperature ceases to rise when the Curie-point of the metal has been reached; that is the exact reproducible temperature at which the ferromagneticmaterial loses its magnetism. Temperature control is limited |
| Microwave | 500–2000 W | — | min | 1 | Powder | Suffers from uneven sample heating. Selective heating of polar groups |
Particle heating is commonly assumed to follow a linear heating, mathematically represented as: T = βt + T0 with β, t and T0 as the heating rate, time and initial temperature of the particle, respectively.85,216,223 This is a classic simplification used for “lumped” heat transfer wherein spatial temperature gradients are neglected. This approximation is typically considered applicable for systems exhibiting a Biot number ≤ 0.1 and can be valid under certain experimental conditions such as those in thermogravimetric analysis or pyrolysis subjected to kinetic control conditions using thin films and small particle sizes. If this condition is met, and there are not convective heat transfer limitations, the reaction rate constants may be considered “intrinsic”, meaning transport phenomena are lumped with chemical reaction rates.
Fig. 4 illustrated that for large particles (>1 mm), temperature gradients exist and heating rates at each point are different, modifying reactivity patterns at each point within the biomass particle (the reaction rate depends on the heating rate and reaction temperature). This consideration has been ignored in many studies,50,67,86 where normally the same reaction rate expression is used to describe the reactivity of the whole particle. This can cause problems when predicting the final product distribution, because each point inside the particle has a different effective reaction rate due to changes in the heating rates and temperatures and rate data is this not intrinsic kinetic data. Care must be taken to review the experimental protocols used to extract rate data which not collated with heat transfer or mass transfer through a large biomass particle or dust pile (>100 μm thick).122 For fast pyrolysis studies, there are many techniques and devices, which can ensure conditions of high heating rates, such as: flash radiation lamps, wire mesh reactors, discharge tubes, and free fall reactors. Table 4 summarizes the main characteristics of these devices. For intrinsic kinetic studies, the most commonly used devices are free fall reactors, Pyrolysis-Mass Spectrometry (Py-MS) reactors, and wire mesh reactors, all of which minimize heat transfer limitations and secondary vapor phase reactions.223–227 For further reading on how to design a system for extracting intrinsic pyrolysis kinetics, please see Fig. 7 and a recent publication by the Dauenhauer research group.222
Mass transfer
Influence of pore structure on intraparticle mass transport
The rapid evolution of pyrolysis vapors can generate significant pressure gradients within particles, particularly in larger particles, because the volatiles cannot be instantly evacuated. This causes some internal structures to crack, increasing the quantity of both macropores and micropores. When the biomass passes through a molten (or metaplastic) phase, the internal structures can warp and block pores at high heating rates.112,113Shen et al.106 found that bio-oil yields obtained from mallee (Australian Eucalyptus) in a fluidized bed reactor decreases as the particle diameter increases from 0.3 to 1.5 mm, and thereafter bio-oil yield is insensitive to particle size increases. Koçkar et al.228 reported that the maximum bio-oil yield is achieved with a 0.42 mm particle size. Koçkar et al.228 and Nurul et al.229 have reported ideal particle sizes of between 0.85 to 200 mm for fixed-bed pyrolysis of rapeseed, with bio-oil yields of up to 60 wt%. Laboratory scale studies of primary biomass pyrolysis reactions show that rapid removal of products the solid matrix is critical to achieve high oil yields. This removal is facilitated by the use of small particle sizes (<100 μm) and vacuum conditions.227,230
Increasing vapor residence time favors cracking reactions that reduce the yield of condensable vapors.11,28,92 Therefore, secondary reactions between char and volatiles are more prominent in larger particles, which increases the yield of char and gases by consuming pyrolysis oil.84 Zhou et al.117 showed the effect of particle size on the formation of char and lignin oligomers during beech wood pyrolysis. The authors suggest two distinct pyrolysis regimes to explain the oligomer yields obtained. In the first regime, for particles with diameters between 0.3–3 mm, the lignin oligomer yield decreased when particle size was increased. For particles >3 mm, no changes were observed in oligomer yield when particle size changed. The authors hypothesized that lignin oligomers come from aerosol ejection from the intermediate liquid phase which form char while diffusing through large particles. In contrast, char yield increased with increasing particle size. A reasonable explanation for this behavior is that below 1 mm, all the pore ends are open. This allows for vapors to leave without being trapped.100,231 Similar results have been reported elsewhere.11,24,37,68,69,84,131
The anisotropic pore structure93 of most lignocellulose species (like wood) leads to differences in gas permeabilities in the axial and radial directions of up to 4 orders of magnitude.232 Permeability scales with pore size to the second power, so this is to be expected.210 Adding complication to modelling, macroporosity changes dynamically as biomass is converted to char.233 Diffusion constants used in Fick's laws for porous media transport through macropores can be estimated as Deff = εD/τ, where ε is porosity, D is gas diffusivity for a species, and τ is tortuosity (often estimated as τ = ε−1/3). Diffusion coefficients should be represented as a tensor, since porosity is anisotropic. Anisotropic permeability and diffusion have been clearly illustrated experimentally in laser-induced fluorescence experiments shown in Fig. 8.234
 | ||
| Fig. 8 Laser-induced fluorescence images of pyrolysis volatiles leaving the axial ends of wood cylinders due to anisotropic permeation and diffusion.234 © 2003, Optical Society of America, reprinted with permissions. | ||
Influence of reactor residence times on pyrolysis
A short vapor residence time increases the bio-oil yield and minimize secondary vapor phase reactions.37,69,99,100,235 However high feedstock residence times are needed to ensure complete devolatilization.37,100,192 These times are directly related to the operating conditions, such as carrier gas flow for fluidized beds, and the technology used in the pyrolysis process. For instance, the residence time of solids in fixed bed reactors is higher (minutes to hours) while in fluid bed reactors the residence time for both solids and volatiles is very short (a few seconds), depending on the height of the reactor and the gas flow. Scott et al.236 have observed in pyrolysis of sorghum bagasse at 550 °C that as the vapor residence time increases, the bio-oil yield drastically reduces from 75% to 57% and char and gas yields increase. Further, heavy tars are formed with more vapor reseidence time. Some authors suggest taking advantage of these reactions to increase monomer yield by cracking oligomers.21The volatile residence time in a fluidized bed reactor is manipulated by changing the carrier gas flow,99,237,238 however it can also be altered by gas phase pressure. At high pressures the volatile residence time within particles is high, promoting secondary cracking reactions.190,209,239 In wire mesh and hot plate reactors this condition is commonly achieved by operating the reactor under vacuum (<200 mbar).230,240,241 Under these conditions, evaporation of high molecular weight oligomers from cellulose decomposition is possible. Aerosol ejection from the liquid phase is also more intense under these conditions.242,243
Phase change
Liquid intermediate formation
A recent study conducted by Zhou et al.184 showed that for both slow pyrolysis (2 K s−1) and fast pyrolysis (1000 K s−1), lignin decomposes to form an intermediate liquid phase, which swells, evaporates and shrinks to form a droplet. Other studies at high heating rates showed that an intense foaming of oligomeric compounds in the liquid phase occurs, which may be ejected from the surface as aerosolized droplets.244 At low heating rates, the intermediate liquid provides an ionic medium in which cross-linking reactions can occur, promoting char formation and decreasing high molecular weight oligomers yield.132 Thus, it could be concluded that minimizing the time that compounds stay in that phase will enhance the yield of oligomeric compounds through unique physical mechanisms. It has been shown that during boiling of a liquid at high heating rates, an intense bubbling is produced due to violent expansion of gases in over very short periods of time which facilitates fluid collapse by micro-explosions that release small liquid droplets as aerosols into the gas stream.243,245,246The existence of an intermediate liquid phase during biomass pyrolysis has sparked much debate for several decades. Goring et al.88 observed that for cellulose, lignin, and hemicellulose a softening occurred when samples were immersed in a hot oil bath. The authors attributed this behavior to the formation of an intermediate liquid phase due to thermal degradation rather than a phase change associated with the glass transition point. The softening point was estimated as the temperature at which the solid structure collapsed (227–253 °C for cellulose), higher than the glass transition point of the cellulose (145–175 °C).
In 1974, Nordin et al.247 carried out an interesting experiment in which visual evidence of a condensed phase during flash pyrolysis was presented when exposing various types of leaf paper to a heating laser in less than 0.1 ms. Once samples reach the pyrolysis temperature, volatiles were collected, rapidly cooled and analyzed. Based on these results the authors argued that the structure of cellulose was clearly broken and the crystallinity index had decreased by 35%. These results were attributed to a physical phenomenon, namely fusion of cellulose, instead of thermal degradation. They concluded that cellulose and biomass pass through a condensed phase, although it could not be determined if this behavior was due to a chemical thermal degradation process or a condensation of monomers. Over the course of this decade, the first theoretical models to explain the phase change of cellulose and biomass during pyrolysis were developed. These schemes include an intermediate liquid phase referred to as activated cellulose in some studies.
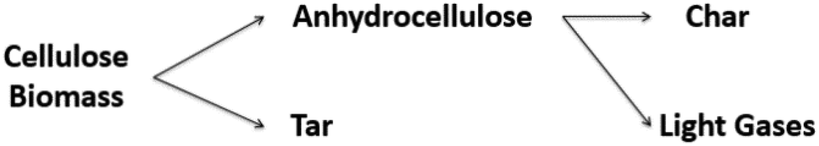
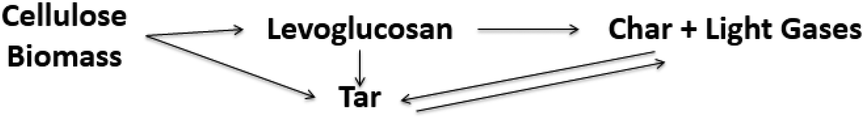
Kilzer and Broido138 rigorously analyzed the data reported in the literature related to cellulose pyrolysis obtained using a thermobalance. They proposed a two-step competitive model (model 1, Table 1). In this model they describe the transformation of cellulose into an unstable intermediate compound, which in most cases is associated with monomeric levoglucosan. Between 1971 and 1975, Broido and Weinstein,134 Shafizadeh,141 and Bradbury145 proposed similar reaction schemes. Patai et al.248 and Golova249 studied changes in degree of polymerization of cellulose at a temperature range of 170–230 °C, where the mass loss only reaches approximately 5%. These researchers associated the reduction of the degree of polymerization with random breaking of cellulose glycosidic bonds, giving rise to anhydrous glucose derived sugars (levoglucosan, cellobiosan, cellotriosan).
In 1980, during the Specialists’ Workshop on Biomass Fast Pyrolysis held at Copper Mountain (USA), Diebold250 carried out in front of all attendees an experiment in which he demonstrated a hot nichrome wire passing through a piece of biomass as if it were butter, without a trace of char. A detailed analysis of the biomass edges after cutting showed virgin biomass structures covered by a beige layer, like a varnish. The explanation for this observation was the formation of a molten phase, which is liquid at pyrolysis temperatures and solid at room temperature. After Diebold's demonstration, in 1985 Lédé et al.251 presented the results of a biomass pyrolysis experiment in a spinning disk reactor. In this experiment large cylindrical wood pieces were pressed at high pressure (0.1–3.5 MPa) against a hot disk (500–900 °C) that rotates at constant velocity, thereby degrading biomass. During the reaction on the heated disc, a liquid film formed in the wake of the biomass, like a lubricant, direct evidence of the formation of an intermediate liquid phase that faded away with time. This evidence corroborated the results presented by Diebold.250
In 1989, Pouwels et al.252 carried out a number of interesting experiments for the study of the fast pyrolysis in situ and ex situ of cellulose, using a mass spectrometer Desorption Chemical Ionization Mass Spectrometry (DCI-MS), Desorption Ionization Mass Spectrometry (DC-MS) and curie-point-DCI-MS. The authors identified anhydrous sugars containing up to 6 degrees of polymerization (cellohexoses) at high concentrations, thereby indicating that the first step of the devolatilization process is depolymerization of lower molecular weight compounds with high melting points (>250 °C). Boiling points between 339–550 °C hint that levoglucosan and cellobiosan make up the intermediate liquid phase.
In 1998 Boutin et al.253 studied cellulose fast pyrolysis in a reactor heated by radiation and confirmed the formation of an off-yellow film, on the cellulose surface. This film was soluble in water and polar solvents, indicating that this was a new compound and not molten cellulose, which has a hydrophobic behavior. Piskorz et al.254 concluded that it is very difficult to reach the glass transition point without undergoing any thermal degradation. Piskorz et al.255 later presented experimental evidence showing that it is possible to depolymerize cellulose to produce oligosaccharides with varying degrees of polymerization. They showed by scanning electron microscopy (SEM) analysis that the cellulose structure was deformed like a swollen polymer. Qualitative analysis by HPLC of the methanol soluble solid char showed a variety of anhydrosugars with degrees of polymerization of 1–7, and a heavier fraction which could not be identified. These results again corroborate that cellulose passes through an intermediate liquid-state product during depolymerization.
In 2003 McGrath et al.256 studied the char obtained from pyrolysis of tobacco leaves and its biopolymer constituents. Using scanning electron microscopy (SEM), they demonstrated that snuff char passes through a melt phase between 450 and 550 °C (see Fig. 9). The authors did not assess the chemical composition of melt phase. The structural behavior of the cellulose and hemicellulose presented in these images is similar to that found for the tobacco leaves, as shown by Dufour.257
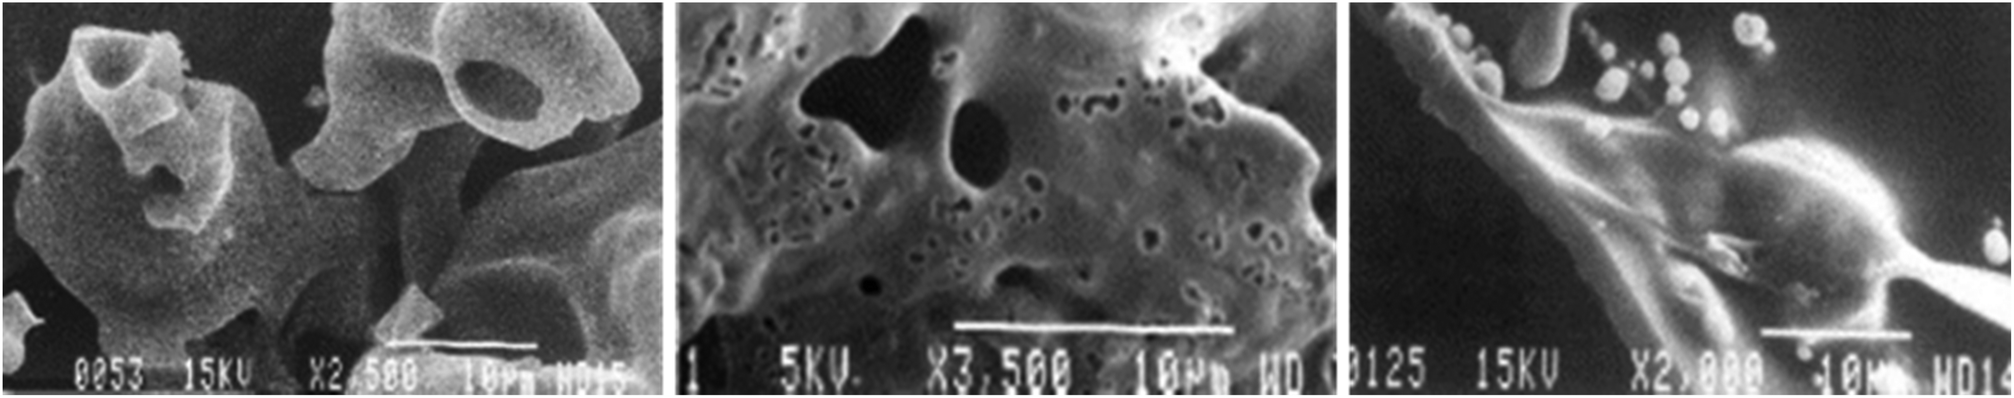 | ||
| Fig. 9 SEM micrographs illustrate structural changes of (left) avicel cellulose, (center) tobacco, and (right) alkali lignin during pyrolysis, which clearly show a melt phase has occurred. Reprinted from McGrath et al.,256 Copyright (2003), with permission from Elsevier. | ||
In 2008, Liu et al.258 carried out experiments in an oven heated by radiation (under fast pyrolysis conditions) to estimate the evolution of the condensed phase formed during cellulose pyrolysis. The authors confirmed results that had been obtained in previous studies.131,253,259 They demonstrated that up to 68% (w/w) of the initial cellulose formed a water soluble compound of yellow color, consisting primarily of oligomers of glucose. They proved that under lower severity heating conditions lower yields of the condensed phase were obtained, with maximum yields dropping to 57% (w/w).
An article presented by Mamleev et al.132 in 2009 investigated a new kinetic model called a “two-phase model”. This model incorporates the formation and growth of liquid cavities within the cellulose that contain high boiling point compounds within the liquid phase (cellobiosan, cellotriosan). The condensed phase is an ionic medium and promotes the decomposition of the reduced cellulose chains (after depolymerization) by two competing reactions: β-elimination and transglycolyzation. The first promotes char formation, while the second promotes the production of anhydrous sugars and volatiles. They suggest that the quick removal of liquid compounds by evaporation at high heating rates minimizes the effects of dehydration and crosslinking which are more prevalent at lower heating rates.
Dauenhauer et al.110 presented convincing visual evidence (Fig. 10) on the formation of the condensed phase. For the first time, a photographic record was made using a high-speed camera to monitor the evolution of cellulose during fast pyrolysis. For this study, 300 μm particles were pyrolyzed using a hot plate reactor at 700 °C. The melt phase begins to form at 50 ms (see Fig. 10), and it is completely formed after 120 ms. Inside the melted phase, intense bubbling and evaporation promote aerosol ejection and shrinking of the liquid phase. This phase is completely consumed after 150 ms, without a trace of char formation.
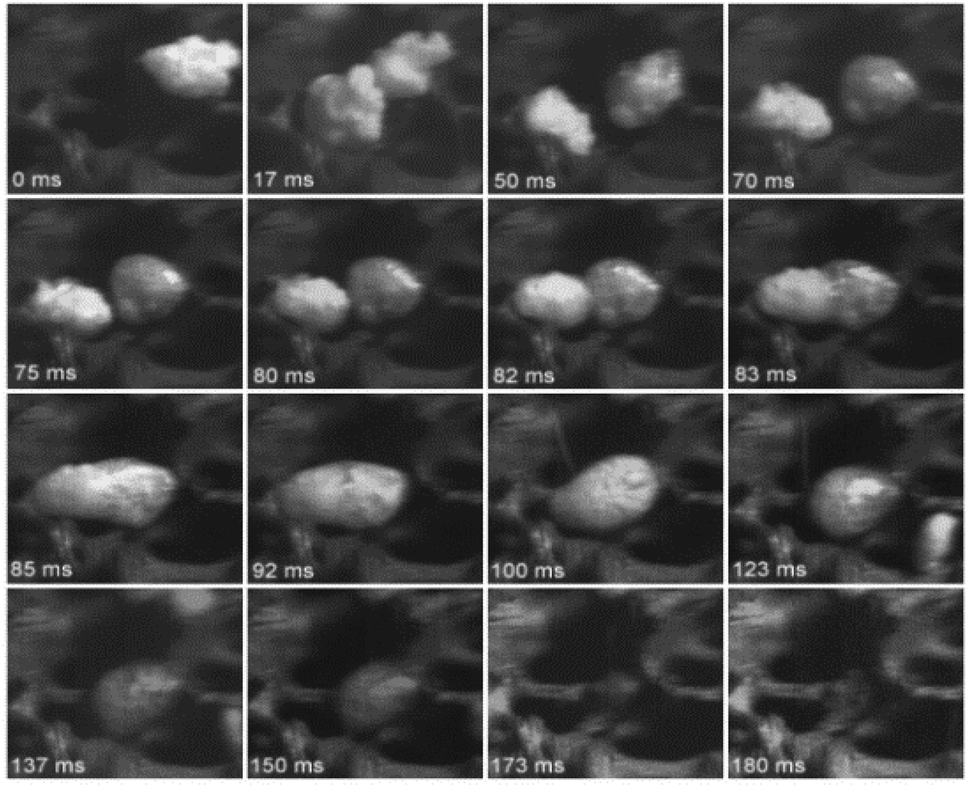 | ||
| Fig. 10 Photographic record of the evolution of the cellulose during fast pyrolysis. Republished with permission of the Royal Society of Chemistry, Dauenhauer et al.;110 permission conveyed through Copyright Clearance Center, Inc. | ||
Inside the intermediate liquid phase, gas bubbles are formed by chemical reactions and evaporation. The intensity of bubbling depends of the liquid temperature, heating rate, pressure and nature of the liquid phase.260–262 The bubbles bursting promotes aerosol ejection by a reactive boiling ejection mechanism.244 These aerosols can be trapped inside the cell walls. Evidence of this was provided by Haas et al.263 through in situ visualization inside the cell walls which showed the presences of oligomeric liquids (see Fig. 11). In this study biomass pyrolysis was monitored in real time via light microscopy and TEM. Observations showed swelling and tissue collapse in poplar wood fiber and the appearance of droplets of liquid encapsulated in the biomass pores, due to impingement of aerosols within the cell walls (see Fig. 11). The existence of the liquid phase within the cell walls has critical implications for attempts to define mass and energy transfer during pyrolysis.
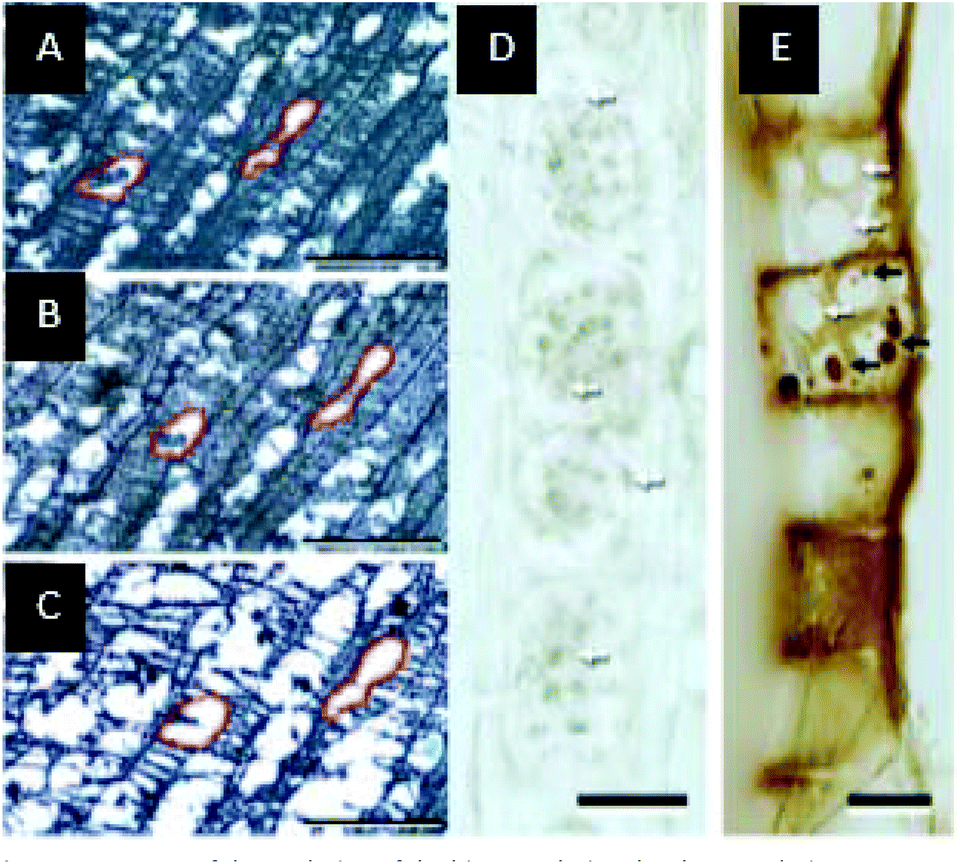 | ||
| Fig. 11 Images of the evolution of the biomass during the slow pyrolysis process. (A) 260 °C, (B) 299 °C, and (C) 501 °C. Red outlines of xylem cells track individual areas through each frame. (D) Longitudinally sectioned control poplar showing cell wall faces of ray parenchyma, with white arrows pointing to examples of cell wall pores (plasmodesma). (E) Longitudinally sectioned hot-stage poplar shows cell wall faces of ray parenchyma with collected pyrolysis products (black arrows). Reprinted (adapted) with permission from Haas et al.263 Copyright (2009) American Chemical Society. | ||
In 2011, Teixeira et al.244 used a high-speed camera to monitor the pyrolysis of cellulose and sucrose. The authors visualized the mechanism of aerosol formation by bubbles bursting in the intermediate liquid phase and devised a new mechanism called reactive boiling ejection to explain the results. Visualization of the ejection of droplets from the condensed phase of the sucrose during pyrolysis is presented in Fig. 12, along with cartoon representations to more clearly illustrate the process. The ratio between bubble size before bursting and aerosol size ejected is close to 0.1. The ejection velocity of the liquid droplets was 0.1 m s−1 and had an average diameter of 1 μm. The composition of the aerosols was primarily cellobiosan. With this information a mathematical model was developed to predict the mechanism for the formation of aerosols when a bubble bursts.
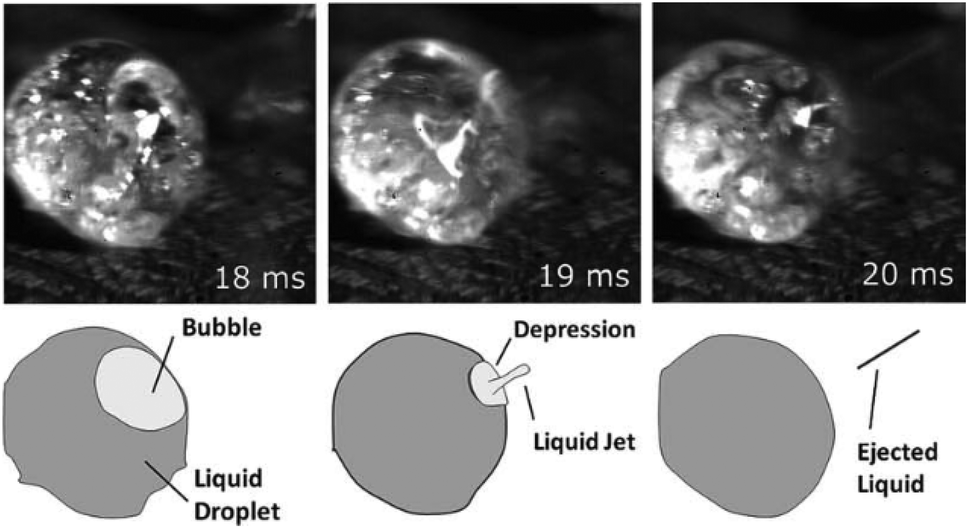 | ||
| Fig. 12 Ejection mechanism of liquid droplets from the intermediate liquid phase originating from the fast pyrolysis of sucrose (top) with cartoon representations of the observed behavior (bottom). Republished with permission of the Royal Society of Chemistry, Teixeira et al.;244 permission conveyed through Copyright Clearance Center, Inc. | ||
In 2012, Carlsson et al.,264 examined in situ pyrolysis of hardwood with a particle size of 300 μm. They captured the behavior and evolution of the condensed as the sample was heated phase (see Fig. 13). They found that during biomass pyrolysis, the tissues swelled, and formed a brown film that covered the biomass surface. This film was water-soluble and had different levels of transparency as the pyrolysis process progressed. Zhu et al.265 visualized soybean waste pyrolysis in a quartz capillary at 400 °C. This technique allows in situ monitoring of biomass pyrolysis during heating. There was a change in color as the reaction progressed, resulting in the formation of a liquid with an oily appearance at 240 °C. This liquid became darker as the temperature increased due to decomposition and polymerization reactions.
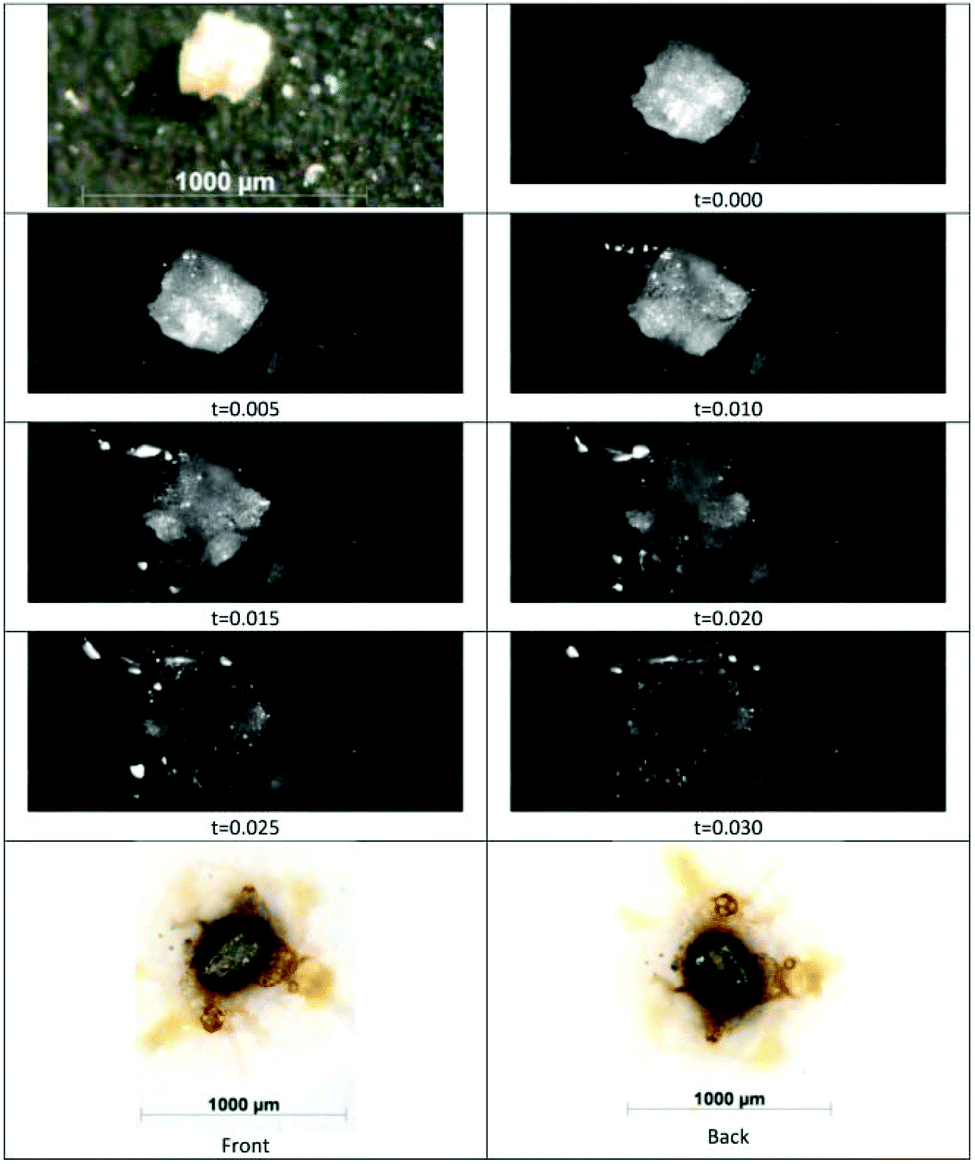 | ||
| Fig. 13 Evolution of the intermediate liquid phase during the fast pyrolysis of hardwood. Reprinted from Carlsson et al.,264 Copyright (2013) with permission from Elsevier. | ||
In 2013, Dufour et al.152 pyrolyzed biomass (miscanthus) and its biopolymer components in a parallel hot plate rheometer specifically adapted for in situ tracking of the viscoelastic behavior of the intermediate liquid phase formed during pyrolysis of biomass and its components. Experiments showed that melted lignin has an elastic behavior at 200 °C, hemicellulose at 270 °C, cellulose at 300 °C, and biomass at 280 °C. The elastic behavior of the biomass melt phase could not be estimated as a combination of each of its components. A valuable observation was that viscous behavior was identified after the onset of elastic behavior, i.e. structural changes occur first which correspond to the glass transition and then bond breaking occurs to form a viscous fluid phase. The researchers also found that cellulose imposes its viscoelastic behavior on biomass during thermal degradation. This viscoelastic behavior was found to be variable; after 400 °C all materials increased their elastic and viscous moduli. This indicates that a rigid phase formed at higher temperatures which, in the case of pyrolysis, corresponds to the char formation. These results were validated and compared with 1H-NMR.
Wang et al.51 and Liu et al.50 found that amorphous cellulose produces a higher content of the intermediate liquid phase, and that this formation begins at lower temperatures compared to crystalline cellulose. Amorphous cellulose produces a variety of anhydrous sugars with high degrees of polymerization, while the crystalline cellulose is rich in monomers and dimers of glucose. One explanation given by the authors was that there is a protective effect of the crystal lattices that gives greater rigidity to the structure and prevents the breaking of glucose rings. In 2016, Westerhof et al.266 showed that depolymerization of cellulose produces sugar oligomers in the liquid phase that are composed of anhydrosugars with a degree of polymerization >2. At high heating rates and under vacuum (2 mbarabs) these compounds escape by evaporation and aerosol ejection without producing char or permanent gases, indicating that for cellulose pyrolysis these fractions are produced by secondary reactions. The yield of levoglucosan increases when operating at 1 bar, because the boiling point of heavy sugars increases which reduces the evaporation rate of these compounds and allows depolymerization reactions to progress until forming levoglucosan, which evaporates.
Zhou et al.184 showed the importance of heating rate on the intermediate liquid phase formation during lignin pyrolysis. Using a fast speed camera the formation of intermediate liquid phase was observed in 3 stages: complete lignin melting, foaming and swelling of liquid phase by bubbles, and shrinking by evaporation and bubble collapse. Pecha et al.52,82,206 published a series of manuscripts in 2017 detailing experiments which studied the effect of vacuum on pyrolysis of cellulose, lignin, and xylan. These works illustrated, through high speed photography and pyrolysis product analysis, that the liquid intermediate is made up of partially pyrolyzed oligomers which will either break down into monomers or turn into char at atmospheric pressure. Further studies with Montoya et al.207,267,268 demonstrated protocols to analyze and model ejection of aerosols from a thin film of pyrolyzing pseudo-biomass components.
In summary, it has been demonstrated that the intermediate liquid phase during biomass pyrolysis does exist, especially under high heating rate conditions; however, this phase has not been adequately monitored experimentally. Particle-level mathematical models for both the bubble formation and thermal aerosol ejection mechanisms have not yet been completely explored. Other mechanisms for ejection of aerosols have not been studied, like viscous movement of liquid films along the inner walls of biomass pores.
Vaporization
As oligomeric compounds depolymerize into dimers and monomers with high vapor pressures and boiling points at pyrolysis temperatures, they leave the liquid intermediate as a vapor. For example, the boiling points of pyrolytic cellulose sugars levoglucosan, cellobiosan, and cellotriosan at 1 atm are 385 °C,269 580 °C,269 and 790 °C,270 respectively. Oja and Suuberg have studied the vapor pressures of polycyclic aromatic hydrocarbons similar to lignin dimers and oligomers271,272 as well as other sugar monomers,273 as illustrated in Fig. 14.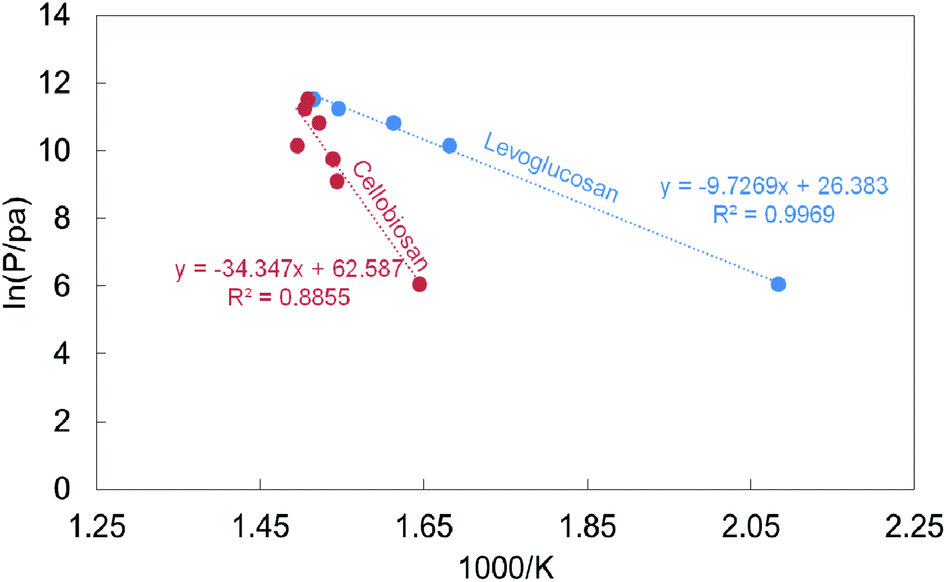 | ||
| Fig. 14 Vapor pressures of levoglucosan and cellobiosan with temperature illustrate how much more rapidly levoglucosan evaporates than heavier sugars. Reprinted from Pecha,58 Copyright (2017) with permission. | ||
Recent studies have elucidated the effect of vaporization on the nature of products from pyrolysis of cellulose, lignin, and wood. In cellulose, for example, lower pressures allow for larger sugar compounds from cellulose pyrolysis to evaporate (like cellobiosan and cellotriosan) and avoid conversion into polyaromatic rings and eventually char via dehydration and polycondensation reactions, as illustrated in Fig. 15 with high-resolution mass spectrometry of high molecular weight products.52 Similar trends were observed for lignin and poplar, where the char yield increases as pressure increases due to evaporation of compounds at lower pressures.206 Some work has also been done to characterize evaporation of pyrolysis oil droplets, which may be used to model heat of vaporization in simulations.241,274 Lumped reaction schemes include vaporization rate and enthalpy in the step for conversion of biopolymer to “oil”, but because of this they may not be extendible to significantly different pressures.
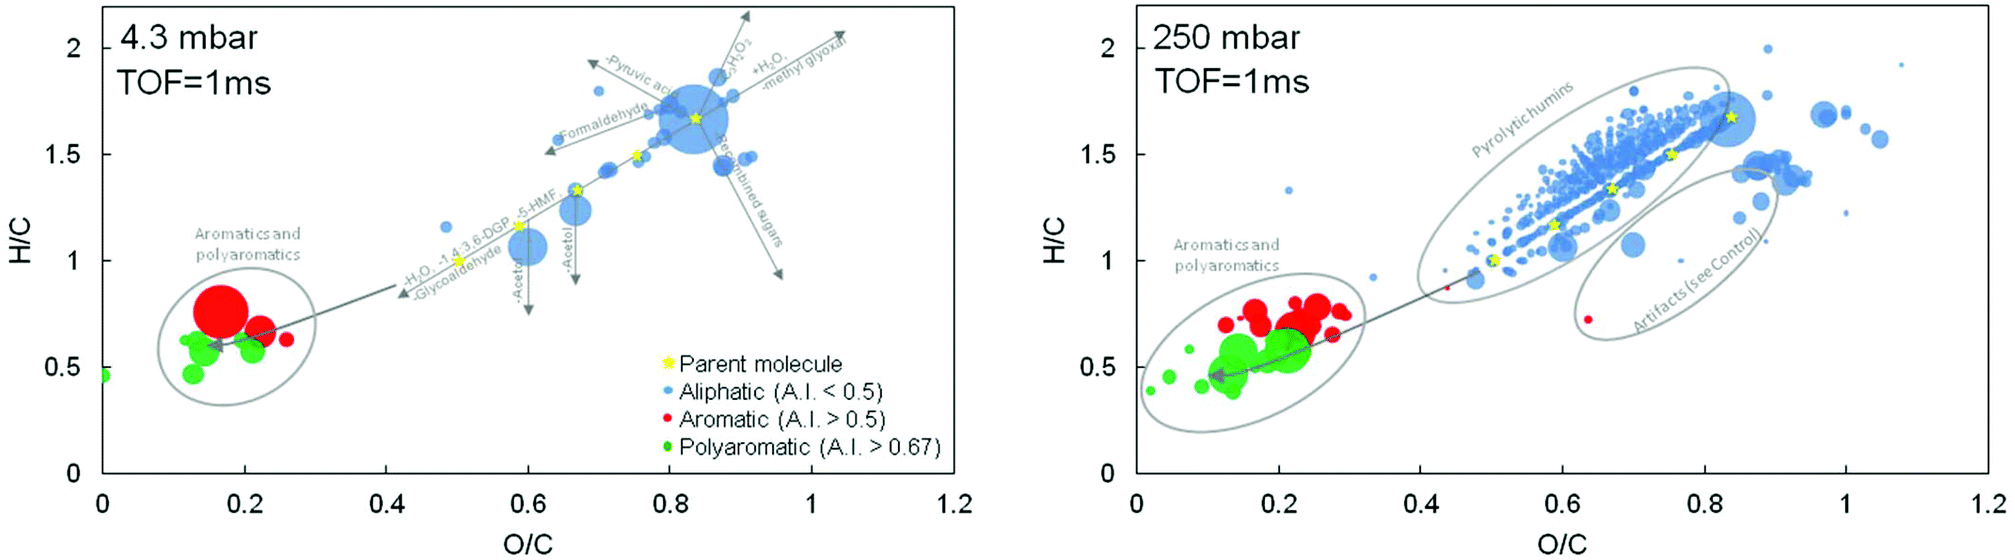 | ||
| Fig. 15 Van Krevelen plots for cellulose at two pressures (4.3 and 250 mbarabs) based on high resolution mass spectrometry illustrate the pathway for conversion of sugars into aromatics and char in the liquid intermediate if they cannot evaporate. Note that stars represent sugars like cellobiosan.52 Reprinted from Pecha,58 Copyright (2017) with permission. | ||
Char formation
Char is made up of a solid polycyclic aromatic structure and forms through both intra- and intermolecular rearrangement reactions.275,276 Some key steps include formation of aromatic benzene the combining of these rings into polycyclic clusters that generates the rigid hierarchical structure.53 Furthermore, char formation reactions are accompanied by release of water and light gas.77,270,277 Char formation reactions in lignin proceed through aldol condensation278 and radical induced cross-linking.279 Carbonization of cellulose is thought to proceed through oxygen-mediated reactions like aldol condensation at temperatures as low as 200 °C276 and free radical cross-linking and condensation reactions. Aromatic rings from cellulose include furans, pyrans, and 5–6 membered anoxic aromatic rings.276 C–C cross-linking into polyaromatic structures occurs as low as 400 °C; aromatic condensation increases until 500 °C. There is considerable increase in ring size as temperature increases to 700 °C.280 Evidence that trapped heavy oligomeric products form char can be seen in Fig. 16, where cellobiosan forms more char than levoglucosan due to its lower vapor pressure.52 Similar results have also been reported for lignin and wood.206
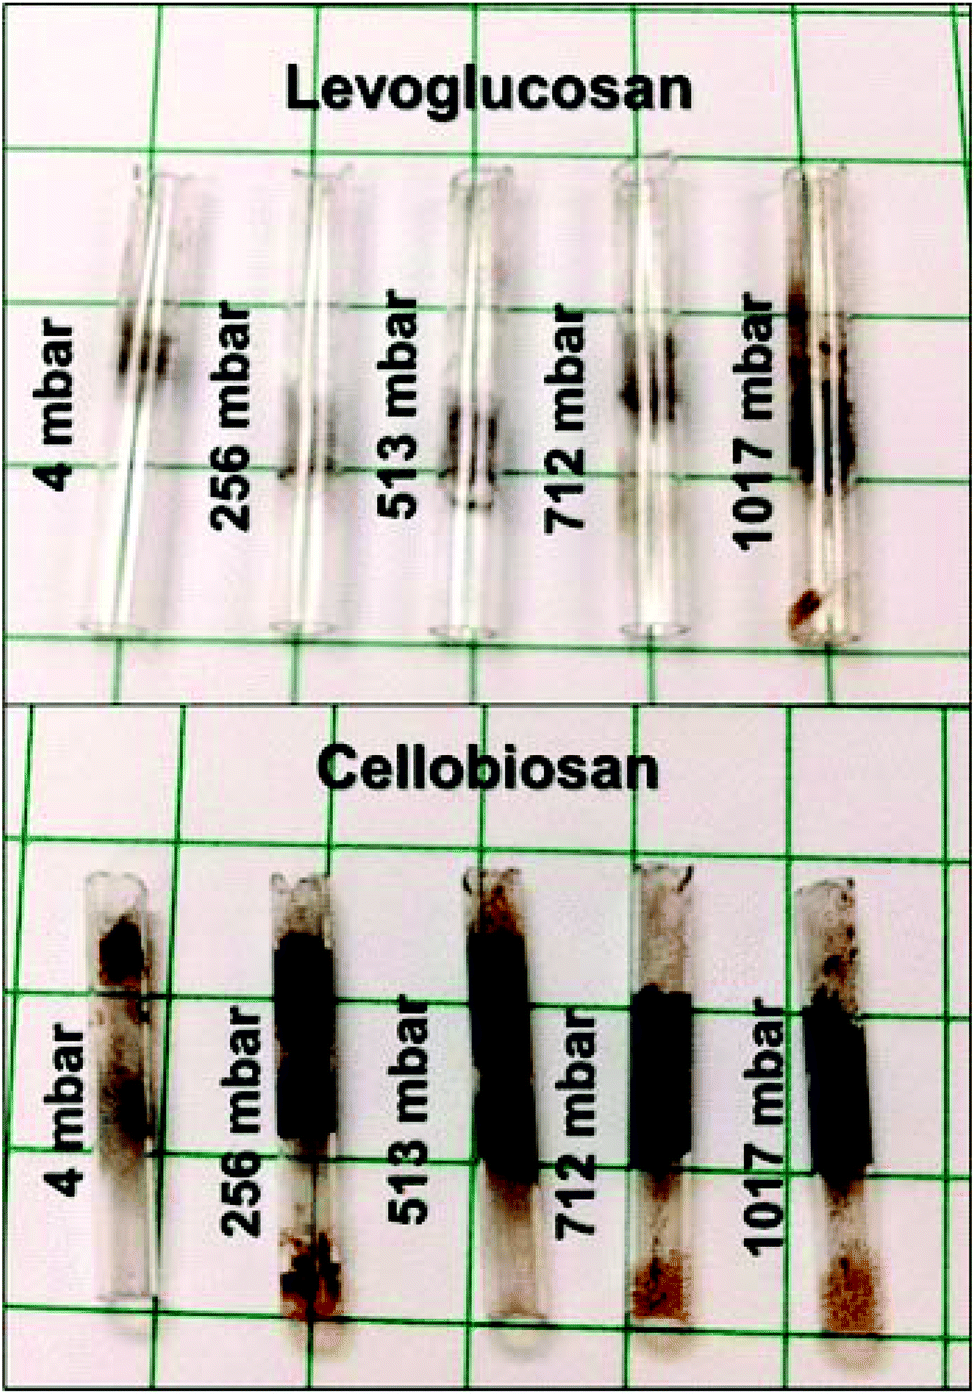 | ||
| Fig. 16 Char yields from pyrolysis of levoglucosan and cellobiosan at various low pressures up to 1 atm.58 Reprinted from Pecha,58 Copyright (2017) with permission. | ||
It is well known that char largely retains the tissue structure of its native lignocellulosic feedstock.280,281 However, if pyrolysis proceeds through a melt phase it will undergo alterations to its pore structure at some scales. This implies that biopolymers can cross-link before lysing, or that some other phenomenon is in play. Recent research actually indicates that metal (“ash”) content plays a role in preserving the structural porous backbone.82 It is possible that the ash catalyzes char formation reactions and since the ash is solid and less mobile than liquids, it acts as a template on which polycyclic rings form.
Incorporating the main phenomena into predictive models for biomass pyrolysis
Since 1940, there have been significant developments in the modelling of biomass particles under pyrolysis conditions. The complexity and coupling of the phenomena involved (transport of mass, energy, momentum, reactivity), has led to continued research and development of these models to achieve better representations of real processes. In general, modelling can be as rigorous as desired, however; this does not imply that better representations of real phenomena will result. Modelling can also be associated with different scales of study, for example, molecular, tissue, particle, or reactor scale models can be designed.231 The focus of this review are the particle-level models; however, some models that have developed for biomass fast pyrolysis at the reactor scale can be consulted.86,282–284Most articles published to date have considered one-dimensional non-steady state models, in one or two phases (solid–gas) with thermal equilibrium between phases (solid/gas), and global reaction schemes as described in Table 1. Some researchers suggest that, for small particles (<1 mm), the global kinetics scheme is sufficient to predict the product distribution.24 However for large particles, both physical and chemical changes occur simultaneously, and it is essential to consider the coupling of both phenomena to accurately obtain the global pyrolysis rate. A summary of models reported in the literature is presented in Table 5.
| Citation | Characteristics | Areas for improvement |
|---|---|---|
| Non dimensional models | ||
| Diebold140 1994 | Explains the pyrolysis of cellulose. Predicts behavior of cellulose under thermos-gravimetric (slow pyrolysis) operating conditions such as temperature, heating rate and pressure | Does not include the mass transfer restrictions, energy, water evaporation, or gas flow. Particle sizes used in the experiment were not reported. Cannot be used to predict product composition |
| Moghtaderi et al.290 1997 | Evaluates the temperature and mass loss of the biomass as a function of time. Modeled only the solid phase, considering two areas of interest: virgin biomass and char | Adopted a kinetic scheme with a single step. Mass loss of the solid to generate volatile phenomena is modeled as a sublimation of virgin biomass and it only takes into account the char-virgin biomass interface. Cannot be used to predict product composition |
| One-dimensional models | ||
| Bamford et al.291 1946 | Predicts temperature and weight loss profiles. Predicts volatiles evolution rate | Cannot be used to predict product yields or composition. No sensitivity analyses were carried out. No convection term. Assumed constant physical properties |
| Kanury & Blackshear292 1970 | Shows that convection term is needed in heat balance equation. Suggests that burning rate depends on particle size | Can only be used to investigate the importance of convective heat transfer |
| Kung,293 1972 | Predicts temperature and density profiles. Predicts volatiles release rate. Suggests that both thermal conductivity and specific heat of char, reaction heat, and particle size are important parameters in wood pyrolysis | Cannot be used to predict product yields or composition |
| Kanury294 1972 | Predicts volatiles and gas yields. Simple model gives good agreement with experimental work | Supposes lignin pyrolysis as dominant step |
| Maa and Bailie295 1973 | Predicts under what conditions heat transfer or chemical reaction are rate controlling. Predicts reaction rate and Temperature profiles. Predicts reaction times. Derived simple expressions to estimate time reaction by using either effective thermal conductivity (large particles) or effective activation energy (small particle) | Cannot be used to predict product yields or composition. Does not predict volatiles evolution rate |
| Fan et al.296 1977 | Introduces a new parameter, Lewis no., the ratio of thermal diffusivity to mass diffusivity. Predicts concentration and temperature profiles. Suggests that with a higher Lewis no., greater solid conversion is reached and there will be smaller temperature gradients within the particle. Suggests that heat of reaction affects the pyrolysis rate | Cannot be used to predict product yields or composition. Does not predict volatile evolution rate |
| Kansa et al.297 1977 | Predicts mass loss, pressure, and temperature profiles. Suggests that reaction heat, heat transfer by conductivity, specific heat of char and the permeability are important parameters in wood pyrolysis | Cannot be used to predict product yields or composition. Does not predict volatiles release rate |
| Pyle and Zaror298 1982 | Introduces two pyrolysis numbers, Py I (ratio: reaction time to heat penetration time) and PyII (Biot/Py I). Evaluates the importance of external and internal heat transfer. Predicts conversion and temperature profiles. Predicts conversion time. Carried out sensitivity study to check the particle size effect on conversion | Cannot be used to predict product yields. Does not predict volatiles release rate. No convection term |
| Becker et al.299 1984 | Predicts mass loss profiles. Predicts surface and internal temperature profiles. Predicts char yields | Does not predict volatiles yields. Does not predict volatiles release rate. Supposes physical properties constant. For large particles, kinetics and heat transfer are not coupled |
| Antal300 1985 | Predicts temperature profiles. Predicts weight loss. Calculates reaction times. Derives simple expressions to calculate heat up time and devolatilization time in pyrolysis | Cannot be used to predict product yields or composition. Does not predict volatile release rate |
| Chan et al.301 1985 | Predicts product yields and composition. Predicts volatiles release rate. Predicts temperature profile. Predicts moisture effects. Carried out sensitivity studies | Neglects mass transfer resistance, which may play a role in pyrolysis |
| Hastaoglu & Berruti302 1989 | Predicts optimal conditions for product yields (parametric study). Predicts temperature profiles and optimum heating rates in hollow fibrous structure of wood. Primary and secondary reactions are included | Specific to flash pyrolysis. Cannot be used to predict product yields or composition |
| Alves303 1989 | Predicts high temperature drying profiles at T > 150 °C. Applied to wet particles up to the free-water continuity point | Neglects water vapor diffusion, bound water, diffusion, and internal pressure gradients. Dimensions in longitudinal and transverse directions must be similar |
| Lédé et al.304 1994 | Predicts under what conditions heat transfer or chemical reaction is rate controlling. Introduces a thermal Thiele Modulus (ratio of heat penetration time to reaction time). Predicts temperature profile. Predicts reaction time | Cannot be used to predict product yields or composition. Does not predict volatiles evolution rate. Thermal properties are constant |
| Di Blasi285 1996 | Transient, one-dimensional for the fast pyrolysis of wood. Proposes a 3-stage kinetic model to predict the overall composition of char, gas and volatile, and a two-stage model to explain the secondary reactions of the volatiles out of the particle. The model considers thermal equilibrium between solid and gas, ideal gas behavior, change of properties with biomass conversion and convective, diffusive transport of gases, heat transfer by conduction, convection and radiation, and particle shrinkage. Predicts the temperature profiles, velocity, and overall concentration of species inside the particle as a function of position and time | Does not include condensed liquid intermediate phase, volatile species evolution, or the effect of the heating rate on the reaction rate expression |
| Richard305 1996 | Transient model for the pyrolysis of large solid fuels (wood, coal, etc.). The model simultaneously evaluates the devolatilization process and drying. Kinetic model is a single stage scheme | Does not evaluate convective, diffusive processes or water vapor within the particle; i.e. instantaneous evaporation is supposed on the front of reaction at constant temperature 100 °C. Ignores secondary reactions, evolution of species, liquid intermediate phase |
| Di Blasi211 2002 | Transient, for a flat particle, thin and dry biomass, which is subjected to an external source of heat in an inert atmosphere. Is considered changing the porosity and volume of the solid matrix. The pressure gradients are estimated using Darcy's law. Predicts the temperature development, and condensable volatile fraction of non-condensable volatiles escape velocity, depending on particle size, position (spatial gradients) and reaction time | Does not take into account the effect of the intermediate liquid; disregards the effect of the heating rate and evolution of species, including secondary reactions of the volatiles. Cannot be used to predict composition of products |
| Van de Weerdhof28 2010 | Unsteady state to predict the behavior of biomass pyrolysis. Includes heat transfer by conduction and convection and mass transfer by diffusion and convection. For different particle sizes and shapes, the model predicts overall yields of char, volatiles, and permanent gases. The author found that the pyrolysis of small particles (<1 mm) and spherical produces more volatile and the reaction time is shorter compared to flat and cylindrical shapes. For large particles (1 cm) the reaction time increases and the char yield is independent of the external heating rate, although it depends on the geometry of the particle | Does not predict volatiles species evolution rate. Applied for slow heating rates |
| Sharma306 2014 | The model, which accounts for the combined effect of various parameters such as particle shrinkage and drying, predicts temperature profiles, drying rate, char, and volatiles yields | Local thermal equilibrium (temperature gradient) was not considered between vapor and solid phase. Re-condensation of volatiles in cooler regions of the particle is not taken into account, due to higher permeability of char as compared to solid biomass. The volatile/gas phase follows ideal gas behavior. The kinetic and potential energies of the particle were neglected in the energy balance. The reaction heats for gases and secondary tar formation were considered equal. Particle shape did not change during the degradation process, i.e. cracking and fragmentation not considered |
| Two dimensional models | ||
| Di Blasi135 1998 | Energy transfer by conduction, convection and radiation; mass transfer by convection; diffusion of momentum using Darcy's law. This model estimates physicochemical changes in two dimensions (anisotropy). The results were compared with those of a one-dimensional model with non-steady state. The comparison between the two models shows that the reactions are faster and produce more volatile for configurations in two dimensions. An interesting feature of this work is the evaluation of the evaporation of moisture within the model and studying different schemes of shrinkage of the particle as uniform shrinkage, shrinkage layers (cell shrinkage), and shrinkage by cylinders. Showed that the shrinkage model affects the calculated heating rate, which, depending on the geometry, may have a positive or negative effect | This model proposes multi steps overall reaction scheme, but does not include the formation of intermediate liquid phase, the formation of side reactions, or the evolution of species |
| Bellais307 2007 | Predict the pyrolysis of biomass cylindrical large particles (order of cm). Includes changing properties of the conversion and the direction (anisotropy), and evaluates the mechanisms of heat and mass transfer by diffusion and convection as well as pressure profiles via Darcy's law. This model adopts multistage overall reaction schemes, regards secondary reactions, and evaluates the effect of the condensed phase on chemical reactions | Does not consider gaseous species evolution such (CO, CO2, H2). The formation of intermediate liquid phase is not considered. Limited to slow pyrolysis conditions |
| Kersten group235,308 2005 | Single particle models (1D and 2D) compared to experiments | Lumped kinetics, no coupling to secondary vapor phase reactions |
| Zeng et al.309 2007 | 2-d cylindrical model for concentrated solar radiation pyrolysis; simple reaction scheme with “intermediate solid” stage | Isotropic intraparticle transport; only 4 product species in reaction scheme |
| Okekunle et al.239 2012 | Effect of particle size and aspect ratio on tar decomposition. Predict temperature profiles and provides the char, volatiles and gas yields. Compares the temperature profiles and char yields considering isotropic and anisotropic structures | Does not predict the rate of water drying. Doesn't include mass transfer by diffusion. Particle shrinking is not included |
| Paulsen203 2014 | Predict temperature profiles, drying rate, and particle shrinkage. The carbohydrates profiles are predicted inside the particle. Classify the solid particle as: unreacted carbohydrate, virgin biomass and char | Isotropic particle. Mass transfer by diffusion is neglected. Ideal gas behavior. Secondary reactions not taken in account |
| Anca-Couce et al.157 2017 | 2-d cylindrical single particle model incorporating highly speciated RAC reaction scheme and secondary reactions in homogenous phase of reactor. Predicts trends for compound release for common monomers better than any other available reaction scheme | Some notable errors in yield predictions; reaction scheme does not account for oligomeric compounds |
| Pecha et al.310 2018 | 2-d cylindrical model with Di Blasi scheme. Distribution of particle size and morphology. Microscopy-informed internal properties. Coupling with reactor scale model for residence times of various sized particles and vapor residence time. Close prediction to experiment without any fitted parameters | Simplistic Di Blasi reaction scheme gives no semblance of bio-oil quality |
| Three dimensional models | ||
| Leonardi311 2007 | Spherical particles. Transient model for pyrolysis of wet biomass. This model is stringent because it includes water evaporation spatial changes in temperature, concentration, velocity profiles, and changes in physicochemical properties (anisotropy) | The reaction scheme is a global model adopted in one step without side reactions in the gas phase, gas-solid reactions, or the development of species of condensable and non-condensable volatiles. Nor is the formation of a liquid phase and its respective resistance to the processes of energy and mass transport included |
| Mahmoudi312 2014 | Numerical study based on the Lattice-Boltzmann Method (LBM) is proposed to solve one, two, and three-dimensional heat and mass transfer for isothermal carbonization of thick wood particles. The model is used to study the effect of reactor temperature and thermal boundary conditions on the evolution of the local temperature and the mass distributions of the wood particle during carbonization. Takes into account diffusive mechanisms for volatiles through this phase | Does not include secondary reactions. The physical properties do not depend on the conversion degree of the biomass. Does not consider evolution of species or the effect of the heating rate on the reaction rate |
| Gentile et al.313 2017 | Highly speciated Ranzi reaction scheme with 3D spherical and cylindrical model; moving mesh particle shrinking in OpenFOAM; decent matchup with experiments; transport anisotropy | Shrinking does not match up well with experiments, predicts high velocity from sides of particle; reaction scheme does not include liquid intermediate or oligomeric products |
| Models with explicit intermediate liquid phase | ||
| Oh et al.287 1989 | Model applied for coal pyrolysis with high swelling (softening coals). Includes heat and mass transfer through the condensed phase (meta plastic) via a bubble growth model uniformly distributed (population balance). The behavior is in transient state. The model predicts the production of tar, permanent gases, char, and evolution of the condensed phase as a function of time and temperature | Applied for coal. No spatial gradients of temperature or concentration of species. The overall kinetic scheme is a single stage and does not evaluate the evolution of individual species |
| Sezen314 1989 | Presents a model for studying transient dimensional fast pyrolysis of spherical coal (coal softening). This model is the most rigorous we have found which includes the effects of heat and mass transfer in the condensed phase. The model considers diffusive and convective transport of volatiles, heat transfer by conduction and convection, and uses a multi-stage kinetic mechanism | Does not study the evolution of individual species and their respective secondary reactions. Applies only for coal |
| Di Blasi285 1996 | Model for the pyrolysis of cellulose cylindrical particles in an ablative reactor (spinning-disk) as described by Ledé et al.251 The model developed is transient, and one-dimensional, using a Broido-Shafizadeh kinetic scheme. It does not regard side reactions or effects of diffusion and convection on volatiles. This proposed modeled considers the formation and evaporation of the condensed liquid intermediate | Does not consider diffusive mechanisms of volatiles through liquid phase. Does not consider the evolution of species or effect of the heating rate on the reaction rate |
| Ghazaryan315 2000 | Aerosol formation through bubble nucleation followed by condensation, evaporation, and collision within porous material | This model only considers aerosol filtration but does not consider the formation of gases through pyrolysis and ignores secondary reactions that produce char (changing the structure). The structural arrangement is very simple and may not reflect the real structure of lignocellulosic biomass |
| Boutin131 2002 | Model for the fast pyrolysis of cellulose pellets subjected to radiative heating. The model considers the formation and consumption of the intermediate liquid phase. This is a one-dimensional model, split in 3 areas (virgin biomass, liquid phase and char). Each zone formation is estimated by mass and energy balances, and the interface boundary conditions give continuity to the variables. The model only predicts the temperature profiles and the evolution of global species over time | Does not consider secondary reactions or the loss of moisture from the biomass, pressure gradients, or convection and mass transfer through each reaction zone |
| Bounaceur257 2011 | Intra-particle model for the pyrolysis of biomass fast pyrolysis under non-steady state. Includes the formation and consumption of the intermediate liquid phase. Evaporation of the liquid phase is modeled with a Clausius–Clapeyron expression and Darcy's law for estimating the volatile release. The model predicts the overall yields of species depending on the heating rate, and reaction time, and estimates the time and temperature where maximum conversion gives the intermediate liquid phase | The model does not consider spatial change (zero dimensional), so the mechanisms of conduction heat transfer, mass transfer by diffusion and convection, are not considered |
| Teixeira244 2011 | 2D-CFD modelling to explain boiling ejection in aerosol generation. Navier–Stokes equations are solved using finite volume. Models interface transport and capillary effects with the Eulerian volume of fluids (VOF) method. The current approach is capable of handling topological changes in the interface, such as the formation of droplets and bubbles. The simulation specifically considers ejection from the curved interface of a droplet, rather than an infinite pool with a flat surface. The model predicts the aerosol ejection velocity, aerosol size and distribution, and physical properties of molten phase | Only for cellulose pyrolysis. The populations to describe the coalescence, nucleation, breakage of bubbles formed inside the molten phase are not clear |
| Montoya et al.267 2016 | A slab of particle on a hot plate was modelled with a statistical model for bubbling frequency and growth in the liquid intermediate. Collision of aerosols along pore walls was considered such that large particles release less aerosols. Particle shrinking was considered. Yields of oligomeric compounds were close to those observed experimentally | Difficult to validate bubbling model because it is not possible to visualize this phenomenon inside particles |
Two dimensional models attempt to explicitly describe the anisotropy (different properties depending on the direction and position), which real-life biomass exhibits. These properties include thermal conductivity, permeability, density, porosity, and chemical composition. Typically, two-dimensional models are represented by cylinders. Three-dimensional models further expand the anisotropy in a third dimension. Typically, three-dimensional models do not improve the accuracy of results enough to justify the extra amount of computational time required. Although many single particle models have been developed, only a few have looked at the explicit species-specific microporosity of cell walls.93,214 See Table 5 for examples.
The majority of models at the particle level developed until now do not consider the intermediate liquid phase evolution. They also do not include other phenomena like gas bubble formation inside the liquid that explain the mechanism for aerosol formation.183,244 There are models proposed by Dufour et al.,257 Boutin et al.,131 Di Blasi,285 Lédé et al.,251 and Brown et al.286 which take into account the physiochemical properties of the liquid intermediate phase. However, these models still do not consider bubble formation and aerosol formation. Dufour incorporated evaporation of the liquid intermediate phase into the model. A model describing the levoglucosan was published in which the competition between evaporation and poly-condensation reactions was described.286 Recently, Montoya et al.268 developed a single particle model which incorporates thermal ejection of aerosols, though more work needs to be done to advance this topic.
Today, models for cellulose and biomass do not exist which include the liquid phenomena of gas bubbling and aerosol ejection, which are thought to be the primary sources for large molecules that are always observed in the bio-oil. However, these phenomena have been included for models with other raw materials like coal and polymers;261,287 these models describe bubble formation using a discrete phase population balance and couple this information with the global energy balance and mass transfer inside the particle. The important conclusion of these papers is that modelling the presence of the liquid intermediate dramatically changed the results from a model that ignores the liquid intermediate. In pyrolysis, this will impact the secondary reactions inside the particles. One important phenomenon unaccounted for in these models ignored is the formation of aerosols from bubble explosion at the surface of the liquid phase. See Table 5 for more detailed information about these models. Further discussion on coupling atomic scale models, single particle models, and reactor scale models can be seen in Ciesielski et al.26 and a focus on reactor scale modelling in Xiong et al.288,289
Conclusions
From this review, the following conclusions and recommendations can be drawn:• Bio-oil production by pyrolysis is still an immature technology and it is not currently commercially viable. Bio-oil production technologies still have to overcome many technical and economic barriers to compete with traditional fossil fuels and diversify its spectrum of value-added products.
• Fast pyrolysis is a complex process, with many interdependent phenomena including chemical reactions. Heating rate effects mass and energy transport inside particles. The real temperature in the particle is not identical to surface temperature. The particle structure changes through the pyrolysis process. The evolution of the intermediate phase (liquid phase) impacts product yields.
• New experimental methodologies to measure different parameters such as temperature, gas flow, and chemical composition have recently added to the scientific understanding of biomass pyrolysis, particularly with regards to the liquid intermediate phase and the oligomeric fraction of pyrolysis oil. However there is still limited experimental information regarding this phase, its impact on the evolution of species condensable and non-condensable volatile, and its incorporation into physical models.
• Recent studies have shown that aerosols rich levoglucosan dimers and trimers and lignin oligomers are formed directly from the ejection of fluid from the intermediate liquid phase. This phenomenon explains the presence of heavy compounds in bio-oil recovered from the fast pyrolysis of biomass, as well as the agglomeration and crusting of biomass particles and inert material in the reactor. Experiments at the laboratory level and rigorous models are still needed to understand many of the fundamentals associated with bubble formation and aerosol ejection.
• The integration of reaction and transport phenomena in a single particle model is not a trivial undertaking, with the validation the model an even more challenging task. Future pyrolysis models for particles must be able to predict volatilization as a function of time for different biomass feedstocks (necessary to design the reactor and optimize operating conditions) and predict the distribution of pyrolysis products. These models are likely to be based on existing transport models for particles, but must include more detailed estimation methods for critical transport parameters (e.g., thermal conductivity, heat capacity, liquid and gas viscosity etc.), condensed phase thermodynamics, and the reaction kinetics. These models should also be non-dimensionalized to ease application into reactor-scale models.
Conflicts of interest
There are no conflicts to declare.Acknowledgements
This work was authored in part by Alliance for Sustainable Energy, LLC, the manager and operator of the National Renewable Energy Laboratory for the U.S. Department of Energy (DOE) under Contract No. DE-AC36-08GO28308. Funding provided by the U.S. Department of Energy Office of Energy Efficiency and Renewable Energy Bioenergy Technologies Office. Jorge Montoya thanks Colciencias for the financial support during the development of the PhD with the call 526, and during the postdoctoral stay with the Call 784. Farid Chejne would like to thank ‘Strategy of transformation of the Colombian energy sector in the horizon 2030’ funded by the call 788 of Colciencias Scientific Ecosystem. Contract number FP44842-210-2018.References
- IEA, Key World Energy Statistics 2010, OECD Publishing, 2010 Search PubMed.
- G. Akhmat, K. Zaman, T. Shukui and F. Sajjad, Renewable Sustainable Energy Rev., 2014, 36, 123–134 CrossRef.
- International Energy Agency and I. E. Agency, Key World Energy, OECD Publishing, 2011 Search PubMed.
- E. C. Marín, H. S. Mahecha and S. P. Carrasco, Dyna, 2009, 76, 101–110 Search PubMed.
- S. Nakada, D. Saygin and D. Gielen, Global bioenergy supply and demand projections: a working paper for REmap 2030, 2014 Search PubMed.
- R. E. Davis, N. J. Grundl, L. Tao, M. J. Biddy, E. C. Tan, G. T. Beckham, D. Humbird, D. Thompson and M. S. Roni, Process Design and Economics for the Conversion of Lignocellulosic Biomass to Hydrocarbon Fuels and Coproducts: 2018 Biochemical Design Case Update; Biochemical Deconstruction and Conversion of Biomass to Fuels and Products via Integrated Biorefinery Path, National Renewable Energy Lab. (NREL), Golden, CO, USA, 2018 Search PubMed.
- A. Dutta, R. M. Swanson, A. Aden, J. A. Satrio, M. M. Wright, A. Platon, D. E. Daugaard, R. C. Brown, D. D. Hsu, R. P. Anex, F. K. Kazi, G. Kothandaraman and J. Fortman, Fuel, 2010, 89, S29–S35 CrossRef.
- E. Henrich, F. Schultmann, F. Trippe, R. Stahl and M. Fröhling, Waste Biomass Valorization, 2010, 1, 415–430 CrossRef.
- A. Dufour, C. Rogaume, Y. Rogaume, P. Girods and A. Zoulalian, J. Anal. Appl. Pyrolysis, 2009, 85, 171–183 CrossRef.
- M. C. Tirado, M. J. Cohen, N. Aberman, J. Meerman and B. Thompson, Food Res. Int., 2010, 43, 1729–1744 CrossRef.
- P. de Wild, H. Reith and E. Heeres, Biofuels, 2011, 2, 185–208 CrossRef CAS.
- H. L. Chum, Biomass Pyrolysis to Hydrocarbon Fuels in the Petroleum Refining Context: Cooperative Research and Development Final Report, CRADA Number CRD-12–500, National Renewable Energy Lab. (NREL), Golden, CO, United States, 2018 Search PubMed.
- J. Lehmann and S. Joseph, Biochar for Environmental Management: Science and Technology, Earthscan, Washington DC, 2009 Search PubMed.
- M. Garcia-Perez, J. Garcia-Nunez, T. Lewis, C. Kruger and S. Kantor, Methods for Producing Biochar and Advanced Biofuels in Washington State. Part 3: Literature Review of Technologies for Product Collection and Refining, Department of Biological Systems Engineering and the Center for Sustaining Agriculture and Natural Resources, Washington State University, Pullman, WA, 2011 Search PubMed.
- J. Hyväluoma, S. Kulju, M. Hannula, H. Wikberg, A. Källi and K. Rasa, Environ. Sci. Pollut. Res., 2017, 1–11 Search PubMed.
- J. A. Garcia-Nunez, D. T. Rodriguez, C. A. Fontanilla, N. E. Ramirez, E. E. Silva Lora, C. S. Frear, C. Stockle, J. Amonette and M. Garcia-Perez, Biomass Bioenergy, 2016, 95, 310–329 CrossRef CAS.
- L. Wang, Ø. Skreiberg, S. Van Wesenbeeck, M. Grønli and M. J. Antal, Energy Fuels, 2016, 30, 7994–8008 CrossRef CAS.
- M. J. Antal, E. Croiset, X. Dai, C. DeAlmeida, W. S.-L. Mok, N. Norberg, J.-R. Richard and M. Al Majthoub, Energy Fuels, 1996, 10, 652–658 CrossRef CAS.
- M.-K. Bahng, C. Mukarakate, D. J. Robichaud and M. R. Nimlos, Anal. Chim. Acta, 2009, 651, 117–138 CrossRef CAS PubMed.
- W. R. Kang and K. B. Lee, Korean J. Chem. Eng., 2013, 30, 1386–1394 CrossRef CAS.
- A. Sharma, V. Pareek and D. Zhang, Renewable Sustainable Energy Rev., 2015, 50, 1081–1096 CrossRef CAS.
- D. W. van Krevelen, Fuel, 1950, 29, 269–284 CAS.
- A. V. Bridgwater, Fast Pyrolysis of Biomass: A Handbook, PyNe, 3rd edn, 2008 Search PubMed.
- D. Meier, B. van de Beld, A. V. Bridgwater, D. C. Elliott, A. Oasmaa and F. Preto, Renewable Sustainable Energy Rev., 2013, 20, 619–641 CrossRef.
- A. C. Cuevas, C. Reinoso and J. Lamas, in Biomass for Energy, Environment, Agriculture, and Industry: Proceedings of the 8th European Biomass Conference, Vienna, Austria, 3rd–5th October 1994, ed. P. Chartier, A. A. C. M. Beenackers and G. Grassi, Pergamom Press, 1995, pp. 1506–1512 Search PubMed.
- P. N. Ciesielski, M. B. Pecha, V. S. Bharadwaj, C. Mukarakate, G. J. Leong, B. Kappes, M. F. Crowley, S. Kim, T. D. Foust and M. R. Nimlos, Wiley Interdiscip. Rev.: Energy Environ., 2018, 7, e297 CrossRef.
- G. Xiu-juan, W. Shu-Rong, W. Kai-Ge, L. Qian and L. Zhong-Yang, J. Fuel Chem. Technol., 2010, 38, 42–46 CrossRef.
- M. W. Van de Weerdhof, PhD Thesis, Eindhoven University of Technology, 2010.
- M. T. Klein and P. S. Virk, Energy Fuels, 2008, 22, 2175–2182 CrossRef CAS.
- D. M. Alonso, S. G. Wettstein and J. A. Dumesic, Chem. Soc. Rev., 2012, 41, 8075–8098 RSC.
- X. Zhou, W. Li, R. Mabon and L. J. Broadbelt, Energy Technol., 2016, 5, 52–79 CrossRef.
- P. Eronen, M. Österberg, S. Heikkinen, M. Tenkanen and J. Laine, Carbohydr. Polym., 2011, 86, 1281–1290 CrossRef CAS.
- M. W. Smith, G. L. Helms, J.-S. McEwen and M. Garcia-Perez, Carbon, 2017, 116, 210–222 CrossRef CAS.
- L. Li, P. Pérré, X. Frank and K. Mazeau, Carbohydr. Polym., 2015, 127, 438–450 CrossRef CAS PubMed.
- I. S. Goldstein, in Organic chemicals from biomass, CRC Press, 2018, pp. 9–18 Search PubMed.
- P. R. Patwardhan, J. A. Satrio, R. C. Brown and B. H. Shanks, Bioresour. Technol., 2010, 101, 4646–4655 CrossRef CAS PubMed.
- J. Akhtar and N. Saidina Amin, Renewable Sustainable Energy Rev., 2012, 16, 5101–5109 CrossRef CAS.
- H. Yang, R. Yan, H. Chen, C. Zheng, D. H. Lee and D. T. Liang, Combust. Flame, 2006, 146, 605–611 CrossRef CAS.
- H. Zhu, W. Luo, P. N. Ciesielski, Z. Fang, J. Y. Zhu, G. Henriksson, M. E. Himmel and L. Hu, Chem. Rev., 2016, 116, 9305–9374 CrossRef CAS PubMed.
- T. Hosoya, S. Saka and H. Kawamoto, J. Anal. Appl. Pyrolysis, 2007, 80, 118–125 CrossRef CAS.
- T. J. Hilbers, Z. Wang, B. Pecha, R. J. M. Westerhof, S. R. A. Kersten, M. R. Pelaez-Samaniego and M. Garcia-Perez, J. Anal. Appl. Pyrolysis, 2015, 114, 197–207 CrossRef CAS.
- A. Dufour, M. Castro-Diaz, N. Brosse, M. Bouroukba and C. Snape, ChemSusChem, 2012, 5, 1258–1265 CrossRef CAS PubMed.
- S. Salvador, C. Couhert and J.-M. Commandre, Fuel, 2009, 88, 408–417 CrossRef.
- E. Ranzi, A. Cuoci, T. Faravelli, A. Frassoldati, G. Migliavacca, S. Pierucci and S. Sommariva, Energy Fuels, 2008, 22, 4292–4300 CrossRef CAS.
- W. F. Degroot, M. D. Rahman, W.-P. Pan and G. N. Richards, J. Anal. Appl. Pyrolysis, 1988, 13, 221–231 CrossRef CAS.
- C. Branca and C. Di Blasi, Ind. Eng. Chem. Res., 2006, 45, 5891–5899 CrossRef CAS.
- G. R. Ponder, T. T. Stevenson and G. N. Richards, J. Anal. Appl. Pyrolysis, 1992, 22, 217–229 CrossRef CAS.
- M. S. Mettler, A. D. Paulsen, D. G. Vlachos and P. J. Dauenhauer, Green Chem., 2012, 14, 1284 RSC.
- A. Broido, A. C. Javier-Son, A. C. Ouano and E. M. Barrall, J. Appl. Polym. Sci., 1973, 17, 3627–3635 CrossRef.
- D. Liu, Y. Yu and H. Wu, Energy Fuels, 2013, 27, 1371–1380 CrossRef CAS.
- Z. Wang, A. G. McDonald, R. J. M. Westerhof, S. R. A. Kersten, C. M. Cuba-Torres, S. Ha, B. Pecha and M. Garcia-Perez, J. Anal. Appl. Pyrolysis, 2013, 100, 56–66 CrossRef CAS.
- M. B. Pecha, J. I. Montoya, F. Chejne and M. Garcia-Perez, Ind. Eng. Chem. Res., 2017, 56, 4288–4301 CrossRef CAS.
- F. X. Collard and J. Blin, Renewable Sustainable Energy Rev., 2014, 38, 594–608 CrossRef CAS.
- J. R. Obst and T. K. Kirk, Methods Enzymol., 1988, 161, 3–12 CAS.
- L. Yang, D. Wang, D. Zhou and Y. Zhang, Int. J. Biol. Macromol., 2016, 85, 417–424 CrossRef CAS PubMed.
- V. B. F. Custodis, C. Bährle, F. Vogel and J. A. van Bokhoven, J. Anal. Appl. Pyrolysis, 2015, 115, 214–223 CrossRef CAS.
- M. Asmadi, H. Kawamoto and S. Saka, J. Anal. Appl. Pyrolysis, 2011, 92, 417–425 CrossRef CAS.
- M. B. Pecha, PhD Thesis, Washington State University, 2017.
- P. R. Patwardhan, R. C. Brown and B. H. Shanks, ChemSusChem, 2011, 4, 636–643 CrossRef CAS PubMed.
- D. K. Shen, S. Gu and A. V. Bridgwater, J. Anal. Appl. Pyrolysis, 2010, 87, 199–206 CrossRef CAS.
- T. Hosoya, H. Kawamoto and S. Saka, J. Anal. Appl. Pyrolysis, 2007, 78, 328–336 CrossRef CAS.
- M. Widyawati, T. L. Church, N. H. Florin and A. T. Harris, Int. J. Hydrogen Energy, 2011, 36, 4800–4813 CrossRef CAS.
- S. Wang, Prog. Energy Combust. Sci., 2017, 62, 33–86 CrossRef.
- M. Sohrabi, M. R. Hajaligol, M. Nik-Azar and B. Dabir, Fuel Process. Technol., 1997, 51, 7–17 CrossRef.
- K. Raveendran, A. Ganesh and K. C. Khilar, Fuel, 1995, 74, 1812–1822 CrossRef CAS.
- Y. Yürüm and N. Öztaş, Fuel, 2000, 79, 1221–1227 CrossRef.
- A. W. Williams, PhD Thesis, Georgia Institute of Technology, 2011.
- G. Alexander, K. Wolframg, R. Sonia, A. Gómez, W. Klose and S. Rincón, Pirólisis de Biomasa: Cuesco de palma de aceite, Kassel University Press GmbH, Bogotá, 2008 Search PubMed.
- A. V. Bridgwater and G. V. C. Peacocke, Fast pyrolysis processes for biomass, 2000, vol. 4 Search PubMed.
- P. R. Patwardhan, PhD Thesis, Iowa State University, 2010.
- K. Shimomura, H. Watanabe and K. Okazaki, Proc. Combust. Inst., 2012, 34, 2339–2345 Search PubMed.
- G. N. Richards and G. Zheng, J. Anal. Appl. Pyrolysis, 1991, 21, 133–146 CrossRef CAS.
- Z. A. Mayer, A. Apfelbacher and A. Hornung, J. Anal. Appl. Pyrolysis, 2012, 96, 196–202 CrossRef CAS.
- G. Gellerstedt and M. Kleen, J. Anal. Appl. Pyrolysis, 1995, 35, 15–41 CrossRef.
- F. Sulaiman and N. Abdullah, Energy, 2011, 36, 2352–2359 CrossRef CAS.
- J. E. White, W. J. Catallo and B. L. Legendre, J. Anal. Appl. Pyrolysis, 2011, 91, 1–33 CrossRef CAS.
- J. Valette, J. Blin, F.-X. Collard and A. Bensakhria, J. Anal. Appl. Pyrolysis, 2012, 95, 213–226 CrossRef.
- E. Ranzi, P. E. A. Debiagi and A. Frassoldati, ACS Sustainable Chem. Eng., 2017, 5, 1–7 CrossRef.
- A. Anca-Couce and R. Scharler, Fuel, 2017, 206, 572–579 CrossRef CAS.
- T. Iwasaki, S. Suzuki and T. Kojima, Energy Environ. Res., 2014, 4, 64–72 Search PubMed.
- S. R. G. Oudenhoven, C. Lievens, R. J. M. Westerhof and S. R. A. Kersten, Biomass Bioenergy, 2016, 89, 78–90 CrossRef CAS.
- J. Montoya, B. Pecha, F. C. Janna and M. Garcia-Perez, J. Anal. Appl. Pyrolysis, 2017, 123, 307–318 CrossRef CAS.
- R. M. Baldwin, B. S. Donohoe, M. R. Nimlos, K. A. Magrini-Bair, J. E. Hensley, P. Pepiot and S. D. Phillips, Appl. Catal., B, 2012, 115–116, 320–329 CrossRef CAS.
- P. Basu, Biomass Gasification and Pyrolysis, © 2010 Elsevier Inc., 2010, vol. 45 Search PubMed.
- J. Lédé, Energies, 2010, 3, 886–898 CrossRef.
- C. Di Blasi, Chem. Eng. Sci., 2000, 55, 5999–6013 CrossRef CAS.
- J. Lédé, J. Anal. Appl. Pyrolysis, 2012, 94, 17–32 CrossRef.
- D. A. I. Goring, Pulp Pap. Mag. Can., 1963, 64, T517–T527 CAS.
- Y. Lin, J. Cho, G. A. Tompsett, P. R. Westmoreland and G. W. Huber, J. Phys. Chem. C, 2009, 113, 20097–20107 CrossRef CAS.
- J. Lédé, J. P. Diebold, G. V. C. Peacocke and J. Piskorz, in Developments in Thermochemical Biomass Conversion, ed. Springer Science + Bussines Media, CPL Press, Netherlands, 1997, pp. 27–42 Search PubMed.
- P. Pineda-Gomez, C. M. Bedoya-Hincapié and A. Rosales-Rivera, Dyna, 2011, 76, 207–214 Search PubMed.
- A. Melgar, D. Borge and J. F. Pérez, Dyna, 2008, 75, 123–131 Search PubMed.
- P. N. Ciesielski, M. F. Crowley, M. R. Nimlos, A. W. Sanders, G. M. Wiggins, D. Robichaud, B. S. Donohoe and T. D. Foust, Energy Fuels, 2015, 29, 242–254 CrossRef CAS.
- I. Milosavljevic, V. Oja and E. M. Suuberg, Ind. Eng. Chem. Res., 1996, 35, 653–662 CrossRef CAS.
- C. Di Blasi, C. Branca, F. E. Sarnataro and A. Gallo, Energy Fuels, 2014, 28, 2684–2696 CAS.
- C. Di Blasi, C. Branca, A. Galgano and B. Gallo, Energy Fuels, 2015, 29, 2514–2526 CAS.
- J. Montoya, B. Pecha, D. Roman, F. C. Janna and M. Garcia-Perez, J. Anal. Appl. Pyrolysis, 2016, 123, 347–363 Search PubMed.
- R. K. Singh and B. Ruj, Fuel, 2016, 174, 164–171 CrossRef CAS.
- J. I. Montoya, C. Valdés, F. Chejne, C. A. Gómez, A. Blanco, G. Marrugo, J. Osorio, E. Castillo, J. Aristóbulo and J. Acero, J. Anal. Appl. Pyrolysis, 2015, 112, 379–387 CAS.
- R. J. Westerhof, PhD Thesis, University of Twente, 2011.
- M. Garcia-Perez, S. Wang, J. Shen, M. Rhodes, W. J. Lee and C. Z. Li, Energy Fuels, 2008, 22, 2022–2032 CAS.
- S. Zhou, M. Garcia-Perez, B. Pecha, A. G. McDonald, S. R. A. Kersten and R. J. M. Westerhof, Energy Fuels, 2013, 27, 1428–1438 CAS.
- P. Basu, Biomass gasification and pyrolysis practical design and theory, Academic Press, Burlington, MA, 2010 Search PubMed.
- R. Narayan and M. J. J. Antal, Ind. Eng. Chem. Res., 1996, 35, 1711–1721 CAS.
- G. Pokol, G. Várhegyi and D. Dollimore, CRC Crit. Rev. Anal. Chem., 2008, 19, 65–93 Search PubMed.
- J. Shen, X.-S. Wang, M. Garcia-Perez, D. Mourant, M. J. Rhodes and C.-Z. Li, Fuel, 2009, 88, 1810–1817 CrossRef CAS.
- A. V. Bridgwater, Fast pyrolysis of biomass: a handbook, CPL Press, Newbury, 1999 Search PubMed.
- A. S. Kalgo, PhD Thesis, Aston University, 2011.
- M. Hajaligol, T. Fisher, B. Waymack and D. Kellogg, J. Anal. Appl. Pyrolysis, 2002, 62, 331–349 CrossRef.
- P. J. Dauenhauer, J. L. Colby, C. M. Balonek, W. J. Suszynski and L. D. Schmidt, Green Chem., 2009, 11, 1555–1561 RSC.
- W. C. Park, A. Atreya and H. R. Baum, Combust. Flame, 2009, 157, 481–494 CrossRef.
- D. S. Scott, J. Piskorz, M. A. Bergougnou, R. P. Overend and R. Graham, Ind. Eng. Chem. Res., 1988, 27, 8–15 CrossRef CAS.
- P. Fu, S. Hu, J. Xiang, P. Li, D. Huang, L. Jiang, A. Zhang and J. Zhang, J. Anal. Appl. Pyrolysis, 2010, 88, 117–123 CrossRef CAS.
- M. Garcia-Perez, The Formation of Polyaromatic Hydrocarbons and Dioxins During Pyrolysis: A Review of the Literature with Descriptions of Biomass Composition, Fast Pyrolysis Technologies and Thermochemical Reactions, Pullman, WA, 2008 Search PubMed.
- W. Chaiwat, I. Hasegawa, T. Tani, K. Sunagawa and K. Mae, Energy Fuels, 2009, 23, 5765–5772 CrossRef CAS.
- V. Agarwal, P. J. Dauenhauer, G. W. Huber and S. M. Auerbach, J. Am. Chem. Soc., 2012, 134, 14958–14972 CrossRef CAS PubMed.
- S. Zhou, M. Garcia-Perez, B. Pecha, A. G. McDonald and R. J. M. Westerhof, Fuel, 2014, 125, 15–19 CrossRef CAS.
- R. J. M. Westerhof, D. W. F. Brilman, M. Garcia-Perez, Z. Wang, S. R. G. Oudenhoven, W. P. M. Van Swaaij and S. R. A. Kersten, Energy Fuels, 2011, 25, 1817–1829 CrossRef CAS.
- J. Diebold and J. Scahill, in Fundamentals of Thermochemical Biomass Conversion, ed. R. P. Overend, T. A. Milne and L. K. Mudge, Springer Netherlands, 1985, pp. 539–555 Search PubMed.
- O. Onay, Fuel Process. Technol., 2007, 88, 523–531 CrossRef CAS.
- S. Thangalazhy-Gopakumar, S. Adhikari, R. B. Gupta and S. D. Fernando, Energy Fuels, 2011, 25, 1191–1199 CrossRef CAS.
- M. S. Mettler, D. G. Vlachos and P. J. Dauenhauer, Energy Environ. Sci., 2012, 5, 7797 RSC.
- N. Ozbay, A. E. Putun and E. Putun, Int. J. Energy Res., 2006, 30, 501–510 CrossRef CAS.
- J. J. M. Orfão, F. J. A. Antunes and J. L. Figueiredo, Fuel, 1999, 78, 349–358 CrossRef.
- M. G. Grønli, PhD Thesis, Norwegian University of Science and Technology, 1996.
- G. Várhegyi and T. Székely, Thermochim. Acta, 1982, 57, 13–28 CrossRef.
- G. Várhegyi, Thermochim. Acta, 1987, 110, 95–99 CrossRef.
- M. J. Antal, Ind. Eng. Chem. Res., 1995, 34, 703–717 CrossRef CAS.
- I. Milosavljevic and E. Suuberg, Ind. Eng. Chem. Res., 1995, 34, 1081–1091 CrossRef CAS.
- D. Radlein, A. Grinshpun, J. Piskorz and D. S. Scott, J. Anal. Appl. Pyrolysis, 1987, 12, 39–49 CrossRef CAS.
- O. Boutin, M. Ferrer and J. Lédé, Chem. Eng. Sci., 2002, 57, 15–25 CrossRef CAS.
- M. Le Bras, J. Yvon, S. Bourbigot and V. Mamleev, J. Anal. Appl. Pyrolysis, 2009, 84, 1–17 CrossRef.
- O. Boutin, J. Lede, G. Olalde and A. Ferriere, J. Phys. IV Fr., 1999, 9, 367–372 Search PubMed.
- A. Broido and M. W. Weinstein, in Proceedings of the 3rd International conference on thermal Analysis, Birkhauser Verleg, 1972, pp. 285–296 Search PubMed.
- C. Di Blasi, J. Anal. Appl. Pyrolysis, 1998, 47, 43–64 CrossRef CAS.
- J. Lédé, J. P. Diebold, G. V. C. Peacocke and J. Piskorz, in Developments in Thermochemical Biomass Conversion, Springer Netherlands, 1997, pp. 27–42 Search PubMed.
- F. J. Kilzer and A. Broido, Pyrodynamics, 1965, 2, 151–163 CAS.
- F. J. Kilzer and A. Broido, Pyrodynamics, 1965, 2, 151–163 CAS.
- G. Várhegyi, E. Jakab and M. J. Antal Jr., Energy Fuels, 1994, 8, 1345–1352 CrossRef.
- J. P. Diebold, Biomass Bioenergy, 1994, 7, 75–85 CrossRef CAS.
- F. Shafizadeh, M. L. Wolfrom and R. S. Tipson, Adv. Carbohydr. Chem., 1968, 23, 419–474 CAS.
- C. A. Koufopanos, G. Maschio and A. Lucchesi, Can. J. Chem. Eng., 1989, 67, 75–84 CrossRef CAS.
- J. L. Banyasz, S. Li, J. L. Lyons-Hart and K. H. Shafer, J. Anal. Appl. Pyrolysis, 2001, 57, 223–248 CrossRef CAS.
- R. W. Agrawal, Can. J. Chem. Eng., 1988, 66, 403–412 CrossRef CAS.
- A. G. W. Bradbury, Y. Sakai and F. Shafizadeh, J. Appl. Polym. Sci., 1979, 23, 3271–3280 CrossRef CAS.
- G. Várhegyi, M. J. Antal, E. Jakab and P. Szabó, J. Anal. Appl. Pyrolysis, 1997, 42, 73–87 CrossRef.
- C. Şerbănescu, Chem. Pap., 2014, 67, 847–860 Search PubMed.
- H. Yang, R. Yan, H. Chen, C. Zheng, D. H. Lee and D. T. Liang, Energy Fuels, 2006, 20, 388–393 CrossRef CAS.
- R. Font, A. Marcilla, E. Verdu and J. Devesa, Ind. Eng. Chem. Res., 1990, 29, 1846–1855 CrossRef CAS.
- T. R. Rao and A. Sharma, Energy, 1998, 23, 973–978 CrossRef CAS.
- X. Guo, Z. Luo, K. Wang and S. Wang, J. Anal. Appl. Pyrolysis, 2011, 91, 183–189 CrossRef.
- A. Dufour, M. Castro-Díaz, P. Marchal, N. Brosse, R. Olcese, M. Bouroukba and C. Snape, Energy Fuels, 2012, 26, 6432–6441 CrossRef CAS.
- A. O. Oyedun, T. Gebreegziabher and C. W. Hui, Fuel Process. Technol., 2012, 106, 595–604 CrossRef.
- P. E. A. Debiagi, C. Pecchi, G. Gentile, A. Frassoldati, A. Cuoci, T. Faravelli and E. Ranzi, Energy Fuels, 2015, 29, 6544–6555 CrossRef CAS.
- R. Vinu and L. J. Broadbelt, Energy Environ. Sci., 2012, 5, 9808 RSC.
- M. Calonaci, R. Grana, E. B. Hemings, G. Bozzano, M. Dente and E. Ranzi, Energy Fuels, 2010, 24, 5727–5734 CrossRef CAS.
- A. Anca-Couce, P. Sommersacher and R. Scharler, J. Anal. Appl. Pyrolysis, 2017, 127, 411–425 CrossRef CAS.
- A. Anca-Couce, R. Mehrabian, R. Scharler and I. Obernberger, Energy Convers. Manage., 2014, 87, 687–696 CrossRef CAS.
- Y. Liao, S. Wang and X. Ma, Prepr. Pap. - Am. Chem. Soc., Div. Fuel Chem., 2004, 49, 407–412 CAS.
- R. H. Venderbosch and W. Prins, Biofuels, Bioprod. Biorefin., 2010, 4, 178–208 CrossRef CAS.
- D. S. Scott, D. Radlein, J. Piskorz and L. Paterson, J. Anal. Appl. Pyrolysis, 2001, 57, 169–176 CrossRef CAS.
- A. J. Yanez, P. Natarajan, W. Li, R. Mabon and L. J. Broadbelt, Energy Fuels, 2018, 32, 1822–1830 CrossRef CAS.
- S. Niksa, Proc. Combust. Inst., 2000, 28, 2727–2733 CrossRef CAS.
- C. P. Please, M. J. McGuinness and D. L. S. McElwain, Combust. Flame, 2003, 133, 107–117 CrossRef CAS.
- Q. Xiong, J. Zhang, F. Xu, G. Wiggins and C. Stuart Daw, J. Anal. Appl. Pyrolysis, 2016, 117, 176–181 CrossRef CAS.
- D. K. Shen, S. Gu, B. Jin and M. X. Fang, Bioresour. Technol., 2011, 102, 2047–2052 CrossRef CAS PubMed.
- Q.-V. Bach, K.-Q. Tran and Ø. Skreiberg, Appl. Energy, 2017, 185, 1059–1066 CrossRef CAS.
- L. Fiori, M. Valbusa, D. Lorenzi and L. Fambri, Bioresour. Technol., 2012, 103, 389–397 CrossRef CAS PubMed.
- J. Cai and R. Liu, Bioresour. Technol., 2008, 99, 2795–2799 CrossRef CAS PubMed.
- A. A. Jain, A. Mehra and V. V. Ranade, Fuel, 2016, 165, 490–498 CrossRef CAS.
- S. Wang, H. Lin, B. Ru, W. Sun, Y. Wang and Z. Luo, J. Anal. Appl. Pyrolysis, 2014, 108, 78–85 CrossRef CAS.
- M. V. Navarro, R. Murillo, A. M. Mastral, N. Puy and J. Bartroli, AIChE J., 2009, 55, 2700–2715 CrossRef CAS.
- J. Cai, S. Yang and T. Li, Bioresour. Technol., 2011, 102, 3642–3644 CrossRef CAS PubMed.
- A. Meng, H. Zhou, L. Qin, Y. Zhang and Q. Li, J. Anal. Appl. Pyrolysis, 2013, 104, 28–37 CrossRef CAS.
- A. N. Hayhurst, J. F. Davidson, S. A. Scott and J. S. Dennis, Chem. Eng. Sci., 2006, 61, 2339–2348 CrossRef.
- C. Ulloa, A. L. Gordon and X. Garcia, J. Anal. Appl. Pyrolysis, 2004, 71, 465–483 CrossRef CAS.
- Y. Chen, R. Bassilakis, W. W. Smith, R. M. Carangelo and M. A. Wójtowicz, J. Anal. Appl. Pyrolysis, 2003, 66, 235–261 CrossRef.
- T. Sonobe and N. Worasuwannarak, Fuel, 2008, 87, 414–421 CrossRef CAS.
- J. Cai, T. Li and R. Liu, Bioresour. Technol., 2011, 102, 3894–3899 CrossRef CAS PubMed.
- K. Miura and T. Maki, Energy Fuels, 1998, 12, 864–869 CrossRef CAS.
- S. Paea, Master's Thesis, Victoria University of Wellington, 2008.
- M. S. Mettler, S. H. Mushrif, A. D. Paulsen, A. D. Javadekar, D. G. Vlachos and P. J. Dauenhauer, Energy Environ. Sci., 2012, 5, 5414–5424 RSC.
- Z. Wang, B. Pecha, R. J. M. Westerhof, S. R. A. Kersten, C.-Z. Li, A. G. McDonald and M. Garcia-Perez, Ind. Eng. Chem. Res., 2014, 53, 2940–2955 CrossRef CAS.
- S. Zhou, B. Pecha, M. van Kuppevelt, A. G. McDonald and M. Garcia-Perez, Biomass Bioenergy, 2014, 66, 398–409 CrossRef CAS.
- A. Dieguez-Alonso, A. Anca-Couce, N. Zobel and F. Behrendt, Fuel, 2015, 153, 102–109 CrossRef CAS.
- P. R. Patwardhan, D. L. Dalluge, B. H. Shanks and R. C. Brown, Bioresour. Technol., 2011, 102, 5265–5269 CrossRef CAS PubMed.
- B. J. Vreugdenhil, R. W. R. Zwart and R. W. R. Zwart, Tar formation in pyrolysis and gasification, Petten, Netherlands, 2009 Search PubMed.
- J. Hayashi, T. Shoji, S. Kudo and K. Norinaga, Fuel, 2011, 103, 141–150 Search PubMed.
- M. L. Boroson, J. B. Howard, J. P. Longwell and W. A. Peters, Energy Fuels, 1989, 3, 735–740 CrossRef CAS.
- M. L. Boroson, J. B. Howard, J. P. Longwell and W. A. Peters, AIChE J., 1989, 35, 120–128 CrossRef CAS.
- C. F. Palma, Appl. Energy, 2013, 111, 129–141 CrossRef.
- P. Hasler, T. Nussbaumer and P. Morf, Fuel, 2002, 81, 843–853 CrossRef.
- P. Ahuja, S. Kumar and P. C. Singh, Chem. Eng. Technol., 1996, 19, 272–282 CrossRef CAS.
- E. Hoekstra, R. J. M. Westerhof, W. Brilman, W. P. M. Van Swaaij, S. R. A. Kersten, K. J. A. Hogendoorn and M. Windt, AIChE J., 2012, 58, 2830–2842 CrossRef CAS.
- H. N. Stiles and R. Kandiyoti, Fuel, 1989, 68, 275–282 CrossRef CAS.
- J. Hayashi, S. Amamoto, K. Kusakabe and S. Morooka, Energy Fuels, 1996, 9, 290–294 CrossRef.
- E. J. Shin, M. R. Nimlos and R. J. Evans, Fuel, 2001, 80, 1697–1709 CrossRef CAS.
- R. G. Graham, M. A. Bergougnou and B. A. Freel, Biomass Bioenergy, 1994, 7, 33–47 CrossRef CAS.
- Y. Oki, M. Ashizawa, S. Kajitani and Y. Zhang, Fuel, 2010, 89, 302–309 CrossRef.
- H. Böhm and H. Jander, Phys. Chem. Chem. Phys., 1999, 1, 3775–3781 RSC.
- J. Moon, J. Lee, U. Lee and J. Hwang, Bioresour. Technol., 2013, 133, 429–436 CrossRef CAS PubMed.
- S. Ma, Y. Tan and Y. Han, J. Nat. Gas Chem., 2011, 20, 440–435 Search PubMed.
- A. D. Paulsen, PhD Thesis, University of Massachusetts, 2014.
- X. Bai, P. Johnston and R. C. Brown, J. Anal. Appl. Pyrolysis, 2013, 99, 130–136 CrossRef CAS.
- T. Hosoya, H. Kawamoto and S. Saka, J. Anal. Appl. Pyrolysis, 2008, 83, 64–70 CrossRef CAS.
- M. B. Pecha, E. Terrell, J. I. Montoya, F. Stankovikj, L. J. Broadbelt, F. Chejne and M. Garcia-Perez, Ind. Eng. Chem. Res., 2017, 56, 9079–9089 CrossRef CAS.
- J. Montoya, B. Pecha, F. C. Janna and M. Garcia-Perez, J. Anal. Appl. Pyrolysis, 2017, 125, 69–82 CrossRef CAS.
- R. J. M. Westerhof, H. S. Nygård, W. P. M. van Swaaij, S. R. A. Kersten and D. W. F. Brilman, Energy Fuels, 2012, 26, 2274–2280 CrossRef CAS.
- A. Bharadwaj, L. L. Baxter and A. L. Robinson, Energy Fuels, 2004, 18, 1021–1031 CrossRef CAS.
- A. Bliek, W. M. Van Poelje, W. P. M. Van Swaaij and F. P. H. Van Beckum, AIChE J., 1985, 31, 1666–1681 CrossRef CAS.
- C. Di Blasi, AIChE J., 2002, 48, 2386–2397 CrossRef CAS.
- H. Thunman and B. Leckner, Biomass Bioenergy, 2002, 23, 47–54 CrossRef CAS.
- G. M. Wiggins, P. N. Ciesielski and C. S. Daw, Energy Fuels, 2016, 30, 4960–4969 CrossRef CAS.
- M. B. Pecha, M. Garcia-Perez, T. D. Foust and P. N. Ciesielski, ACS Sustainable Chem. Eng., 2017, 5, 1046–1053 CrossRef CAS.
- D. L. Pyle and C. A. Zaror, Chem. Eng. Sci., 1984, 39, 147–158 CrossRef CAS.
- J. Lédé and O. Authier, J. Anal. Appl. Pyrolysis, 2015, 113, 1–14 CrossRef.
- A. D. Paulsen, M. S. Mettler and P. J. Dauenhauer, Energy Fuels, 2013, 27, 2126–2134 CrossRef CAS.
- M. B. Pecha, J. I. Montoya, C. Ivory, F. Chejne and M. Garcia-Perez, Ind. Eng. Chem. Res., 2017, 56, 5185–5200 CrossRef CAS.
- J. Proano-Aviles, J. K. Lindstrom, P. A. Johnston and R. C. Brown, Energy Technol., 2017, 5, 189–195 CrossRef CAS.
- G. Flamant, J. D. Lu and B. Variot, J. Heat Transfer, 1994, 116, 652–659 CrossRef CAS.
- M. Sakin, F. Kaymak-Ertekin and C. Ilicali, J. Food Eng., 2009, 94, 344–349 CrossRef.
- S. Maduskar, G. G. Facas, C. Papageorgiou, C. L. Williams and P. J. Dauenhauer, ACS Sustainable Chem. Eng., 2018, 6, 1387–1399 CrossRef CAS.
- P. R. Solomon, M. A. Semo and E. M. Suuberg, Prog. Energy Combust. Sci., 1992, 18, 133–220 CrossRef CAS.
- X. Gong, Y. Yu, X. Gao, Y. Qiao, M. Xu and H. Wu, Energy Fuels, 2014, 28, 5204–5211 CrossRef CAS.
- A. V. Sepman and L. P. H. de Goey, Biomass Bioenergy, 2011, 35, 2903–2909 CrossRef CAS.
- S. S. Liaw, V. Haber Perez, S. Zhou, O. Rodriguez-Justo and M. Garcia-Perez, J. Anal. Appl. Pyrolysis, 2014, 109, 140–151 CrossRef CAS.
- K. J. A. Hogendoorn, E. Hoekstra, S. R. A. Kersten and W. P. M. van Swaaij, Chem. Eng. J., 2012, 191, 45–58 CrossRef.
- Ö. M. Koçkar, Ö. Onay and S. H. Beis, Renewable Energy, 2002, 26, 21–32 CrossRef.
- M. N. Islam, M. R. A. Beg and M. R. Islam, Renewable Energy, 2005, 30, 413–420 CrossRef.
- E. Hoekstra, W. P. M. Van Swaaij, S. R. A. Kersten and K. J. A. Hogendoorn, Chem. Eng. J., 2012, 187, 172–184 CrossRef CAS.
- S. Kersten and M. Garcia-Perez, Curr. Opin. Biotechnol., 2013, 24, 414–420 CrossRef CAS PubMed.
- G. L. Comstock, Wood Fiber, 1970, 1, 283–289 Search PubMed.
- D. W. Rutherford, R. L. Wershaw and L. G. Cox, Changes in Composition and Porosity Occurring During the Thermal Degradation of Wood and Wood Components, US Department of the Interior, US Geological Survey, 2004 Search PubMed.
- C. Brackmann, M. Aldén, P.-E. Bengtsson, K. O. Davidsson and J. B. Pettersson, Appl. Spectrosc., 2003, 57, 216–222 CrossRef CAS PubMed.
- S. R. A. Kersten, X. Wang, W. Prins and W. P. M. van Swaaij, Ind. Eng. Chem. Res., 2005, 44, 8773–8785 CrossRef CAS.
- D. S. Scott, P. Majerski, J. Piskorz and D. Radlein, J. Anal. Appl. Pyrolysis, 1999, 51, 23–37 CrossRef CAS.
- W. Shurong, F. Mengxiang, Y. Chunjiang, L. Zhongyang, C. Kefa, S. Wang, M. Fang, C. Yu, Z. Luo and K. Cen, China Particuol., 2005, 3, 136–140 CrossRef.
- A. V. Bridgwater, Biomass Bioenergy, 2012, 38, 68–94 CrossRef CAS.
- P. O. Okekunle, H. Watanabe, T. Pattanotai and K. Okazaki, J. Therm. Sci. Technol., 2012, 7, 1–15 CrossRef CAS.
- M. R. Hajaligol, PhD Thesis, Massachusetts Institute of Technology, 1980.
- M. Garcia-Perez, P. Lappas, P. Hughes, L. Dell, A. Chaala, D. Kretschmer and C. Roy, IFRF Combust. J., 2006, 1–27 Search PubMed.
- J. Kizito, R. Balasubramaniam, H. Nahra, J. Agui and D. Troung, in 47th AIAA Aerospace Sciences Meeting including The New Horizons Forum and Aerospace Exposition, Aerospace Research Central, Orlando, Florida, 2009, pp. 1–11 Search PubMed.
- M. M. Avulapati, L. C. Ganippa, J. Xia and A. Megaritis, Fuel, 2016, 166, 59–66 CrossRef CAS.
- A. R. Teixeira, K. G. Mooney, J. S. Kruger, C. L. Williams, W. J. Suszynski, L. D. Schmidt, D. P. Schmidt and P. J. Dauenhauer, Energy Environ. Sci., 2011, 4, 4306 RSC.
- E. Mura, P. Massoli, C. Josset, K. Loubar and J. Bellettre, Exp. Therm. Fluid Sci., 2012, 43, 63–70 CrossRef.
- S. Das, D. S. Kumar and S. Bhaumik, Appl. Therm. Eng., 2016, 96, 555–567 CrossRef CAS.
- S. Nordin, J. Nyren and E. Back, Text. Res. J., 1974, 44, 915–917 CrossRef.
- Y. Halpern and S. Patai, Isr. J. Chem., 1969, 7, 673–683 CrossRef CAS.
- O. P. Golova, Russ. Chem. Rev., 1975, 44, 687–697 CrossRef.
- J. Diebold and J. Scahill, Ablative pyrolysis of macroparticles of biomass, in Proceedings of Specialists’ Workshop on fast Pyrolysis of Biomass, Copper Mountain, Springer Netherlands, Copper Mountain, 1985 Search PubMed.
- J. Lédé, J. Panagopoulos, H. Z. Li and J. Villermaux, Fuel, 1985, 64, 1514–1520 CrossRef.
- A. D. Pouwels, G. B. Eijkel, P. W. Arisz and J. J. Boon, J. Anal. Appl. Pyrolysis, 1989, 15, 71–84 CrossRef.
- O. Boutin, M. Ferrer and J. Lédé, J. Anal. Appl. Pyrolysis, 1998, 47, 13–31 CrossRef CAS.
- J. Piskorz, D. S. Scott and D. Radlein, in Frontiers of pyrolysis: biomass conversion and polymer recycling, Breckenridge-USA, 1995 Search PubMed.
- J. Piskorz, A. Vladars-Usas, D. Radlein, P. Majerski and D. Scott, J. Anal. Appl. Pyrolysis, 2000, 56, 145–166 CrossRef CAS.
- T. McGrath, V. Baliga, D. Miser, M. Hajaligol and R. Sharma, J. Anal. Appl. Pyrolysis, 2003, 66, 191–215 CrossRef.
- R. Bounaceur, B. Ouartassi, A. Dufour and A. Zoulalian, Chem. Eng. Res. Des., 2011, 89, 2136–2146 CrossRef.
- Q. Liu, S. Wang, K. Wang, X. Guo, Z. Luo and K. Cen, Acta Phys.-Chim. Sin., 2008, 24, 1957–1963 CrossRef CAS.
- H. Z. Li, J. Villermaux, H. Martin and J. Lédé, J. Anal. Appl. Pyrolysis, 1987, 10, 291–308 CrossRef.
- M. K. Koch, A. Voßnacke, J. Starflinger, W. Schütz and H. Unger, J. Aerosol Sci., 2000, 31, 1015–1028 CrossRef CAS.
- K. Butler, A numerical model for combustion of bubbling theroplastic materials in microgravity, National Institute of Standards and Technology, Boulder, CO, USA, 2002 Search PubMed.
- M. Shojaeian and A. Koşar, Exp. Therm. Fluid Sci., 2015, 63, 45–73 CrossRef CAS.
- T. J. Haas, M. R. Nimlos and B. S. Donohoe, Energy Fuels, 2009, 23, 3810–3817 CrossRef CAS.
- K. Voorhees, D. M. Blazsó, D. C. Schwarzinger, P. Carlsson, H. Lycksam, P. Gren, R. Gebart, H. Wiinikka and K. Iisa, J. Anal. Appl. Pyrolysis, 2013, 103, 278–286 CrossRef.
- G. Zhu, X. Zhu, Z. Xiao, R. Zhou and F. Yi, Waste Manage., 2012, 32, 2287–2293 CrossRef CAS PubMed.
- R. J. M. Westerhof, S. R. G. Oudenshoven, P. S. Marathe, M. Englen, M. Garcia-Pérez, Z. Wang and S. R. A. Kersten, React. Chem. Eng., 2016, 1, 555–566 RSC.
- J. Montoya, B. Pecha, F. C. Janna and M. Garcia-Perez, J. Anal. Appl. Pyrolysis, 2016, 122, 106–121 CrossRef CAS.
- J. Montoya, B. Pecha, F. C. Janna and M. Garcia-Perez, J. Anal. Appl. Pyrolysis, 2017, 124, 204–218 CrossRef CAS.
- T. Shoji, H. Kawamoto and S. Saka, J. Anal. Appl. Pyrolysis, 2014, 109, 185–195 CrossRef CAS.
- V. Mamleev, S. Bourbigot, M. Le Bras and J. Yvon, J. Anal. Appl. Pyrolysis, 2009, 84, 1–17 CrossRef CAS.
- V. Oja and E. M. Suuberg, J. Chem. Eng. Data, 1998, 43, 486–492 CrossRef CAS.
- E. Suuberg and V. Oja, Vapor pressures and heats of vaporization of primary coal tars, Federal Energy Technology Center, Morgantown, WV (US), Federal Energy Technology Center, Pittsburgh, PA (US), 1997, vol. 12 Search PubMed.
- V. Oja and E. M. Suuberg, J. Chem. Eng. Data, 1999, 44, 26–29 CrossRef CAS.
- W. L. H. Hallett and N. A. Clark, Fuel, 2006, 85, 532–544 CrossRef CAS.
- T. E. McGrath, W. G. Chan and M. R. Hajaligol, J. Anal. Appl. Pyrolysis, 2003, 66, 51–70 CrossRef CAS.
- I. Pastorova, R. E. Botto, P. W. Arisz and J. J. Boon, Carbohydr. Res., 1994, 262, 27–47 CrossRef CAS.
- J. Scheirs, G. Camino and W. Tumiatti, Eur. Polym. J., 2001, 37, 933–942 CrossRef CAS.
- H. Kawamoto, S. Horigoshi and S. Saka, J. Wood Sci., 2007, 53, 268–271 CrossRef CAS.
- M. Brebu and C. Vasile, Cellul. Chem. Technol., 2010, 44, 353 CAS.
- M. W. Smith, B. Pecha, G. Helms, L. Scudiero and M. Garcia-Perez, Biomass Bioenergy, 2017, 104, 17–35 CrossRef CAS.
- H. Watanabe, Energy Fuels, 2018, 32, 4248–4254 CrossRef CAS.
- J. Ratte, F. Marias, J. Vaxelaire and P. Bernada, J. Hazard. Mater., 2009, 170, 1023–1040 CrossRef CAS PubMed.
- N. Bech, P. A. Jensen, K. Dam-Johansen and M. B. Larsen, Biomass Bioenergy, 2009, 33, 999–1011 CrossRef CAS.
- P. K. Agarwal, Chem. Eng. Sci., 1991, 46, 1115–1127 CrossRef CAS.
- C. Di Blasi, Chem. Eng. Sci., 1996, 51, 2211–2220 CrossRef CAS.
- X. Bai and R. C. Brown, J. Anal. Appl. Pyrolysis, 2014, 105, 363–368 CrossRef CAS.
- M. S. Oh, W. A. Peters and J. B. Howard, AIChE J., 1989, 35, 775–792 CrossRef CAS.
- Q. Xiong, Y. Yang, F. Xu, Y. Pan, J. Zhang, K. Hong, G. Lorenzini and S. Wang, ACS Sustainable Chem. Eng., 2017, 5, 2783–2798 CrossRef CAS.
- Q. Xiong, F. Xu, Y. Pan, Y. Yang, Z. Gao, S. Shu, K. Hong, F. Bertrand and J. Chaouki, Chem. Eng. Process. - Process Intensif., 2018, 127, 206–212 CrossRef CAS.
- B. Moghtaderi, V. N. D. Fletcher and J. H. Kent, Fire Mater., 1997, 21, 7–16 CrossRef CAS.
- C. H. Bamford, J. Crank, D. H. Malan and A. H. Wilson, Math. Proc. Cambridge Philos. Soc., 1946, 42, 166 CrossRef CAS.
- A. M. Kanury and P. L. Blackshear, Combust. Sci. Technol., 1970, 2, 5–9 CrossRef CAS.
- H.-C. Kung, Combust. Flame, 1972, 18, 185–195 CrossRef.
- A. M. Kanury, Combust. Flame, 1972, 18, 75–83 CrossRef CAS.
- P. S. Maa and R. C. Bailie, Combust. Sci. Technol., 1973, 7, 257–269 CrossRef CAS.
- L. T. Fan, L.-S. Fan, K. Miyanami, T. Y. Chen and W. P. Walawender, Can. J. Chem. Eng., 1977, 55, 47–53 CrossRef CAS.
- E. J. Kansa, H. E. Perlee and R. F. Chaiken, Combust. Flame, 1977, 29, 311–324 CrossRef.
- C. A. Zaror and D. L. Pyle, Proc. - Indian Acad. Sci., Sect. C, 1982, 5, 269–285 CAS.
- H. A. Becker, A. M. Phillips and J. Keller, Combust. Flame, 1984, 58, 163–189 CrossRef CAS.
- M. J. J. Antal, Fuel, 1985, 64, 1483–1486 CrossRef CAS.
- W. C. R. Chan, M. Kelbon and B. B. Krieger, Fuel, 1985, 64, 1505–1513 CrossRef CAS.
- M. A. Hastaoglu and F. Berruti, Fuel, 1989, 68, 1408–1415 CrossRef CAS.
- S. S. Alves and J. L. Figueiredo, Chem. Eng. Sci., 1989, 44, 2861–2869 CrossRef CAS.
- J. Lédé, Biomass Bioenergy, 1994, 7, 49–60 CrossRef.
- J.-R. Richard and J. Saastamoinen, Combust. Flame, 1996, 106, 288–300 CrossRef.
- A. Sharma, V. Pareek, S. Wang, Z. Zhang, H. Yang and D. Zhang, Comput. Chem. Eng., 2014, 60, 231–241 CrossRef CAS.
- M. Bellais, PhD Thesis, Royal Institute of Technology, Stockholm, 2007.
- X. Wang, S. R. A. Kersten, W. Prins and W. P. M. van Swaaij, Ind. Eng. Chem. Res., 2005, 44, 8786–8795 CrossRef CAS.
- Y. Zeng and C. F. F. Lee, Proc. Combust. Inst., 2007, 31 II, 2185–2193 CrossRef.
- M. B. Pecha, E. Ramirez, G. M. Wiggins, D. Carpenter, B. Kappes, S. Daw and P. N. Ciesielski, Energy Fuels, 2018, 32, 10683–10694 CrossRef CAS.
- E. Leonardi, G. de Vahl Davis, R. K. K. Yuen and G. H. Yeoh, Int. J. Heat Mass Transfer, 2007, 50, 4371–4386 CrossRef.
- A. Mahmoudi, I. Mejri, M. A. Abbassi and A. Omri, Int. J. Math. Comput. Phys. Quantum Eng., 2014, 8, 668–677 Search PubMed.
- G. Gentile, P. E. A. Debiagi, A. Cuoci, A. Frassoldati, E. Ranzi and T. Faravelli, Chem. Eng. J., 2017, 321, 458–473 CrossRef CAS.
- Y. Sezen, Int. J. Heat Mass Transfer, 1989, 32, 1992–1987 CrossRef CAS.
- L. Ghazaryan, PhD Thesis, University of Twente, 2000.
| This journal is © The Royal Society of Chemistry 2019 |