Impact of calcium levels on lipid digestion and nutraceutical bioaccessibility in nanoemulsion delivery systems studied using standardized INFOGEST digestion protocol
Yunbing
Tan
a,
Ruyi
Li
b,
Hualu
Zhou
 a,
Jinning
Liu
a,
Jorge
Muriel Mundo
a,
Ruojie
Zhang
a and
David Julian
McClements
a,
Jinning
Liu
a,
Jorge
Muriel Mundo
a,
Ruojie
Zhang
a and
David Julian
McClements
 *a
*a
aDepartment of Food Science, University of Massachusetts Amherst, Amherst, MA 01003, USA. E-mail: mcclements@foodsci.umass.edu
bState Key Laboratory of Food Science and Technology, Nanchang University, 8 Nanchang, Jiangxi 330047, PR China
First published on 9th December 2019
Abstract
Recently, the standardized in vitro digestion model (“INFOGEST method”) used to evaluate the gastrointestinal fate of foods has been revised and updated (Brodkorb et al., 2019, Nat. Protoc., 2019, 14, 991–1014). Under fed state conditions, the calcium level used in this model is fixed and relatively low: 0.525 mM. In practice, the calcium concentration in the human gut depends on the nature of the food consumed and may vary from person-to-person. For this reason, we examined the impact of calcium concentration on the gastrointestinal fate of a model nutraceutical delivery system. The effect of calcium level (0.525–10 mM) on lipid digestion and β-carotene bioaccessibility in corn oil-in-water nanoemulsion was investigated using the INFOGEST method. At all calcium levels, the lipids were fully digested, but this could only be established by carrying out a back titration (to pH 9) at the end of the small intestine phase. Conversely, the bioaccessibility of β-carotene decreased with increasing calcium levels: from 65.5% at 0.525 mM Ca2+ to 23.7% at 10 mM Ca2+. This effect was attributed to the ability of the calcium ions to precipitate the β-carotene-loaded mixed micelles by forming insoluble calcium soaps. The ability of calcium ions to reduce carotenoid bioaccessibility may have important nutritional implications. Our results show that the bioaccessibility of hydrophobic carotenoids measured using the INFOGEST method is highly dependent on the calcium levels employed, which may have important consequences for certain calcium-rich foods. Moreover, we have shown the importance of carrying out a back titration to accurately measure free fatty acid levels in the presence of low calcium levels.
1. Introduction
Research on food fortification with nutraceuticals has increased recently in response to consumers’ growing interest in functional foods and beverages with potentially health-promoting properties.1,2 Many nutraceuticals cannot simply be incorporated into foods because of solubility, stability, or sensory issues. Various kinds of colloidal delivery systems have therefore been fabricated to overcome these problems.3 Moreover, these delivery systems are being designed to exhibit specific functional attributes, such as controlled release, enhanced bioavailability, increased potency, synergistic effects, or targeted release.4–6 To test the potential efficacy of these delivery systems, both in vitro and in vivo methods have been developed.7,8 These methods are essential for identifying the physicochemical processes that occur as a delivery system passes through the gastrointestinal tract (GIT). This information can then be used to identify the optimum composition and structure of colloidal delivery systems for specific applications.3 In general, the bioavailability of nutraceuticals within the GIT depends on three main factors: bioaccessibility, absorption, and transformation.9 For highly hydrophobic nutraceuticals, like carotenoids, the bioaccessibility is often the rate limiting step that determines the overall bioavailability. The bioaccessibility depends on the liberation of the nutraceutical from the food matrix and then its solubilization within the mixed micelle phase. The bioaccessibility of hydrophobic nutraceuticals is usually enhanced by increasing the fat content within the food matrix, as this leads to the formation of more mixed micelles to solubilize the nutraceuticals.10,11In vivo human feeding studies are the most accurate methods of determining the impact of specific colloidal delivery systems on the bioaccessibility and bioavailability of nutraceuticals.8 In these studies, the levels of nutraceuticals and their metabolites are typically measured in the bloodstream, urine, and/or feces over time. Despite their accuracy, however, human feeding studies are rarely used to test nutraceutical bioavailability because of their high cost, long time, potential safety issues, and ethical concerns.7,12 Moreover, they do not provide any insights into the physicochemical mechanisms involved. For this reason, in vitro digestion models have been developed that are relatively simple and inexpensive to perform, and allow researchers to rapidly screen many different formulations during the early stages of delivery system development.13 A recent review article has highlighted that there is often a good qualitative correlation between the results obtained using in vivo and in vitro methods, which supports the utilization of the latter for testing nutraceutical bioaccessibility.8
A number of in vitro digestion protocols have been developed over the past decade to test the gastrointestinal fate of foods, which vary in their attempts to mimic the complex physiochemical and physiological processes occurring inside the human gut.13,14 These models typically come to some compromise between accurately simulating the complexity of the human gut and having a protocol that is inexpensive, simple, rapid, and repeatable. Recently, there have been attempts to standardize the in vitro digestion models used in both the food and pharmaceutical areas.15,16 The advantage of having a standardized model is that results on different samples or from different laboratories can be compared. In the food industry, the most well-established and widely-used in vitro digestion model is that developed by the INFOGEST consortium.16 Despite its widespread use, this method often leads to widely differing results when studying lipid digestion in foods, ranging from almost complete digestion17 to only modest digestion.18 In reality, humans are known to digest and absorb the vast majority of the lipids (triacylglycerols) they consume. It is, therefore, important to establish the origin of the observed variations in lipid digestion determined using the INFOGEST method. Moreover, this static in vitro digestion procedure has recently been refined to improve its accuracy and reliability,13 and so it is useful to examine the efficacy of this refined method for studying lipid digestion.
One factor that is known to play an important role in lipid digestion in foods is the level of calcium present.19,20 Calcium may act as both a promoter or inhibitor of lipid digestion depending on the system.21 On one hand, cationic calcium ions can promote flocculation of oil droplets, especially in emulsions stabilized by anionic emulsifiers, resulting in less surface area for lipolysis reaction. On the other hand, calcium ions can facilitate lipid digestion due to their ability to act as co-factors for pancreatic lipase and the ability to precipitate free fatty acids generated at the lipid droplet surfaces. There have, therefore, been several attempts at understanding the impact of calcium ions on lipid digestion.19,20
The digestive conditions within the INFOGEST method are based on the fed state of human digestion. Nevertheless, the calcium level used in the simulated intestinal fluids (0.6 mM) is considerably below those reported in human intestinal fluids.22,23 Besides, some foods contain high levels of calcium, such as cheeses and milk, which can lead to much higher calcium levels (up to 10 mM) in the small intestine during digestion.23–25 These relatively high calcium levels may interfere with the lipid digestion process.
The objective of the current study was to examine the impact of calcium levels on the digestion of lipids in nanoemulsion-based delivery systems using the INFOGEST method. Moreover, we also examined the impact of calcium levels on the bioaccessibility of a model hydrophobic nutraceutical (β-carotene) encapsulated within the nanoemulsions. This carotenoid has been associated with several diet-related health benefits due to its pro-vitamin A and antioxidant activities.26 Structurally, β-carotene consists of two beta-rings held together by a long polyene chain, and hence it is a highly hydrophobic polyunsaturated molecule that has low water-solubility and is highly prone to oxidation. A considerable research effort has, therefore, been carried out to develop colloidal delivery systems to encapsulate and protect this carotenoid, as well as to boost its bioavailability.27,28 Nevertheless, the fate of these systems within the INFOGEST method has rarely been examined.
In summary, the main objective of this research is to investigate the effects of different calcium levels on lipid digestion and β-carotene bioaccessibility of a nanoemulsion-based delivery system using the INFOGEST method. The physical and structural properties of the nanoemulsion were measured during in vitro digestion to identify the possible underlying mechanisms involved. The information generated by this research should lead to a better understanding of the lipid digestion process, as well as to the creation of more efficacious nutraceutical delivery systems. Moreover, it provides valuable insights into the critical role that calcium ions play in the standardized INFOGEST model.
2. Materials and methods
2.1 Materials
Corn oil (Mazola, ACH Food Companies, Memphis, TN, USA) was obtained from a supermarket. Whey protein isolate (WPI) was provided by Agropur Inc. (Le Sueur, MN, USA). β-carotene (Type I, synthetic, ≥93% in UV); porcine gastric mucin, pepsin from porcine gastric mucosa (250 units per mg), pancreatin from porcine pancreas, porcine lipase (100–400 units per mg), porcine bile extract, and bile acid assay kit were purchased from the Sigma-Aldrich Company (St Louis, MO, USA). Ethyl alcohol (ACS/USP grade) was purchased from Pharmco Products, Inc. (Shelbyville, KY, USA). All other chemicals and reagents (analytical grade or higher) were purchased from either Sigma-Aldrich or Fisher Scientific (Pittsburgh, PA, USA). Double distilled water was used to prepare all solutions and nanoemulsions. It was produced using a laboratory water-purification system (Nanopure Infinity, Barnstaeas International, Dubuque, IA, USA).2.2 Preparation of nanoemulsion delivery system
The nanoemulsions were prepared using a method described previously.10 The aqueous phase, was prepared by dissolving emulsifier (WPI) in phosphate buffer solution (5 mM, pH 7.0) to reach a level of 1.0 wt% in the final nanoemulsion. The oil phase was prepared by dissolving β-carotene (0.1 wt% of oil phase) in corn oil by sonicating for 1 min at 40 kHz followed by 5 min incubation at 50 °C for three times. The oil and aqueous phases were blended (10![[thin space (1/6-em)]](https://www.rsc.org/images/entities/char_2009.gif) :
:![[thin space (1/6-em)]](https://www.rsc.org/images/entities/char_2009.gif) 90 w/w) using a high-speed mixer at 10
90 w/w) using a high-speed mixer at 10![[thin space (1/6-em)]](https://www.rsc.org/images/entities/char_2009.gif) 000 rpm for 2 min to form a coarse emulsion (M133/1281-0, Biospec Products, Inc., ESGC, Switzerland). This emulsion was then passed 5-times through a microfluidizer at an operation pressure of 12
000 rpm for 2 min to form a coarse emulsion (M133/1281-0, Biospec Products, Inc., ESGC, Switzerland). This emulsion was then passed 5-times through a microfluidizer at an operation pressure of 12![[thin space (1/6-em)]](https://www.rsc.org/images/entities/char_2009.gif) 000 psi to form the carotenoid-enriched nanoemulsions (M110Y, Microfluidics, Newton, MA).
000 psi to form the carotenoid-enriched nanoemulsions (M110Y, Microfluidics, Newton, MA).
2.3 Particle size characterization
The particle size distribution was determined using laser diffraction (Mastersizer 2000, Malvern Instruments Ltd, Malvern, Worcestershire, UK). Before measurements, the samples were diluted using appropriate buffer solutions and then stirred (1200 rpm) to ensure they were homogeneous and to avoid multiple scattering effects. Phosphate buffer solution (5 mM, pH 7.0) was used for dilution of samples obtained from the initial, oral and small intestine phases. Acidified distilled water (pH 3) was used to dilute the gastric samples. The refractive index values of the oil and aqueous phases were taken to be 1.472 and 1.33, respectively.The particle size of the samples from the micelle phases were measured by dynamic light scattering (Zetasizer Nano ZS, Malvern Instruments Ltd, Malvern, Worcestershire, UK). Phosphate buffer solution (5 mM, pH 7.0) was used to dilute samples so as to avoid multiple scattering.
2.4 Surface potential
The surface potential (ζ-potential) was measured by particle electrophoresis (Zetasizer Nano ZS, Malvern Instruments). The initial nanoemulsion and the samples from the small intestine phase were diluted with phosphate buffer (5 mM, pH 7.0). The samples obtained from the oral and gastric phases were diluted using the corresponding simulated digestive fluids with adjustment to the samples’ pH (pH 7 and 3 respectively).2.5 Confocal microscopy
Microstructure images were measured according to a method reported previously.29 Prior to measurement, Nile red solution (1 mg mL−1 in ethanol) was mixed with the samples at a ratio of 1![[thin space (1/6-em)]](https://www.rsc.org/images/entities/char_2009.gif) :
:![[thin space (1/6-em)]](https://www.rsc.org/images/entities/char_2009.gif) 20 (v/v) to dye the oil phase. A small droplet of the dyed sample was placed on a microscope slide and covered by a coverslip. The excitation and emission wavelengths were set at 543 and 605 nm, respectively. A 60× oil immersion objective lens was used to obtain images of the samples using a fluorescence confocal laser scanning microscope (Nikon D-Eclipse C1 80i, Nikon, Melville, NY, USA). The images were acquired and stored using the microscopes image analysis software (NIS-Elements, Nikon, Melville, NY).
20 (v/v) to dye the oil phase. A small droplet of the dyed sample was placed on a microscope slide and covered by a coverslip. The excitation and emission wavelengths were set at 543 and 605 nm, respectively. A 60× oil immersion objective lens was used to obtain images of the samples using a fluorescence confocal laser scanning microscope (Nikon D-Eclipse C1 80i, Nikon, Melville, NY, USA). The images were acquired and stored using the microscopes image analysis software (NIS-Elements, Nikon, Melville, NY).
2.6 In vitro digestion
The updated INFOGEST in vitro digestion method13 was used in this paper with some slight modifications. Before digestion, the activity of all enzymes and the concentration of the porcine bile extract were determined. The whole process of the digestion procedure was carried out at 37 °C, and all solutions were preheated prior to use to avoid temperature fluctuations. A test sample was obtained by diluting the nanoemulsion with phosphate buffer solution (5 mM, pH 7.0) to an oil concentration of 5%.![[thin space (1/6-em)]](https://www.rsc.org/images/entities/char_2009.gif) :
:![[thin space (1/6-em)]](https://www.rsc.org/images/entities/char_2009.gif) 1 (v/v) with simulated saliva fluids, which contained 0.00375 g mL−1 mucin and 1.5 mM CaCl2 (H2O)2, to form the oral bolus. The resulting sample was then incubated for 2 min in a mechanical shaking device (Model 4080, New Brunswick Scientific, New Brunswick, NJ, USA) at a speed of 100 rpm.
1 (v/v) with simulated saliva fluids, which contained 0.00375 g mL−1 mucin and 1.5 mM CaCl2 (H2O)2, to form the oral bolus. The resulting sample was then incubated for 2 min in a mechanical shaking device (Model 4080, New Brunswick Scientific, New Brunswick, NJ, USA) at a speed of 100 rpm.
![[thin space (1/6-em)]](https://www.rsc.org/images/entities/char_2009.gif) :
:![[thin space (1/6-em)]](https://www.rsc.org/images/entities/char_2009.gif) 1 (v/v) with the pre-warmed simulated gastric fluids, which contained pepsin (2000 U mL−1 in the final digestion mixture) and 0.15 mM CaCl2 (H2O)2, and incubated under shaking at pH 3.0 for 2 h. This process led to the formation of gastric chyme.
1 (v/v) with the pre-warmed simulated gastric fluids, which contained pepsin (2000 U mL−1 in the final digestion mixture) and 0.15 mM CaCl2 (H2O)2, and incubated under shaking at pH 3.0 for 2 h. This process led to the formation of gastric chyme.
![[thin space (1/6-em)]](https://www.rsc.org/images/entities/char_2009.gif) :
:![[thin space (1/6-em)]](https://www.rsc.org/images/entities/char_2009.gif) 1 (v/v) with simulated intestinal fluids containing pancreatic enzymes, 10 mM bile salts and CaCl2 (H2O)2, and incubated at pH 7 for a further 2 h. The enzyme activity was achieved by adding enough pancreatin to reach a trypsin activity of 100 U mL−1 in the final mixture, as well as additional pancreatic lipase to reach a lipase activity of 2000 U mL−1 in the final mixture. The INFOGEST method suggests 0.6 mM CaCl2 (H2O)2 in the intestinal fluids, which results in 0.525 mM in the final solution after mixing with the gastric chyme. The effect of calcium level was investigated by also using a series of other calcium concentrations (1.5, 5, 7.5 and 10 mM in the final mixture).
1 (v/v) with simulated intestinal fluids containing pancreatic enzymes, 10 mM bile salts and CaCl2 (H2O)2, and incubated at pH 7 for a further 2 h. The enzyme activity was achieved by adding enough pancreatin to reach a trypsin activity of 100 U mL−1 in the final mixture, as well as additional pancreatic lipase to reach a lipase activity of 2000 U mL−1 in the final mixture. The INFOGEST method suggests 0.6 mM CaCl2 (H2O)2 in the intestinal fluids, which results in 0.525 mM in the final solution after mixing with the gastric chyme. The effect of calcium level was investigated by also using a series of other calcium concentrations (1.5, 5, 7.5 and 10 mM in the final mixture).
The release of the FFA was measured using a pH stat method, and calculated from the amount of NaOH needed for titration (857 Titrando, Metrohm USA Inc., Hillsborough, FL, USA). During the small intestine phase, the volume of NaOH solution required to maintain the system at pH 7.0 was measured. Afterwards, a back titration to pH 9.0 was applied to neutralize any non-ionized FFAs. A blank test was carried out using a blank sample with the same composition as the test sample, but no oil, to subtract the contribution of any non-lipid components to the digestion profiles. After digestion, the separation of the micelle and sediment phases was achieved by centrifugation (Sorvall Lynx 4000 centrifuge, Thermo Scientific, Waltham, MA, USA) of the intestine samples at 30![[thin space (1/6-em)]](https://www.rsc.org/images/entities/char_2009.gif) 970g (18
970g (18![[thin space (1/6-em)]](https://www.rsc.org/images/entities/char_2009.gif) 000 rpm) for 50 min at 4 °C.
000 rpm) for 50 min at 4 °C.
2.7 Extraction and measurement of β-carotene
The β-carotene concentrations in the initial nanoemulsion, total intestine digesta, mixed micelles, and sediment were extracted and measured according to a published study30 with slight modification. To extract β-carotene, an aliquot of 0.5 ml sample was mixed with 1.2 ml of a hexane![[thin space (1/6-em)]](https://www.rsc.org/images/entities/char_2009.gif) :
:![[thin space (1/6-em)]](https://www.rsc.org/images/entities/char_2009.gif) isoproperal (2
isoproperal (2![[thin space (1/6-em)]](https://www.rsc.org/images/entities/char_2009.gif) :
:![[thin space (1/6-em)]](https://www.rsc.org/images/entities/char_2009.gif) 3, v/v) mixture. The resulting system was then centrifuged (Minispin centrifuge, Eppendorf North America, Inc., Hauppauge, NY, USA) at 6000 rpm for 2 min. The supernatant was collected and measured at 450 nm by a UV-visible spectrophotometer (Genesys 150, Thermo Scientific, Waltham, MA, USA).
3, v/v) mixture. The resulting system was then centrifuged (Minispin centrifuge, Eppendorf North America, Inc., Hauppauge, NY, USA) at 6000 rpm for 2 min. The supernatant was collected and measured at 450 nm by a UV-visible spectrophotometer (Genesys 150, Thermo Scientific, Waltham, MA, USA).
The bioaccessibility, recovery, and stability (%) of β-carotene were then calculated using the following equations:
Here, Cmicelle, Csediment, Cdigesta, and Cinitial are the concentrations of β-carotene in samples collected from the mixed micelle, sediment, total intestine digesta, and initial nanoemulsion, respectively.
2.8 Statistical analysis
The digestion process and all measurements were carried out in triplicate, while nanoemulsion preparation was carried out in duplicate. The means and standard deviations were calculated by combining the data from different measurements. Depend on the homogeneity of the variances, either Duncan test (homogenous) or Dunnett's T3 test (inhomogeneous) was used in the analysis of variance (ANOVA) at a confidence level of 95% to determine the statistical differences among treatments. Statistical calculation was finished by the SPSS software (IBM Corp., Armonk, NY, USA).3. Results and discussion
3.1 Gastrointestinal fate
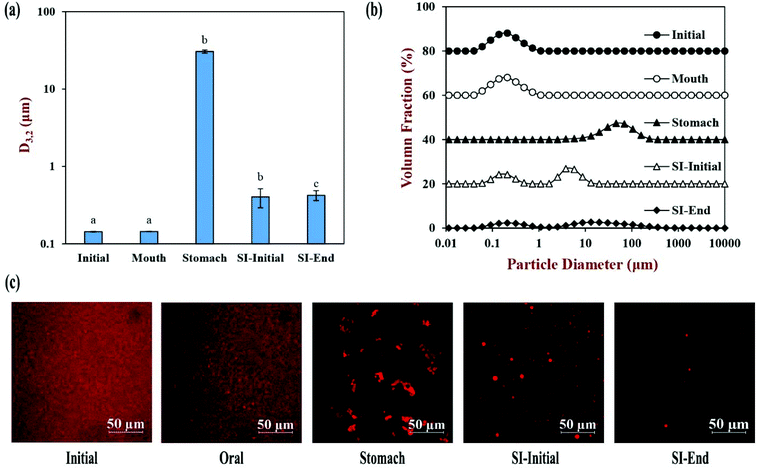
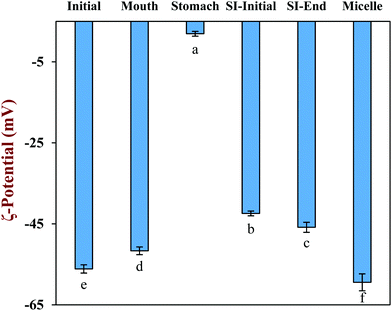
The physical and structural properties of the β-carotene encapsulated nanoemulsions were measured during each stage of the in vitro GIT model using the INFOGEST method. The initial nanoemulsion consisted of 1% WPI and 10% corn oil with a β-carotene level of 0.1% in the oil phase. The nanoemulsion had a monomodal particle size distribution with a mean particle diameter (D3,2) of 143.5 ± 1.3 nm (Fig. 1a and b). The confocal microscopy images showed that the nanoemulsion contained a dispersion of fine oil droplets that were evenly distributed throughout the sample (Fig. 1c). The protein-coated oil droplets had a high negative surface potential (−56.1 ± 1.0 mV) because the pH of the nanoemulsion (pH 7) was higher than the isoelectric point of the WPI (around pH 5) (Fig. 2). The nanoemulsion formed was physically and structurally similar to that of our previous studies.31,32 These results showed that the microfluidization protocol and emulsifier used were successful at forming β-carotene-fortified nanoemulsions.The nanoemulsion was then subjected to the simulated oral phase. The light scattering experiments suggested that the particle size of the nanoemulsions remained fairly similar after exposure to the simulated oral conditions (Fig. 1a), but the confocal microscopy images showed that some of the oil droplets had flocculated (Fig. 1c). The magnitude of the negative surface potential on the protein-coated oil droplets decreased significantly (p < 0.05) (Fig. 2). These effects might have occurred because the change in ionic strength altered the electrostatic interactions, or the presence of mucin promoted depletion or bridging flocculation.33
The nanoemulsion was then exposed to simulated gastric conditions by adjusting the pH to 3.0 and adding pepsin to reach a level of 2000 U mL−1 in the final mixture. The physical properties of the nanoemulsion changed appreciably within this stage. The mean particle diameter increased to over 30 μm, and the position of the peak in the particle size distribution shifted upwards, with most of the particles being in the range from 1 to 300 μm (Fig. 1a and b). The confocal microscopy images indicated that excessive droplet flocculation occurred under simulated gastric conditions (Fig. 1c). Additionally, the negative surface potential of the particles in the nanoemulsion decreased to around −1.9 mV. Moreover, visual observations showed that the nanoemulsions became unstable to phase separation, with a thin cream layer being seen on the top and a clear serum layer at the bottom (Fig. 3).
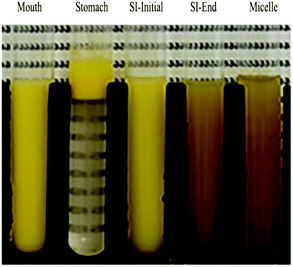 | ||
| Fig. 3 Photos of corn oil nanoemulsion during simulated gastrointestinal tract (GIT) digestion. Abbreviation: small intestine (SI). | ||
Previous studies suggest that the flocculation state of oil droplets when they first enter the small intestine phase impacts their digestion: when the droplets are highly flocculated, the lipase is unable to easily access the surfaces of all the oil droplets, thereby inhibiting digestion.34 For this reason, we adjusted the gastric chyme to pH 7.0 before adding the other intestinal components (calcium, bile salt, and pancreatic enzymes) so as to focus on the impact of pH on the flocculation state of the oil droplets. The sample obtained by this process is referred to as the “SI-Initial phase”. The light scattering and microscopy measurements indicated that there was a pronounced decrease in droplet flocculation when the system was adjusted to pH 7 (Fig. 1). This effect can mainly be attributed to an increase in the negative charge on the protein-coated oil droplets (Fig. 2), which recovered to a value fairly similar to that of the oral phase. Thus, the increased electrostatic repulsion between the oil droplets in the emulsions reduced the degree of flocculation. Nevertheless, there was evidence of some large individual oil droplets present in the SI-initial phase, which suggests that droplet coalescence as well as flocculation had occurred during incubation in the gastric phase. Visual observations of the nanoemulsions in the SI-initial phase showed that they consisted of homogenous nanoemulsions without any obvious phase separation (Fig. 3). The good stability of the nanoemulsions to gravitational separation can be attributed to the fact that most of the individual oil droplets were relatively small and not flocculated.
The nanoemulsions were then exposed to the full intestinal phase by adding the appropriate levels of digestive enzymes, bile salts, and mineral ions. The confocal microscopy images (Fig. 1c) and pH stat measurements (see later) indicated that the majority of the lipids had been digested by the end of the small intestine phase. Visually, the nanoemulsions had a watery-turbid appearance, with no cream layer at the top, again suggesting that most of the oil droplets had been fully digested (Fig. 3). The particle size distribution measurements indicated that the digested samples contained a broad range of different sized particles, which were probably micelles, liposomes, insoluble calcium soaps, and protein aggregates (Fig. 1b). The ζ-potential of the digested samples was highly negative, which can be attributed to the presence of various kinds of anionic species, such as proteins, peptides, bile salts, phospholipids, and free fatty acids (Fig. 2).35
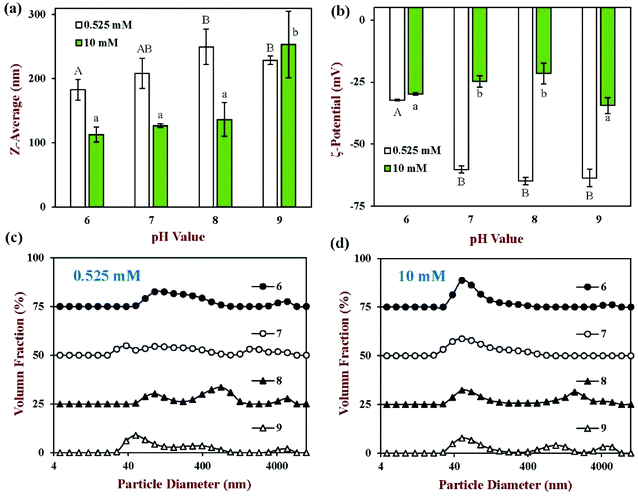
The properties of the particles in the mixed micelle sample (0.525 mM calcium, pH 7) were also measured (Fig. 2 and 4). Micelles are too small to be detected by static light scattering and so dynamic light scattering was used instead. The mean particle diameter of the mixed micelle phase was around 208 nm (Fig. 4a), which is considerably larger than the dimensions of individual micelles (<10 nm).36,37 This phenomenon is probably because the samples also contained liposomes and calcium soaps.38–40 The magnitude of the negative ζ-potential on the particles in the mixed micelle phase was relatively high (−59.4 mV), which can again be attributed to the presence of various anionic species (Fig. 2). The mixed micelle solution was slightly turbid suggesting that it contained particles large enough to scatter light strongly (Fig. 3).
Overall, the physical and structural properties of the nanoemulsions during passage through the INFOGEST GIT model were fairly similar to those found using other in vitro digestion models.31,41 The main exception was that the micelle phase formed after lipid digestion was more turbid in the INFOGEST method.
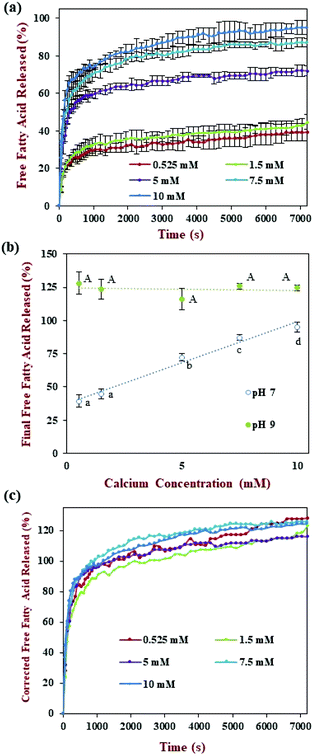
The release of FFAs over time was measured during the small intestine phase using the pH-stat method by adding enough alkaline solution to maintain a neutral pH (Fig. 5a). Similar to previous studies, the amount of FFA increased greatly during the first 1000 s, then gradually increased afterwards.42 However, under the fed conditions used in the standardized INFOGEST method, which employed only 0.525 mM calcium, the fraction of FFAs released by the end of the small intestine phase was only 39.4% (Fig. 5b). This value is much lower than that reported (>90%) for similar nanoemulsions tested using an alternative in vitro digestion method.31 This phenomenon may have occurred because most of the FFAs were non-ionized at neutral pH when low calcium levels were used.22 For this reason, we used an additional back-titration step to pH 9 to detect the total number of FFAs released. In this case, a much higher final FFA value was reached, i.e., around 128% (Fig. 5b). Indeed, the final FFA value was considerably higher than the expected value of 100%, assuming that two FFAs were released per triacylglycerol molecule. Several other studies have reported FFA values >100% at the end of lipid digestion.22,43 This effect might have been attributed to the production of more than two FFAs per triacylglycerol due to alkaline hydrolysis of the triacylglycerol molecules at high pH values.44
Overall, this study shows that a high proportion of the FFAs generated during the small intestine phase under neutral conditions are non-ionized, and so could not be titrated by sodium hydroxide. Interestingly, this effect is not seen in alternative in vitro digestion models that use much higher calcium levels, which may have been because the presence of the calcium ions altered the equilibrium between the ionized and non-ionized states of the FFAs. In summary, for the INFOGEST method, a back titration to pH 9 is required to measure the faction of non-ionized FFAs present in the samples after digestion.
The β-carotene concentration in the intestinal samples, as well as its distribution in the mixed micelle and sediment phases, was also measured at the calcium level (0.525 mM) normally used in the INFOGEST method (Fig. 6a). Most of the β-carotene was solubilized in the mixed micelle phase after digestion, leading to a relatively high bioaccessibility (65.5%) (Fig. 6b), which is in agreement with previous studies.41 The recovery rate of the carotenoid was around 97.9% (Fig. 6b), which indicates that most of the β-carotene in the intestinal digesta was located in either the mixed micelle or sediment phases. The stability of the β-carotene encapsulated within the nanoemulsions was relatively high (84.4%), which indicated that the carotenoid was relatively stable to chemical degradation within the simulated GIT.
3.2 Effects of calcium levels
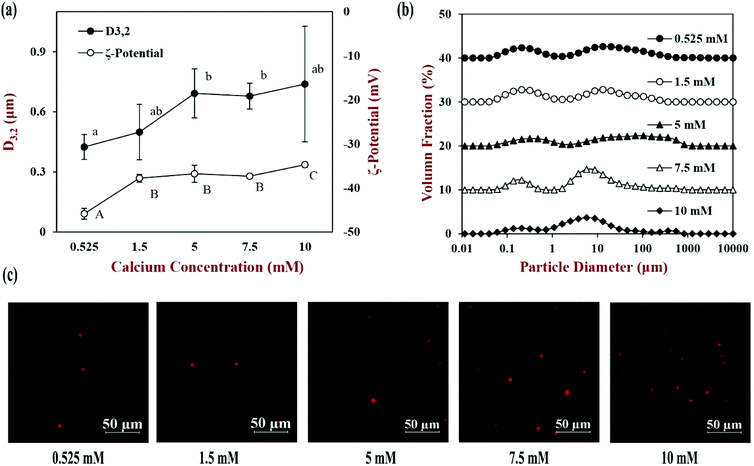
The calcium level used in the INFOGEST method (0.525 mM) is at the low end of reported physiological levels.22 As mentioned earlier, in the fasted state, the calcium levels reported in human duodenal fluids range from about 0.5 to 3 mM. Moreover, the calcium levels in foods and individuals may vary considerably depending on their diet and physiology. For this reason, the effect of different calcium concentrations (0.525, 1.5, 5, 7.5 and 10 mM) on lipid digestion and carotenoid bioaccessibility was investigated. It should be noted that we only altered the calcium concentration in the small intestine phase, while the level in the oral and gastric phases was kept constant. The impact of the calcium levels on the physical and structural properties of the intestinal samples were measured (Fig. 7).At low calcium levels (0.525 and 1.5 mM), the D3,2 values were 0.424 and 0.499 μm respectively, and the particle size distributions were bimodal. The confocal microscopy images indicated that there were only a few relatively large oil-rich particles present in these samples after digestion. These particles may have been oil droplets formed by the non-ionized free fatty acids. When the calcium level was increased to 5 mM, the mean particle diameters increased significantly (p < 0.05) to 0.692 μm and the particle size distribution broadened. The confocal microscopy images indicated that there were some large spherical lipid-rich particles, as well as many smaller irregular lipid-rich particles. When the calcium level was increased further to 7.5 and 10 mM, the D3,2 values remained fairly similar, but there was a change in the shape of the particle size distribution. Besides, there were more particles of a ring shape or an irregular shape in the confocal images at these high calcium levels. We hypothesize that the cationic calcium ions promoted the aggregation of some of the small anionic mixed micelles, leading to the production of calcium soaps. Previous studies have also reported that high levels of calcium can promote the formation of insoluble calcium soaps.24,43
The surface potential of the particles in the digesta became increasingly less negative as the calcium ion level was increased (Fig. 7a). This effect is consistent with the binding of cationic calcium ions to the anionic mixed micelles. At sufficiently high calcium levels, the formation of calcium soaps may have been promoted because of the decrease in surface potential on the mixed micelles and the tendency for bridging to occur.
The release of FFAs during digestion in the small intestine phase (pH 7.0) was monitored by titration with sodium hydroxide using the pH stat method (Fig. 5a). The FFA release profiles of the nanoemulsion all followed a fairly similar pattern irrespective of the calcium levels used: there was a sharp increase during the first 1000 s followed by a gradual increase later. The fraction of titrated FFAs by the end of the digestion period increased from around 39% to 95% as the calcium concentration was increased from 0.525 to 10 mM. Interestingly, the final FFA value measured at pH 7 was linearly related to the calcium concentration (Fig. 5b). As discussed earlier, most FFAs generated during lipid digestion are not titratable at low calcium levels because they are in a non-ionized form.22 Therefore, a back titration to pH 9 was carried out after the small intestine phase to measure the total amount of FFAs produced. Under these conditions, all the samples were seen to be fully digested after the intestinal phase with a final FFA value ranging from 116 to 128%. This result highlights the critical importance of carrying out the back-titration step under the low calcium conditions used in the standardized INFOGEST method. The actual FFA release kinetics were determined by multiplying the measured values with a correction factor (C), which was defined as the ratio of the final FFA values measured at pH 9 and pH 7 (Fig. 5c). The corrected FFA release profiles indicate that the calcium level used had little impact on the lipid digestion curve. The calcium concentration used in the in vitro digestion model therefore appears to impact the ionization state of the FFAs, rather than the total amount of FFAs generated. We hypothesize that the calcium ions altered the ionization equilibrium of the carboxylic acid groups (2[–COOH] + Ca2+ ↔ Ca(–COO)2 + 2H+), thereby releasing the titratable protons. Thus, most FFAs could be titrated when higher calcium levels are employed in an in vitro GIT model. Alternatively, this result suggests that the in vitro digestion model could be simplified (no back titration) if relatively high calcium levels (10 mM) are used in the small intestine phase.
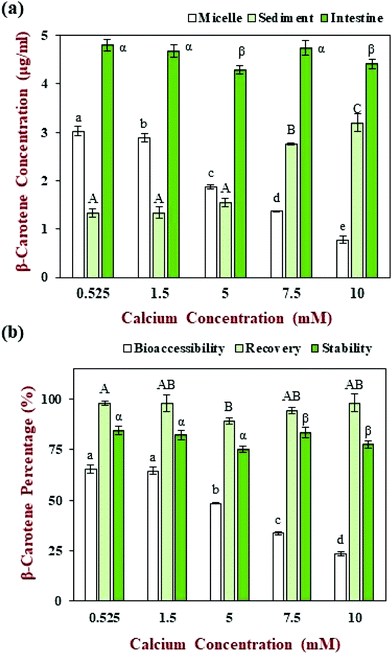
The β-carotene concentrations of the whole small intestine samples, as well as those of the micelle and sediment phases, were measured at different calcium levels (Fig. 6a). The β-carotene concentrations in the whole small intestinal samples did not change appreciably (4.3 to 4.8 μg ml−1) when the calcium level was changed. Moreover, the β-carotene remained relatively stable under different calcium level during the GIT (75.3 to 84.4%) (Fig. 6b), which suggests that calcium do not have a major impact on the chemical stability of the carotenoid during the in vitro GIT digestion. The recovery of the β-carotene from the micelle and sediment phases combined was between about 89.2 to 98.2% of that of intestinal phase (Fig. 6b), which indicated that most of the β-carotene was released from the oil phase after digestion.
Nevertheless, the bioaccessibility of β-carotene decreased from 65.5 to 23.7% as the calcium concentration was increased from 0.525 to 10 mM (Fig. 6b). In particular, the β-carotene concentration in the micelle phase decreased from around 3.02 to 0.78 μg ml−1, what in the sediment phase increased from around 1.32 to 3.20 μg ml−1 (Fig. 6a). This result indicates that there was a change in the location of the carotenoids within the digesta at the end of the small intestine phase. During lipid digestion, most of the encapsulated β-carotene should be released from the oil droplets and solubilized within the mixed micelles formed by bile salts and FFAs.12 In the presence of calcium ions, however, the micelles tend to aggregate and eventually form particles that are large enough to sediment to the bottom of the samples.31 Indeed, an increasing amount of sediment was observed in the samples as the calcium concentration was increased (Fig. 8a). As a result, some of the β-carotene-loaded mixed micelles are incorporated into insoluble calcium soaps, which decreases the measured bioaccessibility. These results show that the bioaccessibility of carotenoids is highly sensitive to the level of calcium present in the small intestine, which may have important practical applications. For instance, consumption of carotenoid-rich foods with calcium-rich foods could lead to a decrease in carotenoid bioaccessibility. Even so, it will be important to establish whether a similar effect is observed in vivo using animal or human feeding studies.
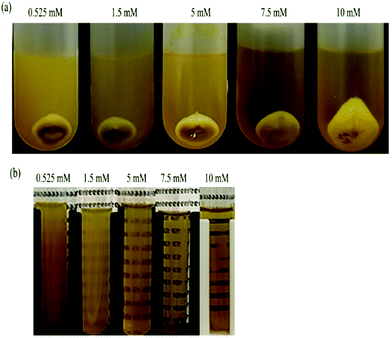 | ||
| Fig. 8 Photos of the samples from intestinal phase with different calcium levels: (a) sedimentation after centrifuge; (b) micelle phase. | ||
In addition, we also observed that the mixed micelle phase was highly turbid at lower calcium levels but became increasingly clear at higher calcium levels (Fig. 8b). This phenomenon may have occurred because there were a lot of mixed micelles (micelles and vesicles) present at low calcium levels, which scattered light strongly and made the mixed micelle phase looks turbid. Conversely, at high calcium levels, many mixed micelles precipitate and sediment to the bottom of the samples so the mixed micelle phase looks clearer.
3.3 Effect of pH values
If back titration is used, the intestine sample has to be adjusted to pH 9 at the end of the digestion stage, which may change the physical properties of the colloidal particles present, as well as the bioaccessibility of any nutraceuticals. This series of experiments therefore focusses on the effect of pH (from 6 to 9) on the physical and structural properties of the particles in the mixed micelle phase at both low and high calcium levels (0.525 and 10 mM), which is displayed in Fig. 4 and 9. At low calcium level (0.525 mM), the mean particle diameter increased from around 183 to 250 nm when the pH was increased from 6 to 8, but then slightly decreased to 229 nm when the pH was further increased to 9 (Fig. 4a). This effect was presumably due to increases in the ionization state of the FFAs as the pH was raised.45 Changes in the charge of the carboxylic acid groups may have altered their ability to pack into mixed micelle structures. At high calcium levels (10 mM), the mean particle diameter increased gradually from 113.1 to 136.4 nm when the pH was raised from 6 to 8, but then increased more steeply to 253.4 nm when the pH was further increased to 9 (Fig. 4a). The mixed micelles were significantly (p < 0.05) smaller at the higher calcium level than the lower one. This is probably because many of the larger mixed micelles have been preferentially precipitated out of the system by binding to calcium ions, leaving the smaller ones.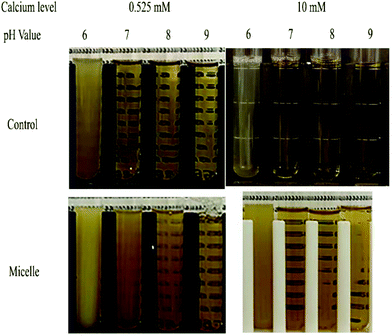 | ||
| Fig. 9 Photos of samples from control sample (no lipid) and micelle phase of high and low calcium levels at different pH values. | ||
The surface potential of the mixed micelle samples remained negative across the entire pH range (from 6 to 9), which is because all of the colloidal particles present are anionic. At pH 6, the ζ-potential of the low calcium sample (−32.3 mV) were similar to that of high calcium sample (−29.9 mV) (Fig. 4b). This phenomenon may have occurred because there was a high fraction of non-ionized FFAs at pH 6, since the pKa value of the carboxylic acid groups is higher than this value.46 As a result, the magnitude of the negative surface potential was lower. On the other hand, calcium ions to bind to the surfaces of the mixed micelles in high calcium sample and thus reduced the negative potential. The impact of pH value on the surface potential depended on the calcium levels present. For low calcium levels, the magnitude of the ζ-potential increased significantly (p < 0.05) with increasing pH: from −32.3 mV at pH 6 to −63.6 mV at pH 9 (Fig. 4b). This effect can be attributed to the increasing ionization of the FFAs as the pH is increased over the pKa values of the carboxylic acid groups. For high calcium levels, increasing the pH had little effect on the surface potential (−25 to −34 mV), which may have been because the ionized FFAs were bound and precipitated by the calcium ions.
The impact of pH and calcium levels on the turbidity of the mixed micelle samples was also investigated (Fig. 9). In this case, control samples were also used, which were obtained by collecting the mixed micelle phase from samples containing no oil. For the control samples, the mixed micelle phase was cloudy at pH 6 but transparent from pH 7 to 9, irrespective of calcium level. The turbidity of the control samples at pH 6 was presumably due to the fact that they contained proteins (whey protein, pancreatin, and pancreatic lipase) with isoelectric points close to this value. At pH 6, the turbidity of the control samples containing 10 mM calcium was slightly less than those containing 0.525 mM calcium, which might have occurred because the cationic calcium ions promoted some precipitation of the anionic proteins.
In the test (nanoemulsion) samples, the mixed micelle solutions were cloudy at pH 6 and became increasingly clear as the system was raised to pH 9. This effect was observed at both calcium levels used, but the turbidity of the mixed micelle phase was less in the samples containing the higher calcium levels. This effect may have been because the cationic calcium ions promoted aggregation of the anionic proteins and mixed micelles. For the test samples, the pH-dependent change in turbidity of the mixed micelle phase might be due to both protein and mixed micelle aggregation. As the pH is increased, both the proteins and fatty acids become more negatively charged, which should increase the electrostatic repulsion between the colloidal particles, thereby opposing aggregation.
In summary, these results showed that the change of pH value in the micelles samples could modify the size and charge properties as well as the solubility of the components insides, and these effects are dependent on the calcium level applied. Consequently, it might place possible impacts on the bioaccessibility of the solubilized nutraceuticals.
4. Conclusions
In this study, the effect of calcium concentration on lipid digestion and carotenoid bioaccessibility was evaluated for β-carotene-fortified nanoemulsions using the standardized INFOGEST method. In the absence of a back-titration step, the extent of lipid digestion appeared to increase with increasing calcium level. When this step was included, however, the lipids were fully digested in all the nanoemulsions, regardless of the calcium levels used. This effect was attributed to the ability of the calcium ions to change the ionization state of the carboxylic acid groups on the free fatty acids. At neutral pH, the FFAs are not fully ionized and so they are not titrated by sodium hydroxide in the pH-stat method. In the presence of calcium, however, the FFAs form calcium soaps and release protons (H+) that can be titrated. This study therefore highlights the importance of including the back-titration step in the INFOGEST method in order to get accurate measurements.Interestingly, increasing the level of calcium in the small intestine phase decreased the bioaccessibility of the carotenoids, which was attributed to the ability of the cationic calcium ions to precipitate the anionic β-carotene-loaded mixed micelles. As a result, the carotenoids were no longer present in the mixed micelle phase generated during lipid digestion. The ability of calcium ions to reduce carotenoid bioaccessibility may have important implications for the nutritional benefits of these nutraceuticals. Consuming carotenoid-rich foods with calcium-rich foods could lead to a reduction in carotenoid bioavailability and efficacy.
Conflicts of interest
There are no conflicts to declare.Acknowledgements
This material was partly based upon work supported by the National Institute of Food and Agriculture, USDA, Massachusetts Agricultural Experiment Station (MAS00491) and USDA, AFRI Grants (2016-08782). We also thank the Chinese Scholarship Council (2017-06150098) for support.References
- J. E. Norton, Y. Gonzalez Espinosa, R. L. Watson, F. Spyropoulos and I. T. Norton, Functional food microstructures for macronutrient release and delivery, Food Funct., 2015, 6, 663–678 RSC.
- E. Arranz, M. Corredig and A. Guri, Designing food delivery systems: challenges related to the in vitro methods employed to determine the fate of bioactives in the gut, Food Funct., 2016, 7, 3319–3336 RSC.
- D. J. McClements, Delivery by Design (DbD): A Standardized Approach to the Development of Efficacious Nanoparticle- and Microparticle-Based Delivery Systems, Compr. Rev. Food Sci. Food Saf., 2018, 17, 200–219 CrossRef CAS.
- F. N. S. Fachel, B. Medeiros-Neves, M. Dal Pra, R. S. Schuh, K. S. Veras, V. L. Bassani, L. S. Koester, A. T. Henriques, E. Braganhol and H. F. Teixeira, Box-Behnken design optimization of mucoadhesive chitosan-coated nanoemulsions for rosmarinic acid nasal delivery-In vitro studies, Carbohydr. Polym., 2018, 199, 572–582 CrossRef CAS PubMed.
- Z. Feng, Z. Wang, Y. Yang, Y. Du, S. Cui, Y. Zhang, Y. Tong, Z. Song, H. Zeng, Q. Zou, L. Peng and H. Sun, Development of a safety and efficacy nanoemulsion delivery system encapsulated gambogic acid for acute myeloid leukemia in vitro and in vivo, Eur. J. Pharm. Sci., 2018, 125, 172–180 CrossRef CAS PubMed.
- T. Onodera, I. Kuriyama, T. Andoh, H. Ichikawa, Y. Sakamoto, E. Lee-Hiraiwa and Y. Mizushina, Influence of particle size on the in vitro and in vivo anti-inflammatory and anti-allergic activities of a curcumin lipid nanoemulsion, Int. J. Mol. Med., 2015, 35, 1720–1728 CrossRef CAS PubMed.
- D. J. McClements and Y. Li, Review of in vitro digestion models for rapid screening of emulsion-based systems, Food Funct., 2010, 1, 32–59 RSC.
- T. Bohn, F. Carriere, L. Day, A. Deglaire, L. Egger, D. Freitas, M. Golding, S. Le Feunteun, A. Macierzanka, O. Menard, B. Miralles, A. Moscovici, R. Portmann, I. Recio, D. Remond, V. Sante-Lhoutelier, T. J. Wooster, U. Lesmes, A. R. Mackie and D. Dupont, Correlation between in vitro and in vivo data on food digestion. What can we predict with static in vitro digestion models?, Crit. Rev. Food Sci. Nutr., 2018, 58, 2239–2261 CrossRef CAS PubMed.
- D. J. McClements, F. Li and H. Xiao, in Annual Review of Food Science and Technology, Vol 6, ed. M. P. Doyle and T. R. Klaenhammer, 2015, vol. 6, pp. 299–327 Search PubMed.
- R. Zhang, W. Wu, Z. Zhang, Y. Park, L. He, B. Xing and D. J. McClements, Effect of the composition and structure of excipient emulsion on the bioaccessibility of pesticide residue in agricultural products, J. Agric. Food Chem., 2017, 65, 9128–9138 CrossRef CAS PubMed.
- D. J. McClements, Enhanced delivery of lipophilic bioactives using emulsions: a review of major factors affecting vitamin, nutraceutical, and lipid bioaccessibility, Food Funct., 2018, 9, 22–41 RSC.
- T. Chacon-Ordonez, R. Carle and R. Schweiggert, Bioaccessibility of carotenoids from plant and animal foods, J. Sci. Food Agric., 2019, 99, 3220–3239 CrossRef CAS PubMed.
- A. Brodkorb, L. Egger, M. Alminger, P. Alvito, R. Assuncao, S. Ballance, T. Bohn, C. Bourlieu-Lacanal, R. Boutrou, F. Carriere, A. Clemente, M. Corredig, D. Dupont, C. Dufour, C. Edwards, M. Golding, S. Karakaya, B. Kirkhus, S. Le Feunteun, U. Lesmes, A. Macierzanka, A. R. Mackie, C. Martins, S. Marze, D. J. McClements, O. Menard, M. Minekus, R. Portmann, C. N. Santos, I. Souchon, R. P. Singh, G. E. Vegarud, M. S. J. Wickham, W. Weitschies and I. Recio, INFOGEST static in vitro simulation of gastrointestinal food digestion, Nat. Protoc., 2019, 14, 991–1014 CrossRef CAS PubMed.
- H. T. Nguyen, M. Marquis, M. Anton and S. Marze, Studying the real-time interplay between triglyceride digestion and lipophilic micronutrient bioaccessibility using droplet microfluidics. 1 lab on a chip method, Food Chem., 2019, 275, 523–529 CrossRef CAS PubMed.
- H. D. Williams, P. Sassene, K. Kleberg, J. C. Bakala-N'Goma, M. Calderone, V. Jannin, A. Igonin, A. Partheil, D. Marchaud, E. Jule, J. Vertommen, M. Maio, R. Blundell, H. Benameur, F. Carriere, A. Mullertz, C. J. Porter and C. W. Pouton, Toward the establishment of standardized in vitro tests for lipid-based formulations, part 1: method parameterization and comparison of in vitro digestion profiles across a range of representative formulations, J. Pharm. Sci., 2012, 101, 3360–3380 CrossRef CAS PubMed.
- M. Minekus, M. Alminger, P. Alvito, S. Ballance, T. Bohn, C. Bourlieu, F. Carriere, R. Boutrou, M. Corredig, D. Dupont, C. Dufour, L. Egger, M. Golding, S. Karakaya, B. Kirkhus, S. Le Feunteun, U. Lesmes, A. Macierzanka, A. Mackie, S. Marze, D. J. McClements, O. Menard, I. Recio, C. N. Santos, R. P. Singh, G. E. Vegarud, M. S. Wickham, W. Weitschies and A. Brodkorb, A standardised static in vitro digestion method suitable for food - an international consensus, Food Funct., 2014, 5, 1113–1124 RSC.
- M. Lecomte, C. Bourlieu, E. Meugnier, A. Penhoat, D. Cheillan, G. Pineau, E. Loizon, M. Trauchessec, M. Claude, O. Menard, A. Geloen, F. Laugerette and M. C. Michalski, Milk Polar Lipids Affect In Vitro Digestive Lipolysis and Postprandial Lipid Metabolism in Mice, J. Nutr., 2015, 145, 1770–1777 CrossRef CAS PubMed.
- C. Arancibia, M. Miranda, S. Matiacevich and E. Troncoso, Physical properties and lipid bioavailability of nanoemulsion-based matrices with different thickening agents, Food Hydrocolloids, 2017, 73, 243–254 CrossRef CAS.
- M. Hu, Y. Li, E. A. Decker and D. J. McClements, Role of calcium and calcium-binding agents on the lipase digestibility of emulsified lipids using an in vitro digestion model, Food Hydrocolloids, 2010, 24, 719–725 CrossRef CAS.
- N. H. Zangenberg, A. Mullertz, H. G. Kristensen and L. Hovgaard, A dynamic in vitro lipolysis model I. Controlling the rate of lipolysis by continuous addition of calcium, Eur. J. Pharm. Sci., 2001, 14, 115–122 CrossRef CAS PubMed.
- A. Ye, J. Cui, X. Zhu and H. Singh, Effect of calcium on the kinetics of free fatty acid release during in vitro lipid digestion in model emulsions, Food Chem., 2013, 139, 681–688 CrossRef CAS PubMed.
- P. Sassene, K. Kleberg, H. D. Williams, J. C. Bakala-N'Goma, F. Carriere, M. Calderone, V. Jannin, A. Igonin, A. Partheil, D. Marchaud, E. Jule, J. Vertommen, M. Maio, R. Blundell, H. Benameur, C. J. H. Porter, C. W. Pouton and A. Mullertz, Toward the Establishment of Standardized In Vitro Tests for Lipid-Based Formulations, Part 6: Effects of Varying Pancreatin and Calcium Levels, AAPS J., 2014, 16, 1344–1357 CrossRef CAS PubMed.
- A. Achouri, J. I. Boye and Y. Zamani, Changes in soymilk quality as a function of composition and storage, J. Food Qual., 2007, 30, 731–744 CrossRef CAS.
- E. Ayala-Bribiesca, M. Lussier, D. Chabot, S. L. Turgeon and M. Britten, Effect of calcium enrichment of Cheddar cheese on its structure, in vitro digestion and lipid bioaccessibility, Int. Dairy J., 2016, 53, 1–9 CrossRef CAS.
- C. Pentafragka, M. Symillides, M. McAllister, J. Dressman, M. Vertzoni and C. Reppas, The impact of food intake on the luminal environment and performance of oral drug products with a view to in vitro and in silico simulations: a PEARRL review, J. Pharm. Pharmacol., 2019, 71, 557–580 CrossRef CAS PubMed.
- A. V. Rao and L. G. Rao, Carotenoids and human health, Pharmacol. Res., 2007, 55, 207–216 CrossRef CAS PubMed.
- R. E. Kopec and M. L. Failla, Recent advances in the bioaccessibility and bioavailability of carotenoids and effects of other dietary lipophiles, J. Food Compos. Anal., 2018, 68, 16–30 CrossRef CAS.
- H. Rostamabadi, S. R. Falsafi and S. M. Jafari, Nanoencapsulation of carotenoids within lipid-based nanocarriers, J. Controlled Release, 2019, 298, 38–67 CrossRef CAS PubMed.
- A. H. Saberi and D. J. McClements, Fabrication of protein nanoparticles and microparticles within water domains formed in surfactant–oil–water mixtures: Phase inversion temperature method, Food Hydrocolloids, 2015, 51, 441–448 CrossRef CAS.
- Y. Yuan, Y. Gao, J. Zhao and L. Mao, Characterization and stability evaluation of β-carotene nanoemulsions prepared by high pressure homogenization under various emulsifying conditions, Food Res. Int., 2008, 41, 61–68 CrossRef CAS.
- Y. Tan, J. Liu, H. Zhou, J. Muriel Mundo and D. J. McClements, Impact of an indigestible oil phase (mineral oil) on the bioaccessibility of vitamin D3 encapsulated in whey protein-stabilized nanoemulsions, Food Res. Int., 2019, 120, 264–274 CrossRef CAS PubMed.
- Z. Zhang, R. Zhang and D. J. McClements, Encapsulation of β-carotene in alginate-based hydrogel beads: Impact on physicochemical stability and bioaccessibility, Food Hydrocolloids, 2016, 61, 1–10 CrossRef CAS.
- A. Sarkar, K. K. T. Goh and H. Singh, Colloidal stability and interactions of milk-protein-stabilized emulsions in an artificial saliva, Food Hydrocolloids, 2009, 23, 1270–1278 CrossRef CAS.
- X. Wang, Q. Lin, A. Ye, J. Han and H. Singh, Flocculation of oil-in-water emulsions stabilised by milk protein ingredients under gastric conditions: Impact on in vitro intestinal lipid digestion, Food Hydrocolloids, 2019, 88, 272–282 CrossRef CAS.
- C. Qian, E. A. Decker, H. Xiao and D. J. McClements, Nanoemulsion delivery systems: influence of carrier oil on beta-carotene bioaccessibility, Food Chem., 2012, 135, 1440–1447 CrossRef CAS PubMed.
- S. Salentinig, L. Sagalowicz and O. Glatter, Self-assembled structures and pKa value of oleic acid in systems of biological relevance, Langmuir, 2010, 26, 11670–11679 CrossRef CAS PubMed.
- J. Rao, E. A. Decker, H. Xiao and D. J. McClements, Nutraceutical nanoemulsions: influence of carrier oil composition (digestible versus indigestible oil) on beta-carotene bioavailability, J. Sci. Food Agric., 2013, 93, 3175–3183 CrossRef CAS PubMed.
- T. Nawroth, P. Buch, K. Buch, P. Langguth and R. Schweins, Liposome formation from bile salt-lipid micelles in the digestion and drug delivery model FaSSIF(mod) estimated by combined time-resolved neutron and dynamic light scattering, Mol. Pharm., 2011, 8, 2162–2172 CrossRef CAS PubMed.
- D. G. Fatouros, I. Walrand, B. Bergenstahl and A. Mullertz, Colloidal Structures in Media Simulating Intestinal Fed State Conditions with and Without Lipolysis Products, Pharm. Res., 2009, 26, 361–374 CrossRef CAS PubMed.
- A. Mullertz, D. G. Fatouros, J. R. Smith, M. Vertzoni and C. Reppas, Insights into Intermediate Phases of Human Intestinal Fluids Visualized by Atomic Force Microscopy and Cryo-Transmission Electron Microscopy ex Vivo, Mol. Pharm., 2012, 9, 237–247 CrossRef CAS PubMed.
- R. Zhang, Z. Zhang, T. Kumosani, S. Khoja, K. O. Abualnaja and D. J. McClements, Encapsulation of β-carotene in Nanoemulsion-Based Delivery Systems Formed by Spontaneous Emulsification: Influence of Lipid Composition on Stability and Bioaccessibility, Food Biophys., 2016, 11, 154–164 CrossRef.
- Y. Li and D. J. McClements, New mathematical model for interpreting pH-stat digestion profiles: impact of lipid droplet characteristics on in vitro digestibility, J. Agric. Food Chem., 2010, 58, 8085–8092 CrossRef CAS PubMed.
- Q. Lin, R. Liang, A. Ye, H. Singh and F. Zhong, Effects of calcium on lipid digestion in nanoemulsions stabilized by modified starch: Implications for bioaccessibility of β -carotene, Food Hydrocolloids, 2017, 73, 184–193 CrossRef CAS.
- M. Heider, G. Hause and K. Mader, Does the commonly used pH-stat method with back titration really quantify the enzymatic digestibility of lipid drug delivery systems? A case study on solid lipid nanoparticles (SLN), Eur. J. Pharm. Biopharm., 2016, 109, 194–205 CrossRef CAS PubMed.
- J. R. Kanicky and D. O. Shah, Effect of Degree, Type, and Position of Unsaturation on the pKa of Long-Chain Fatty Acids, J. Colloid Interface Sci., 2002, 256, 201–207 CrossRef CAS PubMed.
- A. A. Pashkovskaya, M. Vazdar, L. Zimmermann, O. Jovanovic, P. Pohl and E. E. Pohl, Mechanism of Long-Chain Free Fatty Acid Protonation at the Membrane-Water Interface, Biophys. J., 2018, 114, 2142–2151 CrossRef CAS PubMed.
| This journal is © The Royal Society of Chemistry 2020 |


