Comparative study on the physicochemical properties and bioactivities of polysaccharide fractions extracted from Fructus Mori at different temperatures
Jia-Qi
Zhang
a,
Chao
Li
ac,
Qiang
Huang
ac,
Li-Jun
You
 ac,
Chun
Chen
 *abc,
Xiong
Fu
*abc and
Rui Hai
Liu
ad
aSchool of Food Science and Engineering, South China University of Technology, 381 Wushan Road, Guangzhou 510640, China. E-mail: chenc@scut.edu.cn; lfxfu@scut.edu.cn; Fax: +86-20-87112894; Tel: +86-20-87112894
bGuangdong Province Key Laboratory for Green Processing of Natural Products and Product Safety, Guangzhou 510640, China
cOverseas Expertise Introduction Center for Discipline Innovation of Food Nutrition and Human Health (111 Center), Guangzhou, China
dDepartment of Food Science, Stocking Hall, Cornell University, Ithaca, NY 14853, USA
First published on 20th December 2018
Abstract
This study examined the effects of different extraction temperatures (30 °C and 90 °C) on the physicochemical properties and bioactivities of polysaccharides (MFPs-30-60, MFPs-30-80, MFPs-90-40, MFPs-90-60 and MFPs-90-80) extracted at same ethanol gradation (40, 60 and 80%). The polysaccharides were extracted from Fructus Mori, and their antioxidant, hypoglycemic and hypolipidemic activities were evaluated. The results showed that all the polysaccharide fractions contained the same monosaccharides but at different molar ratios. MFPs-30-80 had the highest content of glucose (30.33%), and MFPs-90-40 had the highest content of uronic acid (43.46%). In addition, compared to the extraction temperature of 30 °C, the higher temperature (90 °C) caused the degradation of the extracted polysaccharides. Generally, MFPs-30-80 showed superior antioxidant activity, MFPs-90-40 displayed good bile acid-binding ability, and both MFPs-30-80 and MFPs-90-40 exhibited the strongest inhibitory effects on α-amylase and α-glucosidase activity. This study concludes that the bioactivities of mulberry fruit polysaccharides depend on a combination of structural factors that are greatly affected by the extraction temperature.
1. Introduction
The mulberry, belonging to the genus Morus of the family Moraceae, is an important fruit with high economic value. Because of its special growth environment with no pollution, mulberry is also called as the “Folk holy fruit”.1 Especially for the black mulberry cultivated in southern Xinjiang, China, the transport, transformation and accumulation of secondary metabolites including polysaccharides are promoted by the high latitudes, large temperature difference between day and night, and sufficient illumination.2 The mulberry was commonly eaten fresh or processed into juice and jam for its delicious taste, low caloric content and rich nutrition.3 According to traditional Chinese medicine, mulberry can prevent kidney and liver damage, improve vision, strengthen the joints, and have radiation-protective and anti-aging effects.4 These attributes indicate that mulberry fruits have functional components that are beneficial for human health. It has been proved that the polysaccharides, as one of the important bioactive components in mulberry fruit, have good anti-inflammatory, anti-tumor, anti-oxidation, hypoglycemic and hypolipidemic activities.5,6Common methods for extracting polysaccharides include thermal refluxing, ultrasonic assisted extraction, acid extraction, and alkali extraction. Different extraction methods have different effects on the structure and physicochemical properties of the resulting polysaccharides. Gao et al.7 reported that polysaccharides from Laminaria japonica obtained by pressurized hot water extraction and acid-assisted extraction had relatively low molecular weights and low viscosity, and that by acid-assisted extraction had significantly higher bile acid-binding capacity than the others. Meanwhile, conventional water extraction methods are subject to multiple parameters, including extraction temperature, time, extraction solvent, and solid ratio.8,9 Su et al.10 compared the influence of different extraction temperatures on the bioactivities of polysaccharides from Grifola frondosa and showed that high temperatures could degrade the molecular weight, resulting in stronger inhibition of NO production in LPS-stimulated RAW264.7 cells. Zhao et al.11 reported that the physicochemical properties of the polysaccharides extracted by ultrasonic methods were greatly affected by the increase in temperature.
At present, researches about mulberry fruit polysaccharides has mainly focused on optimizing the extraction conditions to obtain maximum yields and good bioactivities. However, limited information exists about the effects of extraction temperature, as one important extraction factor, on the physicochemical properties and bioactivities of the mulberry fruit polysaccharides. The aim of this study was to investigate the effects of different temperatures on the physicochemical properties, antioxidant, hypoglycemic and hypolipidemic activities.
2. Materials and methods
2.1. Materials and chemicals
Freshly harvested mature black mulberry fruits were purchased from a local fruit market in Xinjiang, China. The fruit was thoroughly washed with deionized water, dried at 45 °C in the oven (DHG-9140A, Yiheng Scientific instrument Co., Ltd, Shanghai, China), and then stored in a desiccator at room temperature for further use.Bovine serum albumin (BSA), 2,2-diphenyl-1-picrylhydrazyl (DPPH), 2,2′-azino-bis(3-ethylbenzothiazoline-6-sulfonic acid)(ABTS), α-amylase and α-glucosidase, taurocholic acid and monosaccharide standards were purchased from Sigma-Aldrich Chemical Co. (St Louis, MO, USA). All other chemicals and solvents used were reagent grade.
2.2. Extraction of mulberry fruit polysaccharides (MFPs)
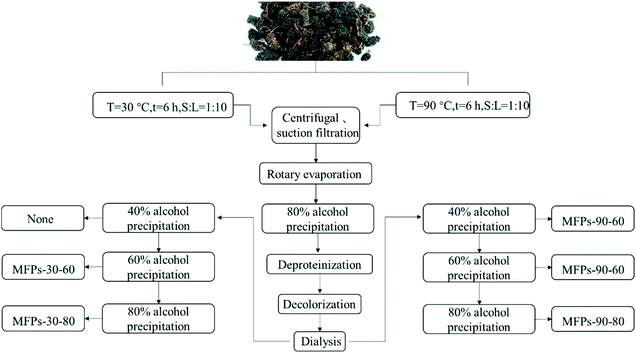
The dried mulberry fruits (500 g) were shaken with 95% ethanol for 6 h at room temperature to remove the grease, monosaccharides and small molecules. The residue was separated by filtration and dried in an oven at 37 °C to obtain a pretreated dry sample. The extraction process with different temperatures is shown in Fig. 1.The dried sample (500 g) was extracted with 5000 mL of distilled water at 90 °C for 6 hours twice, and was then filtered under reduced pressure. The filtrate was centrifuged at 5000g for 10 minutes, and the supernatant was concentrated to 1/8 of the initial volume and then precipitated with 80% (v/v) ethanol at 4 °C for 12 hours. After centrifugation, the precipitate was collected, dissolved in deionized water, and deproteinized by adding 1/4 volume of sevag reagent (chloroform![[thin space (1/6-em)]](https://www.rsc.org/images/entities/char_2009.gif) :
:![[thin space (1/6-em)]](https://www.rsc.org/images/entities/char_2009.gif) n-butanol = 4
n-butanol = 4![[thin space (1/6-em)]](https://www.rsc.org/images/entities/char_2009.gif) :
:![[thin space (1/6-em)]](https://www.rsc.org/images/entities/char_2009.gif) 1) until the protein was completely removed. The sample was then subjected to static adsorption and decolorization using macro porous resin AB-8 for decolorization. The supernatant was separated by filtration, concentrated and dialyzed against distilled water for 72 hours. After sequential precipitation with 40%, 60%, and 80% (v/v) ethanol at 4 °C for 12 hours and freeze-drying, the three fractions including MFPs-90-40, MFPs-90-60 and MFPs-90-80 were obtained.
1) until the protein was completely removed. The sample was then subjected to static adsorption and decolorization using macro porous resin AB-8 for decolorization. The supernatant was separated by filtration, concentrated and dialyzed against distilled water for 72 hours. After sequential precipitation with 40%, 60%, and 80% (v/v) ethanol at 4 °C for 12 hours and freeze-drying, the three fractions including MFPs-90-40, MFPs-90-60 and MFPs-90-80 were obtained.
The dried samples were extracted at 30 °C following the above procedure. The two fractions MFPs-30-60 and MFPs-30-80 were obtained, and no polysaccharide precipitated under 40% (v/v) ethanol.
2.3. Structural characterization
The total sugar content was measured by the phenol-sulfuric acid method12 using D-glucose as a standard to make the standard curve. The total protein content was determined by Bradford's method13 with bovine serum albumin (BSA) as the standard.2.4. Determination of monosaccharide and uronic acid composition
In an ampule, 5 mg of the sample was dissolved in 4 mL of trifluoroacetic acid (2 M) and sealed at 110 °C for 6 hours. Excess trifluoroacetic acid was removed by a nitrogen gas blower at 50 °C. The residue was re-dissolved in HPLC-grade methanol (4 mL) and dried under reduced pressure for 5 times. The residue was then dissolved in ultrapure water and filtered through a 0.22 μm aqueous phase filter. Chromatography analyses used a Dionex ion chromatography ICS 3000 (Sunnyvale, CA) with a CarboPac PA20 analytical column (250 × 4 mm; Dionex Corp.) and CarboPac PA1 guard column (50 × 4 mm; Dionex Corp.). The standards consisted of fucose, mannose, glucose, arabinose, xylose, fructose, galactose, glucuronic acid and galacturonic acid.142.5. Homogeneity and molecular weight determination
The homogeneity and molecular weight of each polysaccharide fraction were measured by high-performance gel permeation chromatography (HP-GPC, Agilent 1100 series), equipped with a TSK-GEL Guard Column (PWXL 6.0 mm × 40 mm), a TSKGEL5000K gel column (PWXL 7.8 mm × 300 mm), a TSK-GEL3500K gel column (PWXL 7.8 mm × 300 mm) (TOSOH Co., Ltd, Japan), and a Waters 2414 Refractive Index Detector.15 The mobile phase was KH2PO4 (0.02 M, pH 6.0) and the flow rate was set at 0.6 mL min−1. The measurement was performed at a column temperature of 35 °C and a detector temperature of 45 °C. The molecular weight of the sample was determined according to the calibration curve equation obtained by dextran standards with different molecular weights (708![[thin space (1/6-em)]](https://www.rsc.org/images/entities/char_2009.gif) 000, 344
000, 344![[thin space (1/6-em)]](https://www.rsc.org/images/entities/char_2009.gif) 000, 200
000, 200![[thin space (1/6-em)]](https://www.rsc.org/images/entities/char_2009.gif) 000, 107
000, 107![[thin space (1/6-em)]](https://www.rsc.org/images/entities/char_2009.gif) 000, 47
000, 47![[thin space (1/6-em)]](https://www.rsc.org/images/entities/char_2009.gif) 100, 21
100, 21![[thin space (1/6-em)]](https://www.rsc.org/images/entities/char_2009.gif) 100, 9600, 5900 Da).
100, 9600, 5900 Da).
2.6. Fourier transform-infrared (FT-IR) spectrometry
Infrared spectroscopy was performed using the KBr pellet method.16 The sample was ground and compressed with KBr powder and subjected to infrared spectral scanning analysis in the range of 500–4000 cm−1 using a Vector 33 FT-IR spectrophotometer (Brook, Ettlingen, Germany).2.7. Molecular morphology observation
As previously described, after the sample was completely dissolved and diluted to 10 μg ml−1, 5 μL of the sample was dropped on the mica surfaces, completely dried, and then observed using a Tap150-G-10 (Ted Pella, INC., USA) atomic force microscope. Finally, the image processing was performed using NanoScope Analysis software.172.8. Assay for antioxidant activity
 | (1) |
 | (2) |
2.9. Assay for hypoglycemic activity
 | (3) |
 | (4) |
2.10. Bile acid-binding capacity assay
The bile acid-binding capacity of the samples was measured according to Zeng et al.23 Polysaccharide sample (5 mg ml−1), sodium taurocholate (0.5 mmol ml−1), porcine trypsin (10 mg mL−1), and cholestyramine (5 mg ml−1) were prepared with phosphate buffer (0.05 M, pH 6.8). 0.5 mL sample solution and 0.5 mL of HCl (0.01 mol L−1) were mixed and incubated at 37 °C for 60 min. After adjusting the pH to 6.8 with 0.1 mol L−1 sodium hydroxide, 2 mL porcine trypsin and 2 mL sodium taurocholate were added, and the solutions were incubated for 60 min in a 37 °C shaker bath. The mixture was then centrifuged at 4000 rpm for 20 minutes, and 2.5 mL of the supernatant was removed into another tube and combined with 7.5 mL 60% sulfuric acid solution. The mixtures were heated for 20 minutes in a 70 °C water bath and then rapidly cooled in an ice bath for 5 minutes. The bile acid content in the supernatant was measured spectrophotometrically at 387 nm. The bile acid content was determined by a standard curve generated from a sodium taurocholate solution.2.11. Statistical analysis
Data are expressed as mean ± standard deviation in triplicate. Analysis of variance (ANOVA) was carried out using the Duncan test and LSD test. The means were regarded as significantly different at p < 0.05.3. Results and discussion
3.1. Structural characterization
The effects of different extraction temperatures on the structural characteristics of the polysaccharide fractions are shown in Table 1. The results indicated that the temperature had a significant effect on the total sugar content, monosaccharide composition and molecular weight of the polysaccharide fractions (p < 0.05). The total sugar content of MFPs-90-40 (86.94 ± 1.22%) was significantly higher than that of the other polysaccharide fractions. After preliminary purification, including deproteinization, decolorization and dialysis, the protein content of each fraction was relatively low. As shown in Table 1, the five polysaccharide fractions were all composed of fucose, arabinose, galactose, glucose, xylose, mannose, fructose, galacturonic acid and glucuronic acid. The saccharides arabinose, galactose, glucose, galacturonic acid were the main components in each fraction. However, due to the influence of the extraction temperature, the monosaccharide ratio of each fraction was different. Specifically, MFPs-30-80 and MFPs-90-40 had significantly higher contents of glucose (30.33%) and galacturonic acid (41.02%) than the other fractions, respectively.| Item | MFPs-90-40 | MFPs-90-60 | MFPs-90-80 | MFPs-30-60 | MFPs-30-80 |
|---|---|---|---|---|---|
| Total sugar (%) | 86.94 ± 1.22 | 75.18 ± 0.77 | 58.09 ± 0.54 | 79.75 ± 0.25 | 68.92 ± 1.49 |
| Protein (%) | 1.69 ± 0.14 | 1.06 ± 0.20 | 0.84 ± 0.13 | 0.33 ± 0.09 | 1.16 ± 0.24 |
| Monosaccharide composition (%) | |||||
| Fuc | 0.74 | 0.97 | 1.50 | 0.96 | 4.38 |
| Ara | 18.83 | 35.66 | 32.12 | 35.58 | 25.13 |
| Gal | 13.17 | 28.20 | 25.14 | 28.17 | 22.00 |
| Glc | 13.40 | 7.26 | 19.83 | 7.64 | 30.33 |
| Xyl | 1.23 | 0.42 | 0.39 | 0.38 | 1.46 |
| Man | 2.81 | 2.43 | 7.89 | 2.73 | 4.60 |
| Fru | 6.35 | 1.15 | 2.03 | 0.88 | 0.66 |
| GalA | 41.02 | 19.07 | 8.75 | 19.19 | 8.43 |
| GlcA | 2.45 | 4.93 | 2.36 | 4.46 | 3.00 |
| Molecular weight distribution(kDa) | |||||
| Peak 1 | 268.89 | 110.23 | 107.22 | 536.45 | 7.05 |
| Content (%) | 66.20 | 34.17 | 5.44 | 47.86 | 100 |
| Peak 2 | 44.15 | 29.08 | 7.45 | 116.39 | |
| Content(%) | 22.61 | 61.54 | 66.38 | 37.94 | |
| Peak 3 | 12.14 | 11.75 | 4.18 | 29.50 | |
| Content(%) | 11.19 | 4.29 | 28.18 | 5.47 | |
| Peak 4 | 11.79 | ||||
| Content(%) | 8.73 | ||||
As shown in Table 1, the five polysaccharide fractions had different molecular weight distributions and all were heterogeneous polysaccharides except for MFPs-30-80. MFPs-30-60 consisted of four polysaccharides with a molecular weight distribution of 536.45 (47.86%), 116.39 (37.94%), 29.50 (5.47%) and 11.79 kDa (8.73%). Compared with MFPs-30-60, the MFPs-90-40, MFPs-90-60, MFPs-90-80, and MFPs-30-80 fractions have narrower molecular weight distributions: MFPs-90-40 of 268.89 (66.20%), 44.15 (22.61%) and 12.14 kDa (11.19%); MFPs-90-60 of 110.23 (34.17%), 29.08 (61.54%) and 11.75 kDa (4.29%); MFPs-90-80 of 107.22 (5.44%), 7.45 (66.38%) and 4.18 kDa (28.18%); and MFPs-30-80 of 7.05 kDa (100%). The results indicate that the high extraction temperature promoted the degradation of the polysaccharides, which is consistent with Nurmamat et al.,24 which showed that high temperature resulted in the molecular weight decrease of Cordyceps militaris polysaccharides. In addition, the molecular weights of the polysaccharides showed a downward trend as the ethanol concentration increased.
3.2 FT-IR spectra analysis
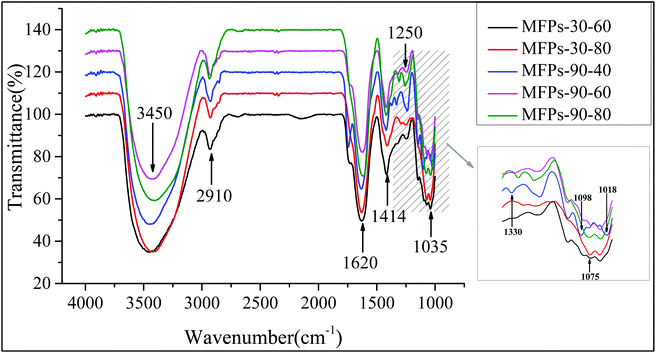
Infrared spectroscopy can identify specific groups in a polysaccharide, which can help in analyzing the configuration of the polysaccharide. As shown in Fig. 2, the strong absorption band at 3450 cm−1 is attributed to the O–H stretching vibration in the sugar residue, and the band at 2910 cm−1 is related to the C–H stretching in the sugar ring. The absorption bands at 1414 cm−1 and 1620 cm−1 result from the asymmetric and symmetric C![[double bond, length as m-dash]](https://www.rsc.org/images/entities/char_e001.gif) O stretching vibrations, respectively. The characteristic absorption bands at 1250 cm−1 and 1075 cm−1 are attributed to the asymmetric and symmetric O
O stretching vibrations, respectively. The characteristic absorption bands at 1250 cm−1 and 1075 cm−1 are attributed to the asymmetric and symmetric O![[double bond, length as m-dash]](https://www.rsc.org/images/entities/char_e001.gif) S
S![[double bond, length as m-dash]](https://www.rsc.org/images/entities/char_e001.gif) O stretching vibration of the sulfate,25 and the peak at around 1035 cm−1 belongs to the C–O–C stretching vibration.7 The bands around 1018 cm−1 and 1098 cm−1 are attributed to the stretching vibrations of the pyran ring,26 and the peak at 1330 cm−1 is due to the O–H bending vibration.27 The similar infrared spectra of the polysaccharide fractions indicate that the different extraction temperatures had no effect on the glycosidic bond types of the polysaccharides.
O stretching vibration of the sulfate,25 and the peak at around 1035 cm−1 belongs to the C–O–C stretching vibration.7 The bands around 1018 cm−1 and 1098 cm−1 are attributed to the stretching vibrations of the pyran ring,26 and the peak at 1330 cm−1 is due to the O–H bending vibration.27 The similar infrared spectra of the polysaccharide fractions indicate that the different extraction temperatures had no effect on the glycosidic bond types of the polysaccharides.
3.3 Molecular morphology observation
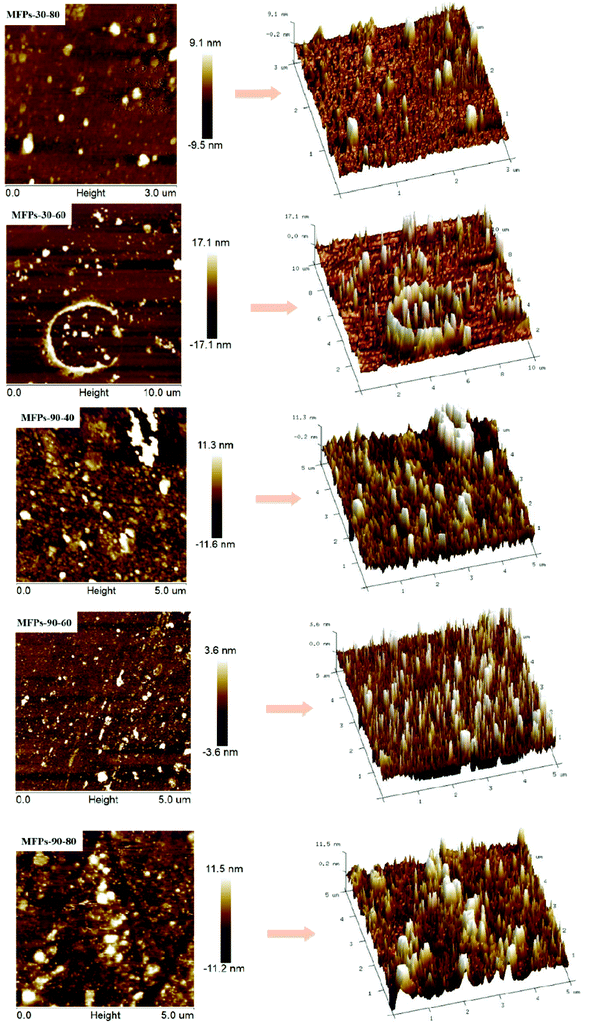
AFM can be used to observe the three-dimensional structure and microscopic surface morphology of polysaccharides. As shown in Fig. 3, all the mulberry polysaccharides were irregularly spheroidal and uneven in size. The average thickness of the polysaccharide particles in MFPs-30-60, MFPs-30-80, MFPs-90-40, MFPs-90-60 and MFPs-90-80 were 42.79, 12.96, 24.46, 20.58 and 18.30 nm, respectively, and the widths were approximately 0.43, 0.26, 0.40, 0.22 and 0.23 nm, respectively. The increase in the extraction temperature caused a decrease in the polysaccharide particle size, indicating that high temperatures can break the original structure of mulberry polysaccharides and change the polysaccharide granule. This result is consistent with the conclusion that the change in temperature caused a change in the polysaccharide chain length.173.4 Antioxidant activity in vitro of MFPs
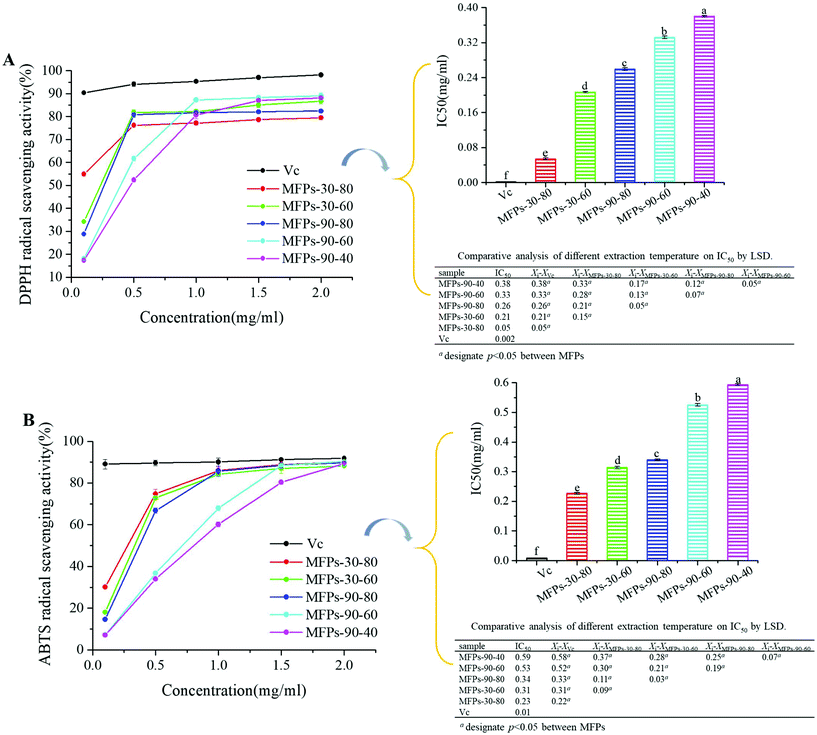
In general, the mulberry fruit polysaccharide fractions extracted at 30 °C temperature showed better antioxidant activity than those extracted at 90 °C. This result is consistent with the findings of Chen et al. that high temperature has a negative effect on the antioxidant capacity of polysaccharides.34 Furthermore, the molecular weight of the polysaccharides was correlated with its antioxidant activity.35,36 The MFPs-30-80 extraction exhibited the strongest antioxidant activity probably due to its lowest molecular weight of 7.05 kDa and the fact that low molecular weight saccharides have more reductive hydroxyl group terminals (on a per unit mass basis) to accept and eliminate the free radicals. Also, high molecular weight polysaccharides have more compact structure, resulting in stronger intramolecular hydrogen bond and thus making the hydroxyl groups more restricted. The uronic acid content was another important indicator reflecting the antioxidant activity of the polysaccharide fractions. MFPs-30-60 exhibited larger molecular weights than MFPs-90-80 but stronger antioxidant activity, which was mainly due to its higher content of uronic acids. It is likely that the presence of electrophilic groups like keto or aldehyde in acidic polysaccharides facilitates the liberation of hydrogens from the O–H bonds. Furthermore, a high content of glucose may also contribute to the antioxidant activity of a polysaccharide.35 Therefore, the antioxidant activity of polysaccharides is affected by multiple factors that can account for the relatively weak antioxidant activity of MFPs-90-40, which has the highest acidic content (43.47%).
3.5 Inhibition of α-amylase and α-glucosidase of MFPs in vitro
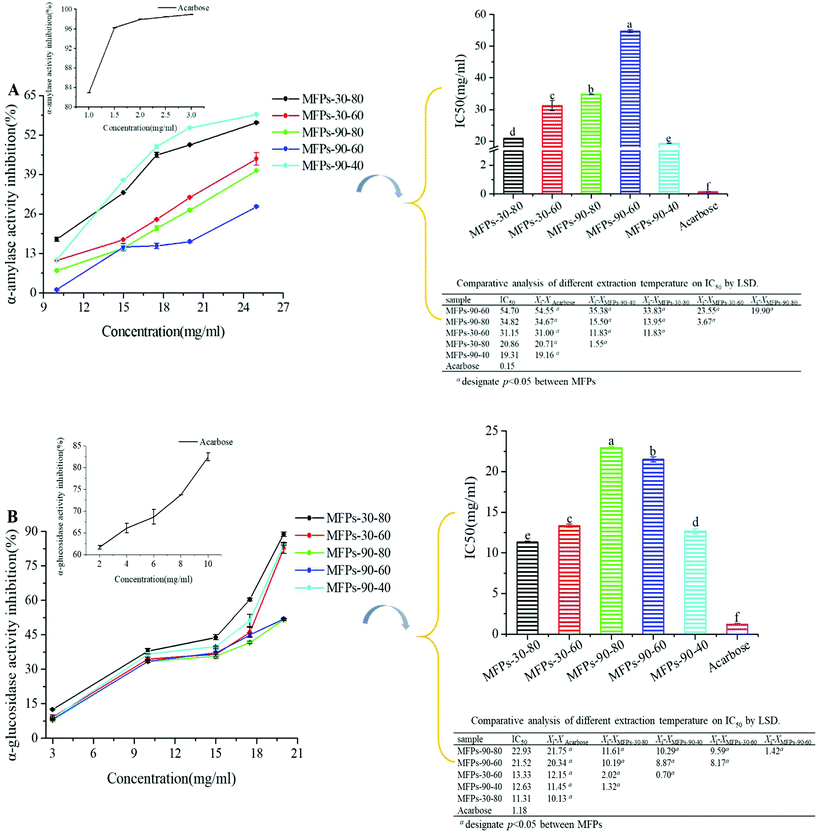
The enzymes α-amylase and α-glucosidase are reportedly the main factors affecting the postprandial hyperglycemia. Generally, carbohydrates like starch are initially hydrolyzed to oligosaccharides and further hydrolyzed to monosaccharides, including glucose by α-glucosidase, resulting in postprandial hyperglycemia.37 Therefore, it is an effective method to retard the influx of glucose from the intestinal tract to blood vessels by inhibiting the activities of α-amylase and α-glucosidase.As shown in Fig. 5(A), all the polysaccharide fractions showed increased α-amylase inhibitory effects with increasing concentrations of the sample from 10 to 25 mg mL−1. Particularly, MFPs-90-40 had the lowest IC50 value of 19.31 ± 0.01 mg mL−1 (p < 0.05), followed by MFPs-30-80 (20.86 ± 0.02 mg mL−1), MFPs-30-60 (31.15 ± 1.67 mg mL−1), MFPs-90-80 (34.82 ± 0.06 mg mL−1), and MFPs-90-60 (54.70 ± 0.48 mg mL−1).
As shown in Fig. 5(B), the five polysaccharide fractions exhibited concentration-dependent effects on α-glucosidase inhibition from 3 to 21 mg mL−1. However, they showed different degrees of increase. In particular, at 20 mg mL−1, the α-glucosidase inhibition of MFPs-90-40, MFPs-90-60, MFPs-90-80, MFPs-30-60, and MFPs-30-80 were 84.33 ± 0.45%, 51.92 ± 0.15%, 51.53 ± 0.42%, 82.73 ± 2.38%, 88.74 ± 0.10%, respectively. According to the IC50 values, MFPs-30-80 showed the strongest inhibitory effect on α-glucosidase with an IC50 value of 11.31 ± 0.13 mg mL−1 (p < 0.05). The main mechanism of α-amylase and α-glucosidase inhibition involved the polysaccharides binding to the enzymes to induce polarity and molecular conformational changes, which caused partial loss of the enzyme activity. In general, MFPs-30-80 and MFPs-90-40 showed stronger inhibitory effects on both α-amylase and α-glucosidase than the other fractions. This result might be related to the high content of glucose in MFPs-30-80 and galacturonic acid in MFPs-90-40, as it was previously described that more hydroxyl and keto groups increases the binding capacity of the polysaccharides.38–41 Thus, the hydroxyl groups and galacturonic acid content in the polysaccharides may play a critical role in the binding process.
3.6 Bile acid-binding capacity of MFPs
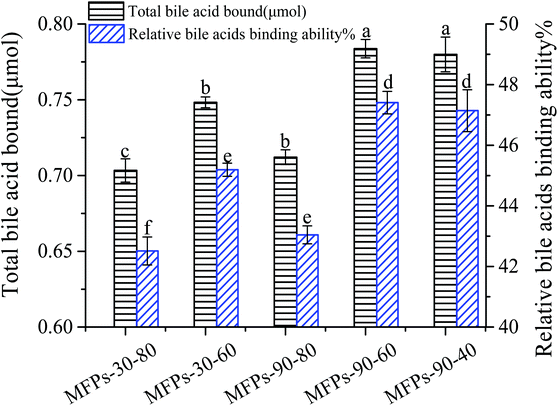
The polysaccharide binding to bile acids, which are synthesized in the liver from cholesterol, may promote the excretion of cholesterol through the gastro-intestinal tract and decrease the total plasma and LDL cholesterol.42 As shown in Fig. 6, the bile acid-binding abilities of MFPs-90-40, MFPs-90-60, MFPs-90-80, MFPs-30-60, and MFPs-30-80 were 0.78 ± 0.012, 0.78 ± 0.006, 0.71 ± 0.005, 0.75 ± 0.004, 0.70 ± 0.008 μmol, respectively. Clearly, MFPs-90-40 and MFPs-90-60 had the strongest bile acid-binding ability, followed by MFPs-30-60. Compared to the other fractions, MFPs-90-80 and MFPs-30-80 showed the weakest bile acid-binding ability (p < 0.05). This may be related to their different monosaccharide composition and molecular weight. As reported by Gunness et al., uronic acids could effectively bind bile acids through molecular interactions with bile salts. In addition, the high molecular weight of polysaccharides were shown to have hydrodynamic restrictions on bile acid-binding due to their high viscosity.43 According to monosaccharide analysis and molecular weight determination, MFPs-90-40, MFPs-90-60 and MFPs-30-60 had more uronic acids and higher average molecular weights than those of MFPs-90-80 and MFPs-30-80. Therefore, the bile acid-binding abilities of these polysaccharide fractions from mulberry fruits were strongly related to their uronic acid contents and molecular weights, which were greatly affected by the extraction temperature.4. Conclusion
Polysaccharides prepared from mulberry fruit at temperatures of 30 °C and 90 °C with the same ethanol grading showed different physicochemical properties and bioactivities. MFPs-90-40, MFPs-90-60 and MFPs-90-80 were the three fractions obtained at 90 °C, while MFPs-30-60 and MFPs-30-80 were the two fractions obtained at 30 °C. All the polysaccharide fractions contained the same monosaccharide composition but at different ratios. The molecular weight determination and morphology observations both indicated that the higher extraction temperature could cause the degradation of the polysaccharides. Furthermore, MFPs-30-80 showed remarkable antioxidant activities, which was mainly due to its low molecular weight, while no such polysaccharides were present in the fractions extracted at 90 °C due to degradation. Regarding the hypoglycemic activities, MFPs-30-80 and MFPs-90-40 both showed a strong inhibitory effect on α-amylase and α-glucosidase. This was mainly related to their monosaccharide composition including glucose and uronic acid, which affected their interactions. In addition, MFPs-90-40, MFPs-90-60 and MFPs-30-60 displayed strong bile acid-binding ability, which was ascribed to the high uronic acid content and molecular weight. This study concludes that the antioxidant, hypoglycemic and hypolipidemic activities of mulberry fruit polysaccharides were the results of a combination of structural factors, which were greatly affected by the extraction temperature.Conflicts of interest
There are no conflicts to declare.Acknowledgements
Financial and moral assistances supported by the China Postdoctoral Science Foundation (2018M643092), National Key R&D Program (2017YFD0400703), Guangzhou Science Technology and Innovation Commission (201803050001), National key research and development program (D2170880), Science & Technology Planning Project of Nansha, Guangzhou (2016GJ001), and 111 Project (B17018) to conduct the project are gratefully acknowledged.References
- D. Q. Jiang, Y. Guo, D. H. Xu, Y. S. Huang, K. Yuan and Z. Q. Lv, Antioxidant and anti-fatigue effects of anthocyanins of mulberry juice purification (MJP) and mulberry marc purification (MMP) from different varieties mulberry fruit in China, Food Chem. Toxicol., 2013, 59, 1–7 CrossRef CAS PubMed.
- Y. Jiang and W. J. Nie, Chemical properties in fruits of mulberry species from the Xinjiang province of China, Food Chem., 2015, 174, 460–466 CrossRef CAS PubMed.
- J. W. Choi, A. Synytsya, P. Capek, R. Bleha, R. Pohl and Y. I. Park, Structural analysis and anti-obesity effect of a pectic polysaccharide isolated from Korean mulberry fruit Oddi (Morus alba L.), Carbohydr. Polym., 2016, 146, 187–196 CrossRef CAS PubMed.
- T. Katsube, N. Imawaka, Y. Kawano, Y. Yamazaki, K. Shiwaku and Y. Yamane, Antioxidant flavonol glycosides in mulberry (Morus alba L.) leaves isolated based on LDL antioxidant activity, Food Chem., 2006, 97, 25–31 CrossRef CAS.
- C. Chen, Q. Huang, L.-J. You and X. Fu, Chemical property and impacts of different polysaccharide fractions from Fructus Mori. on lipolysis with digestion model in vitro, Carbohydr. Polym., 2017, 178, 360–367 CrossRef CAS PubMed.
- C. Chen, L. J. You, Q. Huang, X. Fu, B. Zhang, R. H. Liu and C. Li, Modulation of gut microbiota by mulberry fruit polysaccharide treatment of obese diabetic db/db mice, Food Funct., 2018, 9, 3732–3742 RSC.
- J. Gao, L. Lin, B. Sun and M. Zhao, A comparison study on polysaccharides extracted from Laminaria japonica using different methods: structural characterization and bile acid-binding capacity, Food Funct., 2017, 8, 3043–3052 RSC.
- Z. B. Wang, J. J. Pei, H. L. Ma, P. F. Cai and J. K. Yan, Effect of extraction media on preliminary characterizations and antioxidant activities of Phellinus linteus polysaccharides, Carbohydr. Polym., 2014, 109, 49–55 CrossRef CAS PubMed.
- Z. Cheng, Y. Zhang, H. Song, H. Zhou, F. Zhong, H. Hu and Y. Feng, Extraction optimization, characterization and antioxidant activity of polysaccharide from Gentiana scabra bge, Int. J. Biol. Macromol., 2016, 93, 369–380 CrossRef CAS PubMed.
- C. H. Su, M. N. Lai and L. T. Ng, Effects of different extraction temperatures on the physicochemical properties of bioactive polysaccharides from Grifola frondosa, Food Chem., 2017, 220, 400–405 CrossRef CAS PubMed.
- Z. Y. Zhao, Q. Zhang, Y. F. Li, L. L. Dong and S. L. Liu, Optimization of ultrasound extraction of Alisma orientalis polysaccharides by response surface methodology and their antioxidant activities, Carbohydr. Polym., 2015, 119, 101–109 CrossRef CAS PubMed.
- K. A. G. M. Dubois, J. K. Hamilton, P. Rebers and F. Smith, Colorimetric method for determination of sugars and related substances, Anal. Chem., 1956, 28, 350–356 CrossRef.
- M. Bradford, A rapid and sensitive method for the quantitation of microgram quantities of protein utilizing the principle of protein-dye binding, Anal. Biochem., 1976, 72, 248–254 CrossRef CAS PubMed.
- C. Li, X. Li, L. You, X. Fu and R. H. Liu, Fractionation, preliminary structural characterization and bioactivities of polysaccharides from Sargassum pallidum, Carbohydr. Polym., 2017, 155, 261–270 CrossRef CAS PubMed.
- C. Li, Q. Huang, X. Fu, X. J. Yue, R. H. Liu and L. J. You, Characterization, antioxidant and immunomodulatory activities of polysaccharides from Prunella vulgaris Linn, Int. J. Biol. Macromol., 2015, 75, 298–305 CrossRef CAS PubMed.
- Y. Liu, Y. Zhou, M. Liu, Q. Wang and Y. Li, Extraction optimization, characterization, antioxidant and immunomodulatory activities of a novel polysaccharide from the wild mushroom Paxillus involutus, Int. J. Biol. Macromol., 2018, 112, 326–332 CrossRef CAS PubMed.
- H. Liu, F. Chen, S. Lai, J. Tao, H. Yang and Z. Jiao, Effects of calcium treatment and low temperature storage on cell wall polysaccharide nanostructures and quality of postharvest apricot (Prunus armeniaca), Food Chem., 2017, 225, 87–97 CrossRef CAS PubMed.
- W. Wang, X. Wang, H. Ye, B. Hu, L. Zhou, S. Jabbar, X. Zeng and W. Shen, Optimization of extraction, characterization and antioxidant activity of polysaccharides from Brassica rapa L, Int. J. Biol. Macromol., 2016, 82, 979–988 CrossRef CAS PubMed.
- S. R. Thambiraj, M. Phillips, S. R. Koyyalamudi and N. Reddy, Yellow lupin (Lupinus luteus L.) polysaccharides: Antioxidant, immunomodulatory and prebiotic activities and their structural characterisation, Food Chem., 2018, 267, 319–328 CrossRef CAS PubMed.
- G. Chen, K. Chen, R. Zhang, X. Chen, P. Hu and J. Kan, Polysaccharides from bamboo shoots processing by-products: New insight into extraction and characterization, Food Chem., 2018, 245, 1113–1123 CrossRef CAS PubMed.
- C. Chen, L. J. You, A. M. Abbasi, X. Fu, R. H. Liu and C. Li, Characterization of polysaccharide fractions in mulberry fruit and assessment of their antioxidant and hypoglycemic activities in vitro, Food Funct., 2016, 7, 530–539 RSC.
- C. Chen, L. J. You, A. M. Abbasi, X. Fu and R. H. Liu, Optimization for ultrasound extraction of polysaccharides from mulberry fruits with antioxidant and hyperglycemic activity in vitro, Carbohydr. Polym., 2015, 130, 122–132 CrossRef CAS PubMed.
- H. Zeng, S. Miao, Y. Zhang, S. Lin, Y. Jian, Y. Tian and B. Zheng, Isolation, preliminary structural characterization and hypolipidemic effect of polysaccharide fractions from Fortunella margarita (Lour.) Swingle, Food Hydrocolloids, 2016, 52, 126–136 CrossRef CAS.
- E. Nurmamat, H. Xiao, Y. Zhang and Z. Jiao, Effects of Different Temperatures on the Chemical Structure and Antitumor Activities of Polysaccharides from Cordyceps militaris, Polymers, 2018, 10, 430 CrossRef.
- A. Synytsya, W.-J. Kim, S.-M. Kim, R. Pohl, A. Synytsya, F. Kvasnička, J. Čopíková and Y. Il Park, Structure and antitumour activity of fucoidan isolated from sporophyll of Korean brown seaweed Undaria pinnatifida, Carbohydr. Polym., 2010, 81, 41–48 CrossRef CAS.
- Y. Chen, M.-Y. Xie, S.-P. Nie, C. Li and Y.-X. Wang, Purification, composition analysis and antioxidant activity of a polysaccharide from the fruiting bodies of Ganoderma atrum, Food Chem., 2008, 107, 231–241 CrossRef CAS.
- L. Wang, C. Chen, B. Zhang, Q. Huang, X. Fu and C. Li, Structural characterization of a novel acidic polysaccharide from Rosa roxburghii Tratt fruit and its alpha-glucosidase inhibitory activity, Food Funct., 2018, 9, 3974–3985 RSC.
- K. H. Musa, A. Abdullah and A. Al-Haiqi, Determination of DPPH free radical scavenging activity: application of artificial neural networks, Food Chem., 2016, 194, 705–711 CrossRef CAS PubMed.
- D. Villaño, M. S. Fernández-Pachón, A. M. Troncoso and M. C. García-Parrilla, The antioxidant activity of wines determined by the ABTS+ method: influence of sample dilution and time, Talanta, 2004, 64, 501–509 CrossRef PubMed.
- W. Zhang, C. Li, L.-J. You, X. Fu, Y.-S. Chen and Y.-Q. Luo, Structural identification of compounds from Toona sinensis leaves with antioxidant and anticancer activities, J. Funct. Foods, 2014, 10, 427–435 CrossRef CAS.
- L. You, Q. Gao, M. Feng, B. Yang, J. Ren, L. Gu, C. Cui and M. Zhao, Structural characterisation of polysaccharides from Tricholoma matsutake and their antioxidant and antitumour activities, Food Chem., 2013, 138, 2242–2249 CrossRef CAS PubMed.
- C. Jiang, M. Wang, J. Liu, D. Gan and X. Zeng, Extraction, preliminary characterization, antioxidant and anticancer activities in vitro of polysaccharides from Cyclina sinensis, Carbohydr. Polym., 2011, 84, 851–857 CrossRef CAS.
- Z. Wu, Effect of different drying methods on chemical composition and bioactivity of finger citron polysaccharides, Int. J. Biol. Macromol., 2015, 76, 218–223 CrossRef CAS PubMed.
- D. Chen, Y. Guo, J. Chen, S. Chen, S. Zhong, W. Wang, X. Qin and G. O. University, Study on Effect of Different Extraction Temperatures on Antioxidant Activity of Crude Polysaccharides from Piper sarmentosum Roxb, Farm Products Processing, 2016 Search PubMed.
- L. Ma, H. Chen, W. Zhu and Z. Wang, Effect of different drying methods on physicochemical properties and antioxidant activities of polysaccharides extracted from mushroom Inonotus obliquus, Food Res. Int., 2013, 50, 633–640 CrossRef CAS.
- L. Sun, C. Wang, Q. Shi and C. Ma, Preparation of different molecular weight polysaccharides from Porphyridium cruentum and their antioxidant activities, Int. J. Biol. Macromol., 2009, 45, 42–47 CrossRef CAS PubMed.
- C. Chen, B. Zhang, Q. Huang, X. Fu and R. H. Liu, Microwave-assisted extraction of polysaccharides from Moringa oleifera Lam. leaves: Characterization and hypoglycemic activity, Ind. Crops Prod., 2017, 100, 1–11 CrossRef CAS.
- S. Chen, H. Chen, J. Tian, Y. Wang, L. Xing and J. Wang, Chemical modification, antioxidant and α-amylase inhibitory activities of corn silk polysaccharides, Carbohydr. Polym., 2013, 98, 428–437 CrossRef CAS PubMed.
- H.-F. Tan and C.-Y. Gan, Polysaccharide with antioxidant, α-amylase inhibitory and ACE inhibitory activities from Momordica charantia, Int. J. Biol. Macromol., 2016, 85, 487–496 CrossRef CAS PubMed.
- Y.-F. Wang, J. Wang, J. Wu, P. Xu, Y.-Q. Wang, J.-J. Gao and D. Hochstetter, In vitro antioxidant activity and potential inhibitory action against α-glucosidase of polysaccharides from fruit peel of tea (Camellia sinensis L.), J. Zhejiang Univ., Sci., B, 2014, 15, 173–180 CrossRef CAS PubMed.
- Q. Shen, J. Shao, Q. Peng, W. Zhang, L. Ma, A. S. Chan and L. Gu, Hydroxycoumarin derivatives: novel and potent α-glucosidase inhibitors, J. Med. Chem., 2010, 53, 8252–8259 CrossRef CAS PubMed.
- Z. Feng, W. Dou, S. Alaxi, Y. Niu and L. Yu, Modified soluble dietary fiber from black bean coats with its rheological and bile acid binding properties, Food Hydrocolloids, 2017, 62, 94–101 CrossRef CAS.
- J.-L. Hu, S.-P. Nie, C. Li and M.-Y. Xie, In vitro effects of a novel polysaccharide from the seeds of Plantago asiatica L. on intestinal function, Int. J. Biol. Macromol., 2013, 54, 264–269 CrossRef CAS PubMed.
| This journal is © The Royal Society of Chemistry 2019 |

