Dietary methionine restriction reduces hepatic steatosis and oxidative stress in high-fat-fed mice by promoting H2S production†
Yuhui
Yang‡
 ab,
Yanan
Wang‡
b,
Jin
Sun
 ab,
Jiahong
Zhang
b,
Haitao
Guo
b,
Yonghui
Shi
ab,
Xiangrong
Cheng
ab,
Xue
Tang
ab and
Guowei
Le
ab,
Jiahong
Zhang
b,
Haitao
Guo
b,
Yonghui
Shi
ab,
Xiangrong
Cheng
ab,
Xue
Tang
ab and
Guowei
Le
 *ab
*ab
aState Key Laboratory of Food Science and Technology, Jiangnan University, Wuxi, Jiangsu 214122, China. E-mail: lgw@jiangnan.edu.cn; Fax: +(86)510-85869236; Tel: +(86)510-85917789
bCenter for Food Nutrition and Functional Food Engineering, School of Food Science and Technology, Jiangnan University, Wuxi, Jiangsu 214122, China
First published on 17th November 2018
Abstract
Methionine is an essential amino acid that plays important roles in mammalian metabolism. Interestingly, previous studies have consistently shown that a methionine-restricted diet (MRD) reduces hepatic lipid levels, reactive oxygen species production, and oxidative stress damage. However, the mechanisms responsible for these beneficial effects are unknown. Therefore, our study was aimed at investigating the hepatic systemic metabolic responses to MRD in high-fat-diet (HFD) mice and to clarify the possible mechanisms of such responses. C57BL/6J mice were fed a control diet (0.86% methionine + 4% fat), HFD (0.86% methionine + 20% fat), or MRD (0.17% methionine + 20% fat) for 22 consecutive weeks, and euthanized at week 11 or week 22. Our results showed that HFD inhibited hepatic energy expenditure, induced steatosis and oxidative stress, and decreased hydrogen sulfide (H2S) production in the mouse liver. MRD reduced the body weight, liver fat percentage, and plasma and hepatic lipid profiles. Moreover, MRD decreased lipid synthesis, increased energy metabolism (e.g. lipid catabolism and fatty acid oxidation, glycolysis and tricarboxylic acid cycle metabolism, and amino acid catabolism), enhanced the activity of antioxidant enzymes, and reduced the levels of oxidative damage products and purine metabolism in the liver. Furthermore, MRD up-regulated the hepatic gene and protein expression of cystathionine-γ-lyase (CSE), elevated the hepatic CSE activity, and promoted hepatic H2S production. These findings suggest that MRD can ameliorate the hepatic metabolic disorders induced by HFD and especially reduce hepatic steatosis and oxidative stress likely through increasing hepatic H2S production.
1. Introduction
Nonalcoholic fatty liver disease (NAFLD) is rapidly becoming the most common chronic liver disease worldwide.1,2 The prevalence of NAFLD is 20–30% in the general adult population, and it seems to be increasing in recent years with a higher prevalence in developed countries.3 Particularly noteworthy, and with important implications for the future burden of the disease, is the increasing prevalence of NAFLD in children and young adults.4 Numerous previous studies have demonstrated that NAFLD is strongly associated with the components of the metabolic syndrome, such as obesity, diabetes, hypertension, dyslipidemia, and cardiovascular disease.2,5 NAFLD is characterized by hepatic steatosis induced by excessive accumulation of lipids in liver tissues in the absence of alcohol abuse.6 The excess of nutrients, imbalance in the de novo lipogenesis/lipid catabolism ratio, and impaired exportation of hepatic lipids may be responsible for the hepatic steatosis observed in NAFLD.7 Animal models continue to play an important role in elucidating the pathophysiological mechanisms of NAFLD. The high-fat diet (HFD) is one of the best and most commonly used dietary models for NAFLD. HFD-induced obesity leads to NAFLD development through hepatic dysfunction induced by steatosis.8 The pathological process of NAFLD is often accompanied by enhanced oxidative stress and reduced antioxidant capacity. The increased production of reactive oxygen species (ROS) in this process is implicated in an altered redox balance, in which ROS attack cellular macromolecules and cause lipid peroxidation, and are identified in the liver of patients with and animal models of NAFLD.9 However, to date, no effective therapies for preventing and treating NAFLD have been found.Currently, several dietary interventions have been proposed as strategies for preventing and treating chronic liver diseases.10 Methionine is an essential amino acid necessary for normal growth and development in mammals. Moreover, it plays many vital roles in the metabolic processes in mammals, such as protein synthesis, DNA methylation, and the transsulfuration pathway.11 Interestingly, many past studies have consistently demonstrated that a methionine-restricted diet (MRD) has many beneficial health effects, including decreasing body weight, reducing hepatic lipid levels and ROS production, increasing hepatic stress resistance, and preventing age-related diseases.12–14 In humans, dietary methionine restriction may be achieved with a predominately vegan diet. A vegan diet is based almost exclusively on plant-derived products and includes no meat, fish, dairy, or eggs. Vegan diets are typically low in methionine (especially fruits, vegetables, some legumes, and nuts).11 We recently reported that MRD can increase the plasma and urinary levels of fatty acid oxidation products and glycolysis and tricarboxylic acid cycle (TCA) intermediates and reduce the plasma and urinary levels of oxidative stress-related indicators in HFD mice.15 Furthermore, a recent study has demonstrated that MRD triggers glucose uptake and glycolysis by increasing hydrogen sulfide (H2S) production in the skeletal muscle of mice fed a normal diet.16
Endogenous H2S is predominantly produced from L-cysteine by the enzymes cystathionine-γ-lyase (CSE, also known as CGL or CTH) and cystathionine-β-synthase (CBS) via the transsulfuration pathway in various organisms including mammals.17 H2S is increasingly being considered as an important regulator of many physiological and pathological processes.18 The liver is a major organ producing endogenous H2S under physiological conditions. H2S participates in the regulation of hepatic glucose metabolism, lipid metabolism, liver bioenergetics, and oxidative stress.19 Recently, Hine et al. reported that MRD enhances hepatic CSE activity and endogenous H2S production in mice fed a normal diet, and suggested the existence of a link between the endogenous H2S levels and the multiple benefits of MRD, including resistance to stress and extended longevity.20 However, to date, the effects of MRD on hepatic systemic metabolism and endogenous H2S production in HFD mice remain unknown. On the basis of these findings, we aimed at testing in this study the hypothesis that MRD can promote hepatic endogenous H2S production that reduces hepatic steatosis and oxidative stress induced by a HFD in mice.
2. Materials and methods
2.1. Animals and experimental design
This animal experiment was approved by the Animal Care and Use Committee of the Animal Nutrition Institute of Jiangnan University, and was performed according to the National Guidelines for Ethical Review of Experimental Animal Welfare. Fifty-four male C57BL/6J mice (aged approximately 4 weeks, weighing 18 ± 1 g) were purchased from the Nanjing Biomedical Research Institute of Nanjing University (Nanjing, China), and housed in an environmentally controlled animal laboratory (temperature 22 ± 2 °C, relative humidity 50 ± 10%, 12 h light/12 h dark cycle) at Jiangnan University Center for Animal Experiment (Wuxi, China). All experimental mice were allowed free access to food and drinking water during the whole process. After 1 week of acclimation, all mice were randomly assigned to three experimental groups (n = 18 per experimental group): (a) a control group fed with the control diet (CD, 0.86% methionine + 4% fat); (b) a high fat diet group fed with the high fat diet (HFD, 0.86% methionine + 20% fat); (c) a high fat + methionine-restricted diet group fed with the high fat plus methionine-restricted diet (MRD, 0.17% methionine + 20% fat). The whole experimental period was 22 consecutive weeks. The methionine content in the methionine-restricted diet was chosen according to previous studies.21,22 The ingredients of the three experimental diets are shown in Table S1.† The body weight of each mouse was measured weekly during the experimental period.2.2. Micro-computed tomography (CT) scan analysis
The liver fat content of mice were assayed under anesthesia (intraperitoneal injection of sodium pentobarbital) using a LaTheta X-ray CT scanner LCT-200 (Hitachi-Aloka Medical, Ltd, Japan).23 All mice were scanned at 2 mm intervals from the diaphragm to the pelvis, and the data were analyzed using the Visualization LaTheta 200 software (Hitachi-Aloka Medical Ltd, Japan). The liver fat percentage (%) was calculated as (liver fat content/liver weight) × 100.2.3. Sample collection
At the end of week 11, 9 mice randomly selected from each experimental group were fasted for 12 h, and anesthetized with sodium pentobarbital, and blood samples were collected in Eppendorf tubes containing sodium heparin as an anticoagulant. After being kept at 4 °C for 30 min, plasma samples were obtained by centrifugation at 3500 rpm for 15 min at 4 °C. All plasma samples were stored at −80 °C until ready for biochemical detection. Liver tissues were immediately collected, weighed, washed with sterile 0.9% (w/v) NaCl solution, and cut into two parts: one part for the analysis of histopathology, and the remaining part for biochemical analysis, and real-time quantitative polymerase chain reaction (RT-qPCR) and western blot analysis. At the end of week 22, the remaining 9 mice in each group were processed according to the method described above. Furthermore, liver tissues were also used for nuclear magnetic resonance (NMR) detection.2.4. Measurement of plasma and hepatic lipid parameters
The plasma concentrations of triglyceride (TG), total cholesterol (TC), low-density lipoprotein cholesterol (LDL-C), high-density lipoprotein cholesterol (HDL-C), and free fatty acid (FFA) were measured using kits according to the manufacturer's instructions (Nanjing Jiancheng Bioengineering Institute, China). Liver lipids were extracted according to a previously reported method with a little modification.24 Briefly, fresh liver tissue (100 mg) was homogenized with 2 mL of isopropanol. After supersonic treatment, the homogenate was centrifuged at 3000 rpm for 15 min. Subsequently, the supernatant was used with the aforementioned kits to measure TG, TC and FFA.2.5. Histological analysis of liver tissues
Histological analysis of liver tissues was performed by hematoxylin and eosin staining (H&E) according to the method of Torre-Villalvazo et al.25 The oil red O stain technique was used to visually elucidate the change of hepatic lipid content in mice.26 Photomicrographs were acquired using a CX31 RTSF microscope (Olympus Corporation, Tokyo, Japan) and Image-Pro Plus version 7.0 (Media Cybernetics). The stained tissue sections were evaluated at 200× magnification by a pathologist blind to the three experimental groups using 6 fields per section.272.6. Sample preparation and 1H NMR spectroscopy
The liver tissue samples were prepared according to a previously reported method with a little modification.28 Briefly, the liver tissue sample (approximately 50 mg) was extracted with 600 μL of a precooled methanol/water mixture (2/1, v/v) using a tissue lyser at 20 Hz for 90 s. The homogenate mixture was then sonicated in an ice bath to further break cells with three cycles (60 s sonication and 60 s break). The supernatant was collected following centrifugation of the homogenate sample at 12![[thin space (1/6-em)]](https://www.rsc.org/images/entities/char_2009.gif) 000 rpm and 4 °C for 10 min. This whole extracting procedure was further repeated twice. The three supernatants were combined and centrifuged at 12
000 rpm and 4 °C for 10 min. This whole extracting procedure was further repeated twice. The three supernatants were combined and centrifuged at 12![[thin space (1/6-em)]](https://www.rsc.org/images/entities/char_2009.gif) 000 rpm and 4 °C for 10 min. After removal of methanol in a speed vacuum system, the combined supernatant was lyophilized under vacuum. The obtained liver tissue powder was reconstituted in 600 μL phosphate buffer (0.15 M K2HPO4/NaH2PO4, pH 7.40, 0.1% NaN3, and 50% D2O) containing 0.001% 3-(trimethylsilyl) propionic-(2,2,3,3-d4) acid sodium salt (TSP) as a chemical shift reference (δ 0.00 ppm). After vortex mixing and centrifugation (12
000 rpm and 4 °C for 10 min. After removal of methanol in a speed vacuum system, the combined supernatant was lyophilized under vacuum. The obtained liver tissue powder was reconstituted in 600 μL phosphate buffer (0.15 M K2HPO4/NaH2PO4, pH 7.40, 0.1% NaN3, and 50% D2O) containing 0.001% 3-(trimethylsilyl) propionic-(2,2,3,3-d4) acid sodium salt (TSP) as a chemical shift reference (δ 0.00 ppm). After vortex mixing and centrifugation (12![[thin space (1/6-em)]](https://www.rsc.org/images/entities/char_2009.gif) 000 rpm, 4 °C, and 10 min), 550 μL of the supernatant was transferred into a 5 mm NMR tube for subsequent NMR analysis.
000 rpm, 4 °C, and 10 min), 550 μL of the supernatant was transferred into a 5 mm NMR tube for subsequent NMR analysis.
All NMR spectra of the liver extract samples were recorded by Wuhan Zhongke Metaboss Technology Co., Ltd (Wuhan, China). The test parameters were programmed according to the published literature.29 NMR spectra of liver extract samples were acquired at 298 K on a Bruker Avance III 600 MHz NMR spectrometer (600.13 MHz for proton frequency) equipped with a 5 mm TCI cryogenic inverse detection probe (Bruker Biospin, Rheinstetten, Germany). The 1H NMR spectra were acquired using the first increment of the nuclear Overhauser effect spectroscopy (NOESYGPPR1D) pulse sequence [recycle delay-G1-90°-t1-90°-tm-G2-90°-acquisition] with water presaturation during both the recycle delay (2 s) and the mixing time (tm, 100 ms). The 90° pulse was set to about 12.2 μs, and 32k data points over a spectral width of 20 ppm were collected for each spectrum. A total of 64 transients for spectra of liver extract samples were collected. For the purpose of resonance assignments, a range of two-dimensional NMR spectra (including 1H–1H correlation spectroscopy, 1H–1H total correlation spectroscopy, 1H–13C heteronuclear single quantum correlation, and 1H–13C heteronuclear multiple bond correlation spectra) were acquired on some representative liver extract samples.29,30
2.7. Data processing for metabonomic analysis
All NMR spectra were phase-adjusted and baseline-corrected manually using the software Mestrenova 6.1.1 (Mestrelab Research S.L., Spain) with the chemical shift referenced to TSP (δ 0.00). The peaks of 1H NMR spectra were unambiguously assigned to definite metabolites according to the chemical shifts, peaks multiplicities, and relative intensities as in the previous literature data,29,31,32 and in-house databases, and these metabolites were also confirmed individually, as previously reported,33 using two-dimensional NMR spectra data. The spectral regions of δ 0.80−9.00 were subsequently integrated into bins with a width of 0.01 ppm. Regions distorted by imperfect water saturation (δ 4.70–5.20) were discarded for all samples. Each bucket was then normalized to the liver tissue weights for liver extract samples (to reflect the absolute metabolite concentration) prior to statistical data analysis.The resulting datasets were then imported into the software package SIMCA-P 13.0 (Umetrics, Sweden). Multivariate data analysis was performed according to the previous literature.34–37 In brief, principal component analysis (PCA), partial least-squares discriminant analysis (PLS-DA), and orthogonal partial least-squares discriminant analysis (OPLS-DA) were used to explore the differentiation of three experimental groups and potential metabolic biomarkers. The quality of the three models was evaluated using the parameters R2 and Q2. R2 > 0.50 and Q2 > 0.50 indicate that the model is robust and has good fitness and prediction. The display analysis of variance of the cross-validated residuals (CV-ANOVA) and the permutation test (200 cycles) were carried out to evaluate the reliability of the model of PLS-DA. The S-plot (absolute p[1] > 0.05, p(corr)[1] > 0.50) and variable importance in the projection (VIP) values (VIP > 1.00) from the corresponding OPLS-DA model combined with statistical analysis (one-way ANOVA and Tukey's test, p < 0.05) was performed to select potential metabolic biomarkers. Only when simultaneously meeting the three criteria, these variables were ultimately confirmed as potential metabolic biomarkers.
2.8. Determination of oxidative stress-related parameters
ROS levels were measured in the whole blood and hepatic tissues by a luminol-dependent chemiluminescence assay as described by Kobayashi et al.38 The results of ROS production were expressed as relative light units (RLUs). The levels of advanced oxidation protein products (AOPPs) in plasma and liver were measured using the corresponding assay kits from Xiamen Huijia Bioengineering Institute (Xiamen, China). The levels of malondialdehyde (MDA), glutathione peroxidase (GSH-Px), reduced glutathione/oxidized glutathione (GSH/GSSG), and total antioxidant capacity (T-AOC) in the plasma and liver were measured with assay kits according to the instructions of the manufacturer (Nanjing Jiancheng Bioengineering Institute, Nanjing, China).2.9. Assays for endogenous H2S levels and CSE and CBS activities
Endogenous H2S levels in the plasma and liver were measured as described previously.39 The activities of CBS and CSE in the liver were determined using the corresponding assay kits from Xiamen Huijia Bioengineering Institute (Xiamen, China).2.10. Gene expression assays
Total RNA was extracted from liver tissue samples by using Trizol reagent (Biomiga, USA), according to a previously described method.40 The purity and amount of the isolated RNA were evaluated by measuring the A260/A280 ratio (1.80–2.00) and agarose gel electrophoresis. Subsequently, total RNA was reverse transcribed to cDNA according to the instructions of the manufacturer (MultiScribe Reverse Transcriptase; Applied Biosystems). The mRNA expression levels were analyzed by RT-qPCR. The primer sequences of fatty acid synthase (FAS), acetyl CoA carboxylase 1 (ACC1), stearoyl-coenzyme A desaturase 1 (SCD1), sterol regulatory element-binding protein-1c (SREBP1c), hormone sensitive lipase (HSL), peroxisome proliferator-activated receptor α (PPARα), carnitine palmitoyltransferase 1 (CPT1), cholesterol 7α-hydroxylase (CYP7A1), lipoprotein lipase (LPL), CBS, CSE, and flavin monooxygenase 3 (FMO3) are listed in Table S2.† These data are shown as a relative value after normalization to the mRNA expression level of β-actin.2.11. Western blot analysis
Fresh frozen liver tissues were lysed in ice-cold radioimmunoprecipitation assay (RIPA) lysis buffer supplemented with a protease inhibitor cocktail. The homogenate mixtures were centrifuged at 12![[thin space (1/6-em)]](https://www.rsc.org/images/entities/char_2009.gif) 000 rpm and 4 °C for 5 min. Then the supernatants were collected, and the protein concentrations were assayed with a BCA Kit (Pierce, Rockford, IL). Extracted protein samples were separated on 4–20% sodium dodecyl sulfate polyacrylamide gel electrophoresis (SDS-PAGE) and transferred onto a nitrocellulose membrane (Bio-Rad). The membranes were incubated with primary antibodies [anti-FAS-antibody (NB120-13550, Novus Biologicals), anti-HSL-antibody (ab45422, Abcam), anti-p-HSL-antibody (ab109400, Abcam), anti-FMO3-antibody (ab126711, Abcam), anti-CBS-antibody (ab135625, Abcam), anti-CSE-antibody (PA5-29725, Thermo Fisher), and anti-GAPDH-antibody (sc-25778, Santa Cruz Biotechnology)] at 4 °C overnight, and then blots were incubated for 1 h with horseradish peroxidase-conjugated secondary antibodies (anti Rabbit IgG (H&L), GenScript). Specific proteins were visualized by using ECL Plus (Amersham Biosciences). The resulting western blots were scanned and quantified using an automatic chemiluminescence imaging analysis system (Tannon 5200, Shanghai, China).
000 rpm and 4 °C for 5 min. Then the supernatants were collected, and the protein concentrations were assayed with a BCA Kit (Pierce, Rockford, IL). Extracted protein samples were separated on 4–20% sodium dodecyl sulfate polyacrylamide gel electrophoresis (SDS-PAGE) and transferred onto a nitrocellulose membrane (Bio-Rad). The membranes were incubated with primary antibodies [anti-FAS-antibody (NB120-13550, Novus Biologicals), anti-HSL-antibody (ab45422, Abcam), anti-p-HSL-antibody (ab109400, Abcam), anti-FMO3-antibody (ab126711, Abcam), anti-CBS-antibody (ab135625, Abcam), anti-CSE-antibody (PA5-29725, Thermo Fisher), and anti-GAPDH-antibody (sc-25778, Santa Cruz Biotechnology)] at 4 °C overnight, and then blots were incubated for 1 h with horseradish peroxidase-conjugated secondary antibodies (anti Rabbit IgG (H&L), GenScript). Specific proteins were visualized by using ECL Plus (Amersham Biosciences). The resulting western blots were scanned and quantified using an automatic chemiluminescence imaging analysis system (Tannon 5200, Shanghai, China).
2.12. Statistical analysis
All other experimental results were statistically analyzed using the software SPSS 17.0 (SPSSInc., Chicago, USA). The values were shown as the mean ± SEM for each experimental group. Statistical significance was evaluated using one-way ANOVA with a post hoc test of either Tukey's HSD (when equal variance could be assumed) or Tamhane's T2 (when equal variance could not be assumed). Analysis of association between different variables was carried out using Pearson's correlation coefficient (bivariate two-tailed). A p < 0.05 was considered statistically significant.3. Results
3.1. MRD normalized HFD-induced increases of the body weight, liver fat percentage, and plasma lipid levels
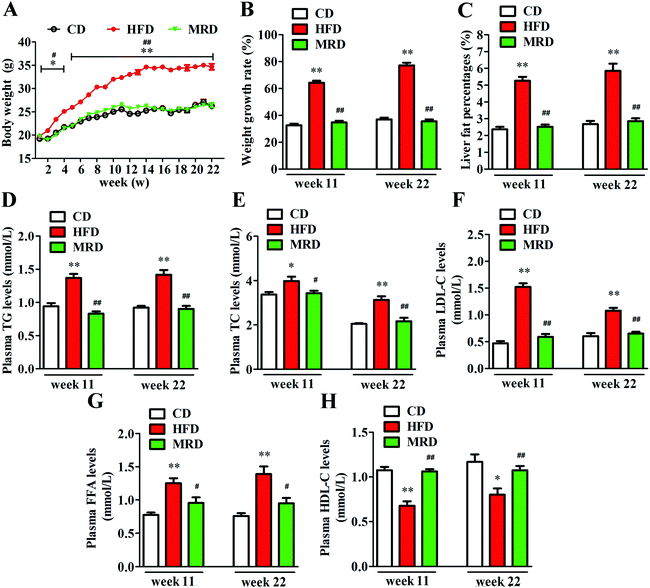
As shown in Fig. 1A, there were no significant differences in body weight among CD, HFD, and MRD mice at the beginning of the experiment (p > 0.05). However, from week 2 to the finish of this animal experiment, HFD significantly increased the body weight of mice compared with the CD mice (p < 0.05), but MRD significantly reduced the body weight of mice compared with the HFD mice (p < 0.05). In addition, compared with the CD mice, HFD also significantly increased the weight growth rate (Fig. 1B) of mice at weeks 11 and 22 (p < 0.01). MRD significantly decreased the weight growth rate of mice compared with the HFD mice at week 11 and week 22 (p < 0.01). Moreover, the liver fat percentages of all mice were examined by micro-CT scanning (Fig. S1†). Lahteta LCT-200 software analysis showed that the liver fat percentage (Fig. 1C) was significantly increased in the HFD mice compared with the CD mice at week 11 and week 22 (p < 0.01), while MRD remarkably decreased the liver fat percentage of mice compared with the HFD mice at week 11 and week 22 (p < 0.01). Furthermore, HFD significantly increased plasma TG (Fig. 1D), TC (Fig. 1E), LDL-C (Fig. 1F), and FFA (Fig. 1G) levels, and reduced plasma HDL-C (Fig. 1H) levels of mice compared with the CD mice at week 11 and week 22 (p < 0.05). MRD significantly decreased plasma TG, TC, LDL-C, and FFA levels, and increased plasma HDL-C levels of mice compared with the HFD mice at week 11 and week 22 (p < 0.05).3.2. MRD counteracted HFD-induced hepatic steatosis
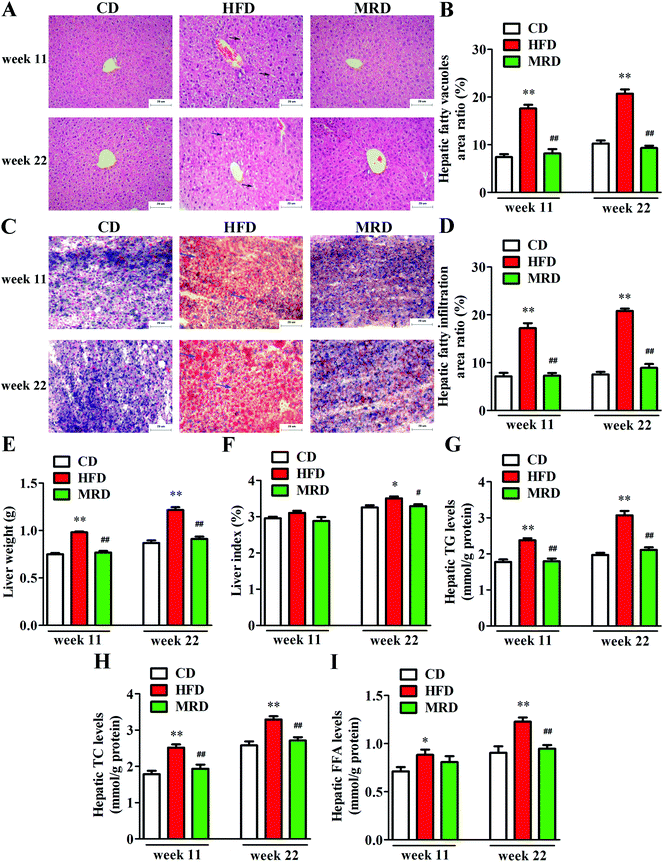
In order to visualize the changes of hepatic steatosis in mice, liver tissues were stained with H&E (Fig. 2A) and oil red O (Fig. 2C). Meanwhile, hepatic fatty vacuoles area ratio (Fig. 2B) and hepatic fatty infiltration area ratio (Fig. 2D) were quantitatively analyzed using Image-Pro Plus. HFD significantly increased the hepatic fatty vacuole area ratio and fatty infiltration area ratio of mice compared with the CD mice at week 11 and week 22 (p < 0.01), while MRD significantly decreased hepatic fatty vacuole area ratio and fatty infiltration area ratio of mice compared with the HFD mice at week 11 and week 22 (p < 0.01). Furthermore, compared with the CD mice, HFD significantly increased the liver weight (Fig. 2E), hepatic TG (Fig. 2G), TC (Fig. 2H), and FFA (Fig. 2I) levels at week 11 and week 22, and increased the liver index (Fig. 2F) at week 22 in mice (p < 0.05). Compared with the HFD mice, MRD significantly decreased the liver weight, hepatic TG and TC levels at week 11 and week 22, and reduced the liver index and hepatic FFA levels at week 22 in mice (p < 0.05).3.3. MRD reversed or normalized the HFD-induced variations in the content of hepatic metabolites
To further analyse the effects of MRD on the metabolic profiles of liver, 1H NMR spectroscopy coupled with appropriate multivariate data analysis techniques was performed on liver extracts of mice at week 22. Representative 1H NMR spectra of liver tissue samples obtained from randomly selected CD, HFD, and MRD mice are shown in Fig. 3. NMR signals in spectra were assigned to specific metabolites for 1H resonance (Table S3†). 56 metabolites were unambiguously assigned to the spectra of liver tissue samples. In order to obtain more detailed information about the metabolic differences of the mouse liver in the three experimental groups, multivariate data analyses were further performed on the 1H NMR spectra data.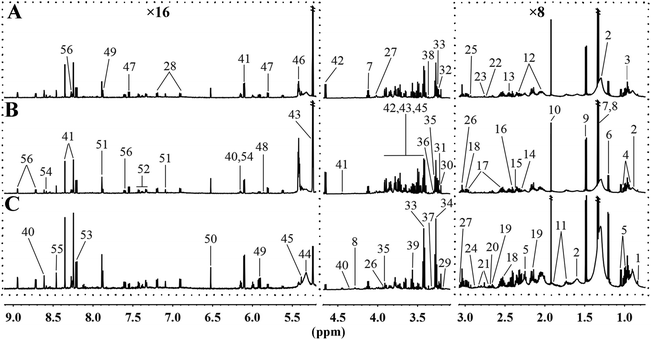 | ||
| Fig. 3 Representative 600 MHz 1H NMR spectra of liver tissue samples obtained from the randomly selected CD (A), HFD (B), and MRD (C) mice. CD, control diet group; HFD, high fat diet group; MRD, high fat + methionine-restricted diet group. The dashed boxes were perpendicularly enlarged 16 times (×16) or 8 times (×8). The keys for the metabolites are given in Table S3.† | ||
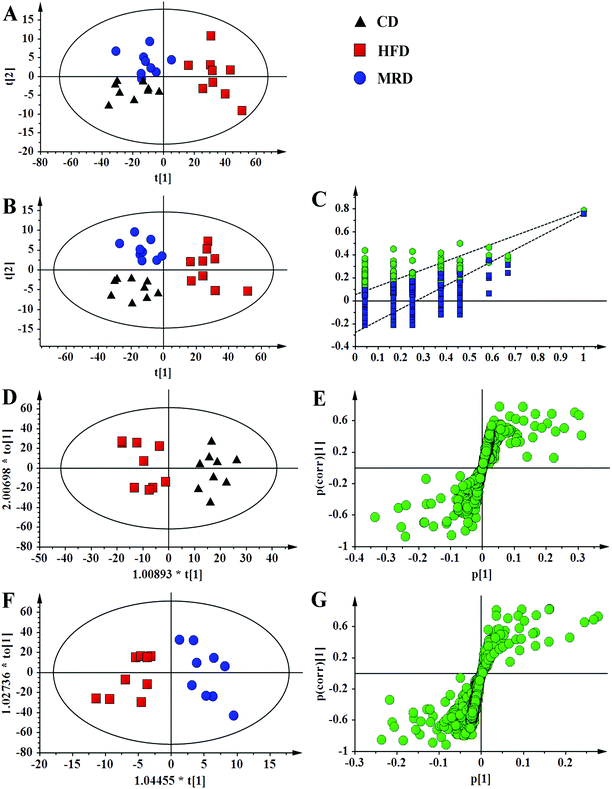
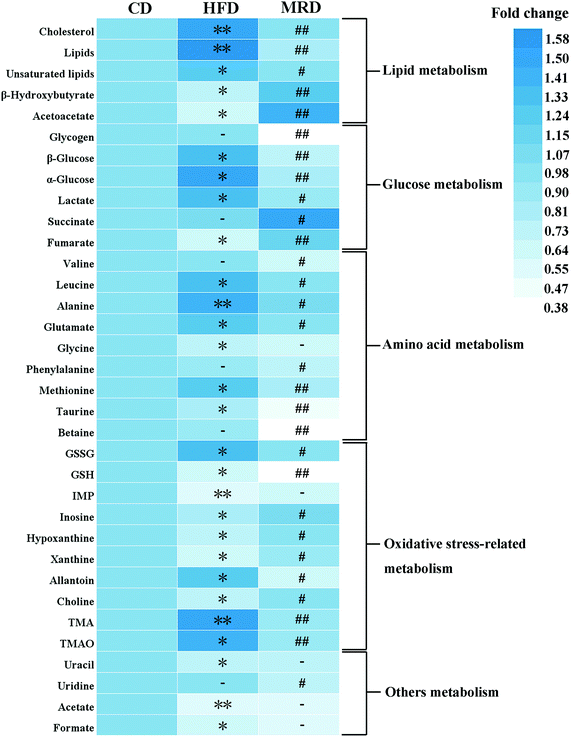
PCA (Fig. 4A), PLS-DA (Fig. 4B), and OPLS-DA (Fig. 4D and F) were conducted on the liver spectral data. Their results showed that there were no outliers within the dataset, and separations from the CD, HFD, and MRD mice were significant in their hepatic metabolic profiles, respectively. R2 and Q2 of the three models were all larger than 0.50 (Fig. 4), and demonstrated that the three models have good fitness and predictability. The validated models of CV-ANOVA (p < 0.05) and the permutation test (Fig. 4C) demonstrated that the models of liver tissue samples were robust and not overfitting. The S-plot indicated that a number of metabolites were responsible for the significant separations (in the corresponding OPLS-DA score plots) of the two experimental groups of liver tissue samples (Fig. 4E and G, respectively). These metabolites (absolute p[1] > 0.05, p(corr) > 0.50) were located on the upper right or lower left corner of the S-plot. Furthermore, according to the VIP values (threshold > 1.00) and the p values (threshold < 0.05), the screened differential metabolites are displayed in Fig. 5. The metabolites were found to play an important role in lipid metabolism, glucose metabolism, amino acid metabolism, oxidative stress-related metabolism, and other types of metabolism.
Compared with the CD mice, HFD significantly increased the hepatic levels of cholesterol, lipids, unsaturated lipids, β-glucose, α-glucose, lactate, leucine, alanine, glutamate, methionine, GSSG, allantoin, TMA, and TMAO, and decreased the hepatic levels of β-hydroxybutyrate, acetoacetate, fumarate, glycine, taurine, GSH, IMP, inosine, hypoxanthine, xanthine, choline, uracil, acetate, and formate in mice at week 22 (p < 0.05). However, MRD significantly decreased the hepatic levels of cholesterol, lipids, unsaturated lipids, glycogen, β-glucose, α-glucose, lactate, valine, leucine, alanine, glutamate, phenylalanine, methionine, taurine, betaine, GSSG, GSH, allantoin, TMA, TMAO, and uridine, and increased the hepatic levels of β-hydroxybutyrate, acetoacetate, succinate, fumarate, inosine, hypoxanthine, xanthine, and choline in mice compared with the HFD mice at week 22 (p < 0.05).
3.4. MRD abolished HFD-induced enhancement in hepatic lipid synthesis
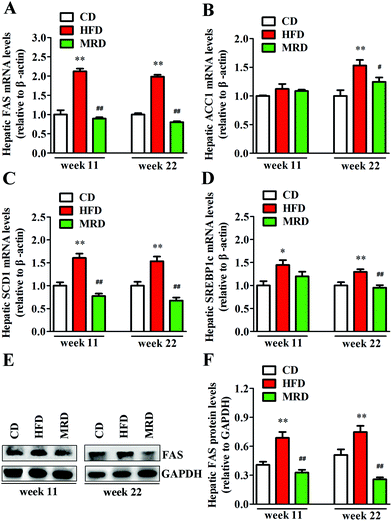
To further explore the effects of MRD on hepatic lipid metabolism, hepatic lipid synthesis-related genes and protein in mice were determined by RT-qPCR and western blotting. As shown in Fig. 6, HFD significantly up-regulated the hepatic mRNA and protein expression of FAS (Fig. 6A, E and F), mRNA expression of SCD1 (Fig. 6C) and SREBP1c (Fig. 6D) at week 11 and week 22, and mRNA expression of ACC1 (Fig. 6B) at week 22 in mice compared with the CD mice (p < 0.05), whereas MRD significantly down-regulated the hepatic mRNA and protein expression of FAS, mRNA expression of SCD1 at week 11 and week 22, and mRNA expression of ACC1 and SREBP1c at week 22 in mice compared with the HFD mice (p < 0.05).3.5. MRD reversed or increased HFD-induced decreases in hepatic lipid catabolism
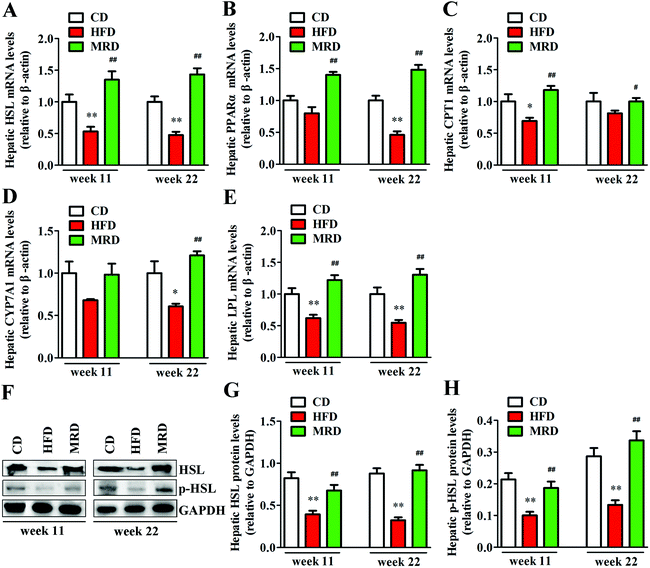
Hepatic lipid catabolism-related genes and proteins were also detected to confirm the effects of MRD on hepatic lipid metabolism in mice. As shown in Fig. 7, HFD significantly down-regulated the hepatic mRNA expression of HSL (Fig. 7A), protein expression of HSL and p-HSL (Fig. 7F–H), mRNA expression of LPL (Fig. 7E) at week 11 and week 22, mRNA expression of CPT1 (Fig. 7C) at week 11, and mRNA expression of PPARα (Fig. 7B) and CYP7A1 (Fig. 7D) at week 22 in mice compared with the CD mice (p < 0.05). However, MRD significantly up-regulated the hepatic mRNA expression of HSL, protein expression of HSL and p-HSL, mRNA expression of PPARα, CPT1, LPL at week 11 and week 22, and mRNA expression of CYP7A1 at week 22 in mice compared with the HFD mice (p < 0.05).3.6. MRD normalized HFD-induced hepatic oxidative stress
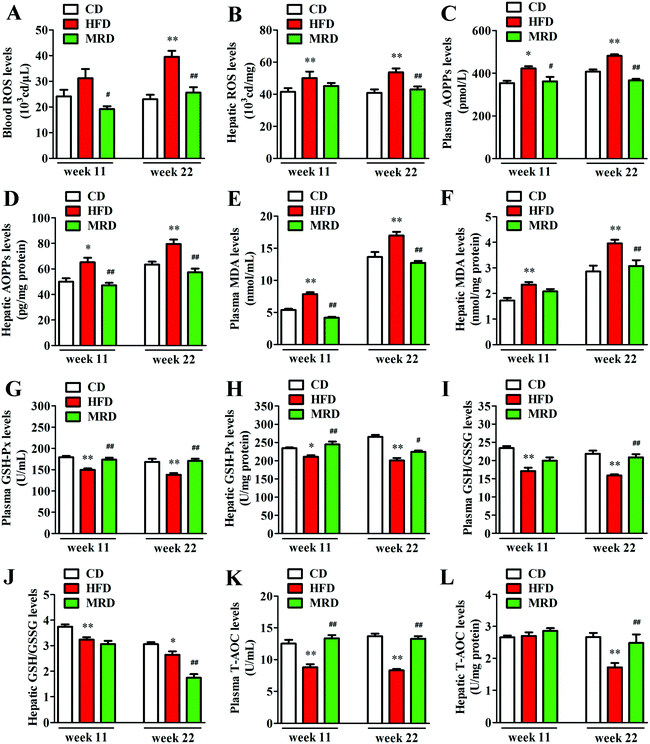
The levels of ROS in blood, ROS in liver, and AOPPs, MDA, GSH-Px, GSH/GSSG, and T-AOC in the plasma and liver were measured to illuminate the effects of MRD on oxidative stress in HFD mice. Compared with the CD mice, HFD significantly increased blood ROS (Fig. 8A) levels at week 22, increased the plasma AOPP (Fig. 8C) and MDA (Fig. 8E) levels at week 11 and week 22, and decreased the plasma GSH-Px (Fig. 8G), GSH/GSSG (Fig. 8I), and T-AOC (Fig. 8K) levels at week 11 and week 22 in mice (p < 0.05). In addition, HFD also significantly increased the hepatic ROS (Fig. 8B), AOPPs (Fig. 8D), and MDA (Fig. 8F) levels at week 11 and week 22, decreased the hepatic GSH-Px (Fig. 8H) and GSH/GSSG (Fig. 8J) levels at week 11 and week 22, and reduced T-AOC (Fig. 8L) levels at week 22 in mice (p < 0.05). However, compared with the HFD mice, MRD significantly decreased blood ROS, plasma AOPPs and MDA levels at week 11 and week 22, increased plasma GSH-Px and T-AOC levels at week 11 and week 22, and increased plasma GSH/GSSG levels at week 22 in mice (p < 0.05). MRD also significantly decreased hepatic AOPP levels at week 11 and week 22, reduced hepatic ROS, MDA, and GSH/GSSG levels at week 22, increased hepatic GSH-Px levels at week 11 and week 22, and increased hepatic T-AOC levels at week 22 in mice (p < 0.05).3.7. MRD reversed or normalized HFD-induced enhancements in hepatic TMAO production and purine metabolic pathways
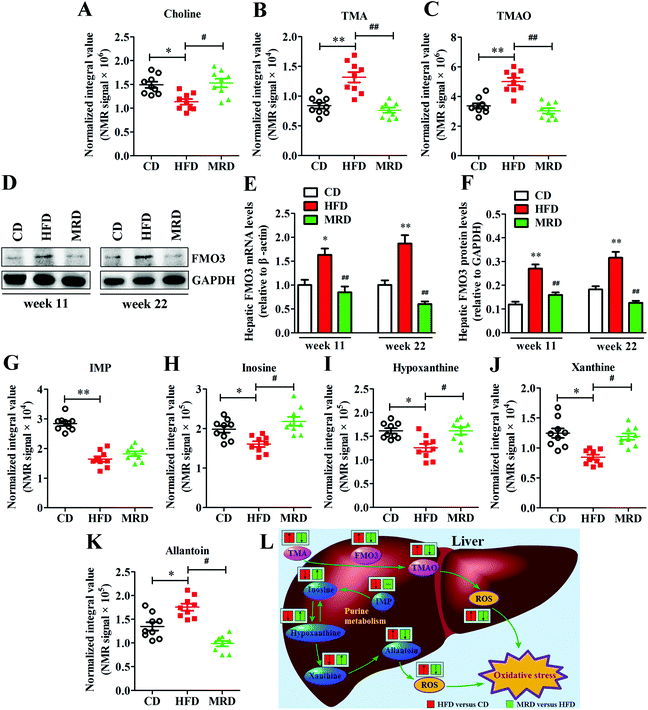
To further explore the effects of MRD on hepatic TMAO production, the hepatic gene and protein expressions of FMO3 were measured in mice. Compared with the CD mice, HFD significantly increased the mRNA and protein expression of FMO3 (Fig. 9D–F) in the mouse liver at week 11 and week 22 (p < 0.05), but MRD significantly decreased the mRNA and protein expression of FMO3 in the mouse liver compared with the HFD mice at week 11 and week 22 (p < 0.01). In addition, HFD also significantly increased hepatic TMA (Fig. 9B), TMAO (Fig. 9C), and allantoin (Fig. 9K) levels, and reduced hepatic choline (Fig. 9A), IMP (Fig. 9G), inosine (Fig. 9H), hypoxanthine (Fig. 9I), and xanthine (Fig. 9J) levels in mice compared with the CD mice at week 22 (p < 0.05), while MRD significantly decreased hepatic TMA, TMAO, and allantoin levels and increased hepatic choline, inosine, hypoxanthine, and xanthine levels in mice compared with the HFD mice at week 22 (p < 0.05).3.8. MRD reversed or increased HFD-induced decreases in plasma H2S levels and hepatic H2S production
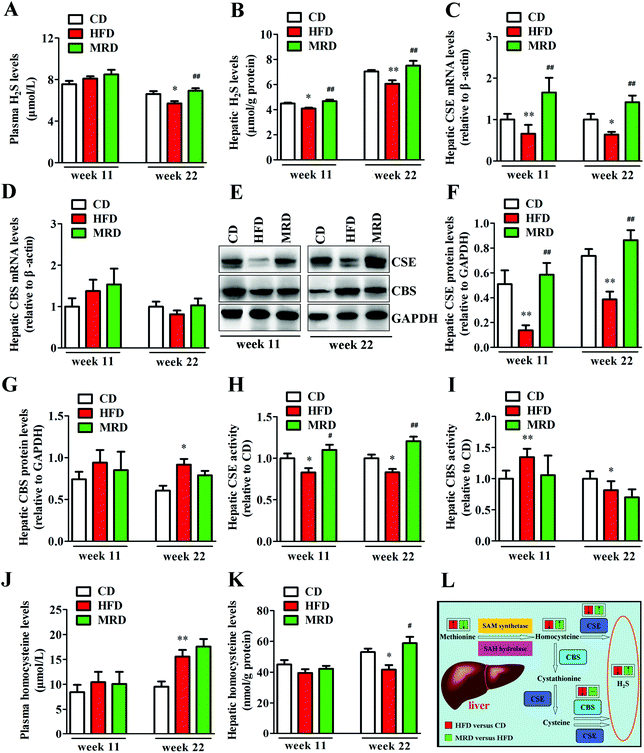
To explore potential mechanisms regarding the MRD regulation of hepatic lipid accumulation and oxidative stress, plasma H2S levels, hepatic H2S levels, and hepatic H2S production-related parameters were determined in mice. As shown in Fig. 10, HFD significantly decreased plasma H2S levels (Fig. 10A) at week 22, reduced hepatic H2S levels (Fig. 10B) at week 11 and week 22, down-regulated the hepatic mRNA and protein expression of CSE (Fig. 10C, E and F) at week 11 and week 22, reduced hepatic CSE activity (Fig. 10H) at week 11 and week 22, increased hepatic CBS protein levels (Fig. 10E and G) at week 22, increased hepatic CBS activity (Fig. 10I) at week 11, reduced hepatic CBS activity at week 22, increased plasma homocysteine levels, and decreased hepatic homocysteine levels at week 22 in mice compared with the CD mice (p < 0.05). However, compared with the HFD mice, MRD significantly increased plasma H2S levels at week 22, increased hepatic H2S levels at week 11 and week 22, up-regulated the hepatic mRNA and protein expression of CSE at week 11 and week 22, increased hepatic CSE activity at week 11 and week 22, and increased hepatic homocysteine levels at week 22 in mice (p < 0.05).3.9. Correlations between plasma/hepatic H2S levels and hepatic lipid metabolism-related parameters, and plasma/hepatic H2S levels and hepatic oxidative stress-related parameters
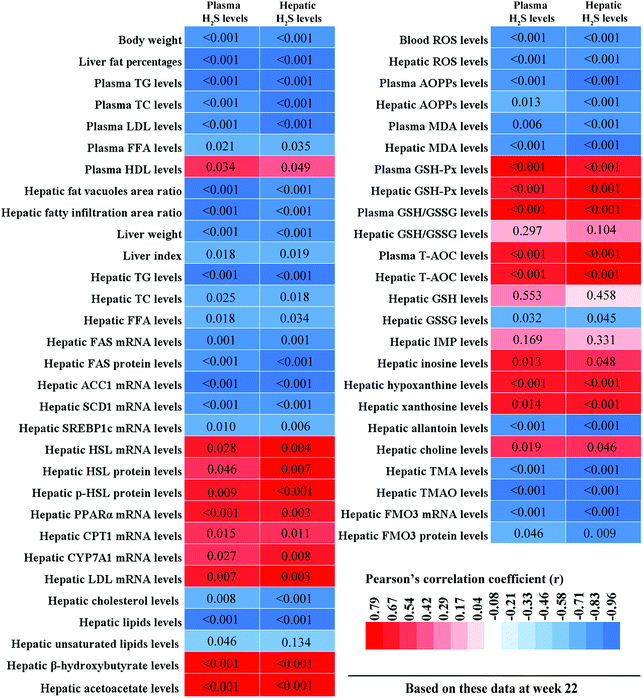
To clarify the relationships between hepatic lipid metabolism and H2S levels, and hepatic oxidative stress and H2S levels, we calculated the correlations between plasma/hepatic H2S levels and hepatic lipid metabolism-related parameters, and plasma/hepatic H2S levels and hepatic oxidative stress-related parameters, respectively. These results are displayed in Fig. 11. Plasma/hepatic H2S levels were negatively correlated with body weight, liver fat percentage, plasma TG, TC, LDL, and FFA levels, hepatic fatty vacuoles area ratio, hepatic fatty infiltration area ratio, liver weight, liver index, hepatic TG, TC, and FFA levels, hepatic FAS, ACC1, SCD1, and SREBP1c mRNA levels, hepatic FAS protein levels, hepatic cholesterol and lipid levels, blood ROS levels, plasma AOPPs and MDA levels, hepatic ROS, AOPPs, and MDA levels, hepatic GSSG, allantoin, TMA, and TMAO levels, and hepatic FMO3 mRNA and protein levels. In addition, plasma H2S levels were negatively correlated with hepatic unsaturated lipid levels. However, plasma/hepatic H2S levels and plasma HDL levels, hepatic HSL, PPARα, CPT1, CYP7A1, and LDL mRNA levels, hepatic HSL and p-HSL protein levels, hepatic β-hydroxybutyrate and acetoacetate levels, plasma GSH-Px, GSH/GSSG, and T-AOC levels, hepatic GSH-Px, GSH/GSSG, and T-AOC levels, hepatic inosine, hypoxanthine, xanthine, and choline levels were positively correlated.4. Discussion
In this study, we included plasma lipid levels, hepatic lipid levels, hepatic systemic metabolite levels, hepatic lipid synthesis- and lipid catabolism-related parameters, hepatic oxidative stress-related indicators, and plasma and hepatic H2S production-related parameters as the analysis variables. Moreover, we also calculated that the correlations between plasma/hepatic H2S levels and hepatic lipid metabolism-related parameters, and between plasma/hepatic H2S levels and hepatic oxidative stress-related parameters. The results supported the hypothesis that MRD can reduce hepatic steatosis and oxidative stress induced by HFD, which are likely mediated by increased H2S production.HFD-induced hepatic steatosis was significantly reversed and normalized by MRD through the stimulation of hepatic energy expenditure in this study. This conclusion is supported by the following 5 findings. First, MRD reduced lipid accumulation in the liver. The decrease in the liver weight, liver index, liver fat percentage, hepatic fatty vacuoles area ratio, hepatic fatty infiltration area ratio, hepatic TG, TC, and FFA levels in the MRD mice compared with the HFD mice suggested that MRD reduced hepatic lipid accumulation. Consistent with this finding, the results of hepatic metabolome analysis also demonstrated that MRD significantly decreased the hepatic cholesterol, lipid, and unsaturated lipid levels in mice. Furthermore, these findings are also supported by the observed reduction in body weight and weight growth rate, as well as in plasma TG, TC, LDL, and FFA levels, and the increased plasma HDL levels in the MRD mice. Consistent with our results, previous studies have demonstrated that MRD decreased the plasma and hepatic TG and TC levels in HFD mice or ob/ob mice.41,42 Second, MRD decreased lipid synthesis in the liver. The down-regulated hepatic expression of the lipid synthesis-related genes FAS, ACC1, SCD1, and SREBP1c and that of the protein FAS in the MRD mice compared with the HFD mice implied that MRD suppressed hepatic lipid synthesis. Third, MRD promoted lipid catabolism and fatty acid oxidation in the liver. MRD significantly up-regulated the hepatic expression of the lipid catabolism-related genes HSL, PPARα, CPT1, CYP7A1, and LPL and the protein expression of HSL and p-HSL in mice compared with the HFD mice, thus indicating that MRD promoted lipid catabolism and fatty acid oxidation. Furthermore, the elevated levels of hepatic ketone bodies (such as β-hydroxybutyrate and acetoacetate) in the MRD mice compared with the HFD mice also suggest that MRD promoted hepatic fatty acid oxidation. This finding is in agreement with that of our previous study showing that MRD increased the plasma and urinary levels of β-hydroxybutyrate and acetoacetate in HFD mice.15 Fourth, MRD promoted glycolysis and TCA metabolism in the liver. The decreased hepatic glycogen, α-glucose, and β-glucose levels in the MRD mice compared with the HFD mice indicated that MRD promoted hepatic glycolysis metabolism. Further supporting this notion, MRD significantly increased the hepatic succinate and fumarate levels in mice compared with the HFD mice, because succinate and fumarate are important intermediate metabolites of the TCA metabolism.43 Fifth, MRD increased the amino acid catabolism in the liver. MRD significantly reduced the hepatic valine, leucine, alanine, glutamate, and phenylalanine levels in mice compared with the HFD mice, suggesting that MRD increased the hepatic amino acid catabolism. This finding can be explained by the fact that amino acids can be broken down to provide energy, because most amino acids are glucogenic.44,45 In addition, our previous study found that MRD significantly decreased the plasma glutamate and tyrosine levels, and increased the plasma ammonia and urinary urea nitrogen levels in HFD mice, which also supports this idea.15 Taken together, MRD limited ongoing hepatic lipid accumulation by increasing the hepatic energy expenditure. Subsequently, this generated energy is used to maintain the functions of existing organs and tissues.46
MRD produced the aforementioned effects by promoting hepatic H2S production. The liver is an important organ producing endogenous H2S, which can be regulated endogenously by the enzymatic activity of CSE and CBS in the transsulfuration pathway (Fig. 10L).47 In the present study, MRD significantly increased the plasma and hepatic H2S levels, up-regulated the hepatic gene and protein expression of CSE, and increased the hepatic CSE activity in mice compared with the HFD mice, thus indicating that MRD promoted endogenous H2S production by increasing hepatic CSE activity. This finding is in agreement with a previous study showing that MRD increased H2S production through increasing the activity of the CSE enzyme in the skeletal muscle of mice fed a normal diet.16 Interestingly, a previous study reported that CSE-knockout mice given an atherogenic diet showed increased plasma lipid levels and early development of atherosclerosis when compared with wild-type mice. Moreover, sodium hydrosulfide supplementation improved the plasma lipid profile and decreased the formation of atherosclerotic lesions.48 In addition, endogenous H2S or H2S donor supplementation has the potential to preserve normal lipid metabolism under physiological or pathophysiological conditions.49 Furthermore, H2S can promote mitochondrial energy production in eukaryotes,50 and increase glucose uptake and glycolytic ATP production in skeletal muscle.16 Therefore, in this study, we inferred that MRD reduced hepatic lipid accumulation likely through promoting H2S production in HFD mice. This contention is further supported by the positive correlation observed between plasma/hepatic H2S levels and hepatic lipid catabolism-related parameters, and the negative association found between plasma/hepatic H2S levels and hepatic lipid synthesis-related parameters (Fig. 11). In this study, MRD also significantly decreased the levels of hepatic methionine and its metabolite taurine,51 and increased the levels of the methionine metabolite homocysteine. This implies that, during methionine deprivation, the metabolic process of taurine production was reduced to save the methionine source in the liver, and increasing the hepatic homocysteine levels, which was beneficial to H2S production. Moreover, MRD significantly decreased the levels of hepatic betaine, which can be used as a substitute for supplementary methionine in animal diets,52 indicating that betaine was also used to save methionine.
The finding that MRD promoted hepatic H2S production also supports the notion that MRD reduces hepatic oxidative stress. Cells continuously produce free radicals in energy generation processes. These free radicals are balanced by an elaborate antioxidant defense system consisting of enzymes. If the increase in the concentration of free radicals is greater than the ability to neutralize them, the excess radicals will attack cellular components and induce oxidative stress damage.53,54 In this study, we found that MRD increased hepatic energy metabolism, which may induce an increase in the hepatic oxidative stress. However, our results showed that MRD significantly decreased the levels of ROS, AOPPs, and MDA, increased the levels of GSH-Px and T-AOC in the plasma and liver, and increased the plasma GSH/GSSG levels in mice compared with the HFD mice, indicating that MRD prevented hepatic oxidative stress induced by HFD or increased the energy metabolism. Also supporting this view, previous studies found that MRD decreased the hepatic mitochondrial ROS production.55 GSH is a key antioxidant enzyme and intracellular antioxidant.56 Paradoxically, MRD significantly decreased the hepatic GSH, GSSG, and GSH/GSSG levels, and the reason can be described as follows: on the one hand, the synthesis of hepatic GSH was decreased because of the reduced methionine source; on the other hand, the hepatic oxidative stress was reduced through other antioxidant pathways in the liver. Allantoin is the end product of purine metabolism in mice, and IMP, inosine, xanthine, and hypoxanthine are the intermediate metabolites in this metabolic process, along with the generation of ROS.57,58 Allantoin has been used as a potential marker for monitoring oxidative status.59 In this study, we observed that MRD significantly decreased the hepatic allantoin levels, and increased the hepatic inosine, xanthine, and hypoxanthine levels, suggesting that MRD ameliorated the antioxidative system by interfering with the purine metabolism pathway (Fig. 9L). Moreover, TMAO is produced by the hepatic enzyme FMO3 from TMA, which is exclusively generated from the breakdown of choline and its compounds through the gut microbiota.60 Previous studies have proved that TMAO can induce oxidative stress.61,62 In this study, the reduced levels of hepatic TMAO and TMA decreased the gene and protein expression of FMO3 and increased the hepatic choline levels in the MRD mice compared with the HFD mice. These results also suggested that MRD reduced hepatic oxidative stress induced by HFD through the inhibition of TMAO production (Fig. 9L). H2S is increasingly being recognized as an important antioxidant. Numerous studies have suggested that endogenous and exogenous H2S play critical roles in the inhibition of ROS generation and stimulation of antioxidants.63,64 Therefore, MRD reduced hepatic oxidative stress likely by promoting H2S production in HFD mice. This contention is further supported by the positive correlation observed between plasma/hepatic H2S levels and antioxidant enzyme-related parameters, and the negative association found between plasma/hepatic H2S levels and oxidative stress damage-related parameters (Fig. 11).
5. Conclusions
In summary, our findings revealed that MRD reduced hepatic steatosis by decreasing hepatic lipid synthesis and increasing hepatic energy metabolism (e.g. increasing lipid catabolism and fatty acid oxidation, glycolysis and TCA metabolism, and amino acid catabolism). In addition, MRD also reduced hepatic oxidative stress through enhancing the activity of antioxidant enzymes, and reducing the levels of oxidative damage products and purine metabolism. Furthermore, MRD increased hepatic H2S production by up-regulating the hepatic gene and protein expression of CSE and enhancing hepatic CSE activity. Therefore, MRD reduced hepatic steatosis and oxidative stress likely by promoting hepatic H2S production in HFD mice. We suggest that MRD can be used as a treatment for preventing and treating chronic hepatic metabolic diseases induced by high calorie intake, such as fatty liver. MRD without calorie restriction may be more easily applied to human populations. Foods containing proteins that are low in methionine but otherwise high in quality include vegan staples (e.g. lentils, garbanzos, and other beans). Simple diet modifications such as decreasing meat intake and/or increasing the consumption of fruits, vegetables, and beans are feasible nutritional strategies for promoting liver health.Ethical approval
All the procedures performed in studies involving animals were in accordance with the ethical standards laid down in the Guidelines for Laboratory Animal Care of Jiangsu Province (China) and in the 1964 Declaration of Helsinki and its later amendments.Conflicts of interest
There are no conflicts of interest to declare.Acknowledgements
This work received financial support from the 12th 5 Year Plan for Science and Technology Development (No. 2012BAD33B05), State Key Laboratory of Food Science and Technology of Jiangnan University in China (No. SKLF-ZZB-201609), National Natural Science Foundation of China (No. 31571841 and 31700301), Collaborative Innovation Center of Food Safety and Quality Control in Jiangsu Province, Postgraduate Research and Practice Innovation Program of Jiangsu Province (No. KYLX16_0821).References
- L. A. Adams, Q. M. Anstee, H. Tilg and G. Targher, Gut, 2017, 66, 1138–1153 CrossRef PubMed.
- Z. M. Younossi, A. B. Koenig, D. Abdelatif, Y. Fazel, L. Henry and M. Wymer, Hepatology, 2016, 64, 73–84 CrossRef PubMed.
- Y. Rotman and A. J. Sanyal, Gut, 2017, 66, 180–190 CrossRef CAS PubMed.
- J. K. Dowman, J. W. Tomlinson and P. N. Newsome, QJM, 2010, 103, 71–83 CrossRef CAS PubMed.
- N. E. Aguilar-Olivos, P. Almeda-Valdes, C. A. Aguilar-Salinas, M. Uribe and N. Mendez-Sanchez, Metab., Clin. Exp., 2016, 65, 1196–1207 CrossRef CAS.
- M. Gogiashvili, K. Edlund, K. Gianmoena, R. Marchan, A. Brik, J. T. Andersson, J. Lambert, K. Madjar, B. Hellwig, J. Rahnenfuhrer, J. G. Hengstler, R. Hergenroder and C. Cadenas, Anal. Bioanal. Chem., 2017, 409, 1591–1606 CrossRef CAS PubMed.
- R. Valenzuela and L. A. Videla, Food Funct., 2011, 2, 644–648 RSC.
- M. A. Van Herck, L. Vonghia and S. M. Francque, Nutrients, 2017, 9, 1072–1085 CrossRef PubMed.
- C. Podrini, M. Borghesan, A. Greco, V. Pazienza, G. Mazzoccoli and M. Vinciguerra, Curr. Pharm. Des., 2013, 19, 2737–2746 CrossRef CAS PubMed.
- M. C. Hernandez-Rodas, R. Valenzuela and L. A. Videla, Int. J. Mol. Sci., 2015, 16, 25168–25198 CrossRef CAS PubMed.
- P. Cavuoto and M. F. Fenech, Cancer Treat. Rev., 2012, 38, 726–736 CrossRef CAS.
- M. L. Orgeron, K. P. Stone, D. Wanders, C. C. Cortez, N. T. Van and T. W. Gettys, Prog. Mol. Biol. Transl., 2014, 121, 351–376 CAS.
- X. H. Zhou, L. Q. He, D. Wan, H. S. Yang, K. Yao, G. Y. Wu, X. Wu and Y. L. Yin, Amino Acids, 2016, 48, 1533–1540 CrossRef CAS.
- I. Sanchez-Roman and G. Barja, Exp. Gerontol., 2013, 48, 1030–1042 CrossRef CAS.
- Y. H. Yang, J. H. Zhang, G. Q. Wu, J. Sun, Y. N. Wang, H. T. Guo, Y. H. Shi, X. R. Cheng, X. Tang and G. W. Le, Food Funct., 2018, 9, 3718–3731 RSC.
- A. Longchamp, T. Mirabella, A. Arduini, M. R. MacArthur, A. Das, J. H. Trevino-Villarreal, C. Hine, I. Ben-Sahra, N. H. Knudsen, L. E. Brace, J. Reynolds, P. Mejia, M. Tao, G. Sharma, R. Wang, J. M. Corpataux, J. A. Haefliger, K. H. Ahn, C. H. Lee, B. D. Manning, D. A. Sinclair, C. S. Chen, C. K. Ozaki and J. R. Mitchell, Cell, 2018, 173, 117–129 CrossRef CAS.
- H. Kimura, Exp. Physiol., 2011, 96, 833–835 CrossRef CAS.
- R. Wang, Physiol. Rev., 2012, 92, 791–896 CrossRef CAS PubMed.
- S. Mani, W. Cao, L. Y. Wu and R. Wang, Nitric Oxide-Biol. Ch., 2014, 41, 62–71 CrossRef CAS PubMed.
- C. Hine, E. Harputlugil, Y. Zhang, C. Ruckenstuhl, B. C. Lee, L. Brace, A. Longchamp, J. H. Trevino-Villarreal, P. Mejia, C. K. Ozaki, R. Wang, V. N. Gladyshev, F. Madeo, W. B. Mair and J. R. Mitchell, Cell, 2015, 160, 132–144 CrossRef CAS.
- C. E. Perrone, D. A. L. Mattocks, M. Jarvis-Morar, J. D. Plummer and N. Orentreich, Metab., Clin. Exp., 2010, 59, 1000–1011 CrossRef CAS.
- K. P. Stone, D. Wanders, M. Orgeron, C. C. Cortez and T. W. Gettys, Diabetes, 2014, 63, 3721–3733 CrossRef CAS.
- S. Judex, Y. K. Luu, E. Ozcivici, B. Adler, S. Lublinsky and C. T. Rubin, Methods, 2010, 50, 14–19 CrossRef CAS PubMed.
- P. R. D. Oliveira, C. A. D. Costa, G. F. D. Bem, V. S. Cordeiro, I. B. Santos, L. C. D. Carvalho, E. P. D. Conceicao, P. C. Lisboa, D. T. Ognibene, P. J. Sousa, G. R. Martins, A. J. D. Silva, R. S. D. Moura and A. C. Resende, PLoS One, 2015, 10, e0143721 CrossRef PubMed.
- I. Torre-Villalvazo, A. R. Tovar, V. E. Ramos-Barragan, M. A. Cerbon-Cervantes and N. Torres, J. Nutr., 2008, 138, 462–468 CrossRef CAS PubMed.
- I. Bergheim, L. P. Guo, M. A. Davis, J. C. Lambert, J. I. Beier, I. Duveau, J. P. Luyendyk, R. A. Roth and G. E. Arteel, Gastroenterology, 2006, 130, 2099–2112 CrossRef CAS PubMed.
- I. Bergheim, S. Weber, M. Vos, S. Kramer, V. Volynets, S. Kaserouni, C. J. McClain and S. C. Bischoff, J. Hepatol., 2008, 48, 983–992 CrossRef CAS.
- X. Y. Zhu, H. H. Lei, J. F. Wu, J. V. Li, H. R. Tang and Y. L. Wang, J. Proteome Res., 2014, 13, 4436–4445 CrossRef CAS PubMed.
- D. Li, L. L. Zhang, F. C. Dong, Y. Liu, N. Li, H. H. Li, H. H. Lei, F. H. Hao, Y. L. Wang, Y. Zhu and H. R. Tang, J. Proteome Res., 2015, 14, 2237–2254 CrossRef CAS PubMed.
- R. K. Rai, P. Tripathi and N. Sinha, Anal. Chem., 2009, 81, 10232–10238 CrossRef CAS PubMed.
- V. Ruiz-Rodado, E. R. Nicoli, F. Probert, D. A. Smith, L. Morris, C. A. Wassif, F. M. Platt and M. Grootveld, J. Proteome Res., 2016, 15, 3511–3527 CrossRef CAS PubMed.
- Y. P. An, W. X. Xu, H. H. Li, H. H. Lei, L. M. Zhang, F. H. Hao, Y. X. Duan, X. Yan, Y. Zhao, J. F. Wu, Y. L. Wang and H. R. Tang, J. Proteome Res., 2013, 12, 3755–3768 CrossRef CAS.
- O. Cloarec, M. E. Dumas, A. Craig, R. H. Barton, J. Trygg, J. Hudson, C. Blancher, D. Gauguier, J. C. Lindon, E. Holmes and J. Nicholson, Anal. Chem., 2005, 77, 1282–1289 CrossRef CAS PubMed.
- H. Y. Liu, F. Tayyari, C. Khoo and L. W. Gu, J. Funct. Foods, 2015, 14, 76–86 CrossRef CAS.
- H. Y. Liu, T. J. Garrett, F. Tayyari and L. W. Gu, Mol. Nutr. Food Res., 2015, 59, 2107–2118 CrossRef CAS PubMed.
- H. Y. Liu, F. Tayyari, A. S. Edison, Z. H. Su and L. W. Gu, J. Nutr. Biochem., 2016, 34, 136–145 CrossRef CAS PubMed.
- Y. H. Yang, H. Zhang, B. Yan, T. Y. Zhang, Y. Gao, Y. H. Shi and G. W. Le, J. Agric. Food Chem., 2017, 65, 6957–6971 CrossRef CAS PubMed.
- H. Kobayashi, E. Gil-Guzman, A. M. Mahran, R. K. Sharma, D. R. Nelson, A. J. Thomas and A. Agarwal, J. Androl., 2001, 22, 568–574 CAS.
- M. Fu, W. H. Zhang, L. Y. Wu, G. D. Yang, H. Z. Li and R. Wang, Proc. Natl. Acad. Sci. U. S. A., 2012, 109, 2943–2948 CrossRef CAS PubMed.
- N. Kruse, M. Pette, K. Toyka and P. Rieckmann, J. Immunol. Methods, 1997, 210, 195–203 CrossRef CAS.
- V. L. Malloy, C. E. Perrone, D. A. L. Mattocks, G. P. Ables, N. S. Caliendo, D. S. Orentreich and N. Orentreich, Metab., Clin. Exp., 2013, 62, 1651–1661 CrossRef CAS PubMed.
- G. P. Ables, C. E. Perrone, D. Orentreich and N. Orentreich, PLoS One, 2012, 7, e51357 CrossRef CAS PubMed.
- M. Pithukpakorn, Mol. Genet. Metab., 2005, 85, 243–246 CrossRef CAS PubMed.
- J. T. Brosnan, J. Nutr., 2003, 133, 2068S–2072S CrossRef CAS PubMed.
- M. Gaggini, C. Rosso, F. Carli, V. Della Latta, D. Ciociaro, M. Marietti, E. Buzzigoli, M. L. Abate, R. Gambino, M. Cassader, A. Smedile, E. Bugianesi and A. Gastaldelli, Dig. Liver Dis., 2017, 49, E1–E1 CrossRef.
- L. C. Fontenelle, M. M. Feitosa, J. S. Severo, T. E. C. Freitas, J. B. S. Morais, F. L. Torres-Leal, G. S. Henriques and D. D. N. Marreiro, Horm. Metab. Res., 2016, 48, 787–794 CrossRef CAS.
- C. Hine and J. R. Mitchell, Exp. Gerontol., 2015, 68, 26–32 CrossRef CAS PubMed.
- S. Mani, H. Li, A. Untereiner, L. Wu, G. Yang, R. C. Austin, J. G. Dickhout, S. Lhotak, Q. H. Meng and R. Wang, Circulation, 2013, 127, 2523–2534 CrossRef CAS.
- S. Mani, W. Cao, L. Wu and R. Wang, Nitric Oxide-Biol. Ch., 2014, 41, 62–71 CrossRef CAS PubMed.
- M. Fu, W. Zhang, L. Wu, G. Yang, H. Li and R. Wang, Proc. Natl. Acad. Sci. U. S. A., 2012, 109, 2943–2948 CrossRef CAS PubMed.
- Y. Yang, Y. Ji, G. Y. Wu, K. J. Sun, Z. L. Dai and Z. L. Wu, Exp. Gerontol., 2015, 65, 35–41 CrossRef PubMed.
- J. B. Schutte, J. De Jong, W. Smink and M. Pack, Poult. Sci., 1997, 76, 321–325 CrossRef CAS PubMed.
- Z. Radak, H. Y. Chung, E. Koltai, A. W. Taylor and S. Goto, Ageing Res. Rev., 2008, 7, 34–42 CrossRef CAS PubMed.
- M. L. Urso and P. M. Clarkson, Toxicology, 2003, 189, 41–54 CrossRef CAS.
- A. Gomez, J. Gomez, M. L. Torres, A. Naudi, N. Mota-Martorell, R. Pamplona and G. Barja, J. Bioenerg. Biomembr., 2015, 47, 199–208 CrossRef CAS PubMed.
- C. H. Foyer and G. Noctor, Plant Physiol., 2011, 155, 2–18 CrossRef CAS.
- J. P. Liu, C. S. Wang, F. Liu, Y. R. Lu and J. Q. Cheng, Anal. Bioanal. Chem., 2015, 407, 2569–2579 CrossRef CAS.
- W. Doehner and U. Landmesser, Semin. Nephrol., 2011, 31, 433–440 CrossRef CAS PubMed.
- Y. H. Yang, B. Yan, X. R. Cheng, Y. Y. Ding, X. Tian, Y. H. Shi and G. W. Le, RSC Adv., 2017, 7, 28591–28605 RSC.
- B. J. Bennett, T. Q. D. Vallim, Z. N. Wang, D. M. Shih, Y. H. Meng, J. Gregory, H. Allayee, R. Lee, M. Graham, R. Crooke, P. A. Edwards, S. L. Hazen and A. J. Lusis, Cell Metab., 2013, 17, 49–60 CrossRef CAS PubMed.
- Y. L. Ke, D. Li, M. M. Zhao, C. J. Liu, J. Liu, A. P. Zeng, X. Y. Shi, S. Cheng, B. Pan, L. M. Zheng and H. S. Hong, Free Radical Biol. Med., 2018, 116, 88–100 CrossRef CAS.
- X. L. Sun, X. F. Jiao, Y. R. Ma, Y. Liu, L. Zhang, Y. Z. He and Y. H. Chen, Biochem. Biophys. Res. Commun., 2016, 481, 63–70 CrossRef CAS PubMed.
- Z. Z. Xie, Y. Liu and J. S. Bian, Oxid. Med. Cell. Longevity, 2016, 2016, 6043038 Search PubMed.
- D. Lloyd, Trends Microbiol., 2006, 14, 456–462 CrossRef CAS PubMed.
Footnotes |
| † Electronic supplementary information (ESI) available. See DOI: 10.1039/c8fo01629a |
| ‡ These authors contributed equally to this work and should be regarded as co-first authors. |
| This journal is © The Royal Society of Chemistry 2019 |

