
Consumption of sheep milk compared to cow milk can affect trabecular bone ultrastructure in a rat model†
Keegan
Burrow
 *a,
Wayne
Young
bcd,
Alan
Carne
e,
Michelle
McConnell
f,
Niels
Hammer
ghi,
Mario
Scholze
gj and
Alaa El-Din
Bekhit
*a
*a,
Wayne
Young
bcd,
Alan
Carne
e,
Michelle
McConnell
f,
Niels
Hammer
ghi,
Mario
Scholze
gj and
Alaa El-Din
Bekhit
*a
aDepartment of Food Science, University of Otago, PO Box 56, Dunedin 9054, New Zealand. E-mail: keegan.burrow@postgrad.otago.ac.nz; aladin.bekhit@otago.ac.nz
bAgResearch Ltd, Grasslands Research Centre, Private Bag 11008, Manawatu Mail Centre, Palmerston North 4442, New Zealand
cRiddet Institute, Massey University, Private Bag 11 222, Palmerston North 4442, New Zealand
dHigh-Value Nutrition National Science Challenge, University of Auckland, 85 Park Rd, Grafton, Auckland, New Zealand
eDepartment of Biochemistry, University of Otago, PO Box 56, Dunedin 9054, New Zealand
fDepartment of Microbiology and Immunology, University of Otago, PO Box 56, Dunedin 9054, New Zealand
gDepartment of Anatomy, University of Otago, PO Box 56, Dunedin 9054, New Zealand
hDepartment of Orthopedic and Trauma Surgery, University of Leipzig, Liebigstraße 20 04103, Leipzig, Germany
iFraunhofer IWU, Nöthnitzer Straße, 44 01187 Dresden, Germany
jInstitute of Materials Science and Engineering, Chemnitz University of Technology, Straße der Nationen, 62 09111 Chemnitz, Germany
First published on 29th November 2018
Abstract
Cow milk has a positive effect on bone health due to the effects of its protein, fat, lipid, vitamin, and mineral components. Sheep milk contains a unique composition of all of these components. However, to the best of our knowledge the benefits of sheep milk in relation to bone development have not been studied. The aim of the present study was to determine the effects of the consumption of sheep milk in comparison to cow milk on the structural and physical characteristics of growing bone in a rat model. Newly weaned male rats were fed either cow milk, sheep milk or sheep milk diluted to the same total solids content as cow milk for 28 days in addition to a basal chow. At the end of the feeding period animals were euthanized, the femora harvested and stored. The femora were analysed by μ-CT, mechanical bending tests, and ICP-MS. Rats consuming sheep milk in the trial were found to have significantly higher trabecular bone surface density and trabecular bone surface to volume ratio (p < 0.05) when compared to the rats consuming cow milk. No significant differences were observed in the mechanical properties and the mineral composition of the bones (p > 0.05). With the exception of Rb, which was found to be present in higher concentrations in rats consuming sheep milk (p < 0.05). Our results indicate that consumption of sheep milk may positively influence the structural integrity of bone, which may result in an enhancement of bone health.
Introduction
Bones are considered important organs due to the wide range of functions they carry out. This includes locomotion and providing mechanical strength while at the same time, organ protection, blood cell formation, and mineral storage.1 Like most other organs, bone is dynamically regulated and it is in a constant state of growth and remodelling.1 Although bone health is important at all ages, the most critical stages of bone development are in childhood and adolescence in humans up to the age of 25.2 In the long term, inadequate bone growth and development also increases the risk of bone-specific pathologies such as osteopenia and osteoporosis, with implications related to bone strength and increased risk of fracture, potentially causing higher morbidity and mortality.2–4There is a critical link between nutrition and bone development. Calcium (Ca), protein, vitamin D, and dietary fibre intake have all been associated with an improvement in bone structure and mechanical properties.1,2 Cow milk (CM) is seen as having a positive effect on bone health due to the direct effects of the protein, fat, lipid, vitamin, and mineral fractions.5,6 It has also been proposed that CM has the ability to improve bone health through a number of secondary pathways such as the augmentation of Ca absorption, and hydroxyapatite deposition.6
With respect to the interactions between milk-based nutrition and bone health, there has been a large focus in the literature on CM. Research on the effects of milk from other milk-producing species such as goat has been reported by Mora-Gutierrez et al.,7 Mora-Gutierrez et al.,8 Kruger et al.,9 McKinnon,10 and Xu et al.11 With the exception of goat milk, limited investigations have been carried out on the milk from other small ruminants, such as sheep, and their effect on bone health.12
SM contains higher levels of key macro-nutritional fractions, including protein, lipid, and total solids, when compared with CM.12 With respect to protein composition, SM typically contains one quarter to one third more protein than CM (containing 3.2 to 4.0 and 6.1 to 12.6 per cent protein (wet weight), for CM and SM, respectively).1 SM also contains a higher concentration of lipids with 6.1 to 12.6% fat (wet weight) compared to the 3.4 to 5.5% (wet weight) found in CM.1 In addition, SM contains higher concentrations of both essential and trace minerals compared to CM. This includes higher concentrations of Ca, phosphorous (P), magnesium (Mg), zinc (Zn), manganese (Mn), copper (Cu), and sodium (Na).13 Given these differences in the composition of CM and SM, the consumption of SM may have a greater benefit to bone health than the consumption of CM, which is to date undetermined to our best knowledge.
The aim of the present study was to determine the effects of the consumption of SM in comparison to CM on the structural and physical characteristics of bone in a growing rat model system.
Experimental
Animals
All methods were approved by the AgResearch Grasslands Ethics Committee (Palmerston North, New Zealand) (application number 13806, 10/3/2016).Newly-weaned male Sprague Dawley rats (aged between three and four weeks) were used in the trial (sourced from AgResearch, Ruakura Research Centre, Hamilton, New Zealand). The rats were individually housed in wire-lidded polycarbonate cages, with environmental enrichment and nest-building materials. During the experimental period, animals were exposed to 22 °C ambient temperature, with 12 h light and dark cycle. The mean rat weight at the start of the trial was 99.72 ± 12.03 g.
Rats were fed ad libitum for 28 days a modified diet based on AIN-93 M purchased from Research Diets (New Brunswick, New Jersey, USA), but with the replacement of casein with beef protein.14 The rats were allocated to groups of 12 such that the rats in each group had a similar mean weight and standard deviation. The number of animals selected for this trial was based on the work of Liu et al.14 and Frommelt et al.15 The experiment was designed by a biometrician as this was a requirement for animal use ethical approval.
During the feeding period each group of animals (n = 12) was provided ad libitum with one of three types of milk; undiluted raw CM, undiluted raw sheep milk (SM), diluted raw SM with the same concentration of milk solids as raw (DM) in place of drinking water. The milk was provided in liquid form (defrosted from frozen), twice per day. One aliquot was provided in the morning and the second in the late afternoon/early evening. The quantity of milk consumed was recorded.
On day 28 of the trial, all rats were euthanized by CO2 asphyxiation and cervical dislocation. The left femora of each rat was harvested, stripped of flesh, and stored in 10% neutral buffered formalin (NBF) (Labserv, Auckland, New Zealand), at 4 °C in a dark environment. The macro-dimensions of the femora were measured using electronic callipers.
Micro-computed tomography analysis of rat femora microstructure
The micro-computed tomography (μ-CT) scanning and analysis methods used were adapted from McKinnon10 and Bouxsein et al.16 The rat femora were removed from the formalin before being placed in a custom 3D-printed jig. This allowed for the scanning of 6 bones simultaneously by affixing bones in two rows of three. The bones were then scanned using a Skyscan 1172 (Bruker-Micro CT, Kontich, Belgium). The bone samples were scanned from their distal end to at least the mid-point of the shaft. The source voltage, current, aluminium filter size and image pixel size were 40 kV, 250 μA, 0.5 mm and 17.45 μm, respectively. After scanning, the samples were returned to the NBF.The image slices were reconstructed using NRecon software (Version 1.6.10.2) (Bruker-MicroCT, Kontich, Belgium). Images were subsequently binarised and analysed using CTAn software (Version 1.14.4.1). The regions for analysis were isolated by interpolation of operator-drawn regions. For the cortical bone, 101 image slices of the reconstructed data set were assessed starting with 476 image slices from the distal growth plate. For the trabecular bone, 201 image slices were assessed starting 30 image slices from the distal growth plate. Parameters determined for both the cortical and trabecular bone are described in ESI Table S1.†
Three-point bend analysis of rat femora mechanical properties
Following the μ-CT analysis, bones were taken for mechanical testing using a method adapted from Leppänen et al.17 and McKinnon et al.18 Bone samples were tested using a ZwickRoell Z020 (Zwick & Roell Group, Ulm, Germany) equipped with a 2.5 kN load cell (Xforce P, Zwick & Roell Group, Ulm, Germany). A fixed span of 12 mm and a constant depression rate of 10 mm min−1 was used for the testing. The midpoint of the bone shaft was determined visually and marked. Bones were placed in the jig in a constant orientation.Inductively coupled plasma mass spectrometry analysis of the bone mineral composition
The mineral composition of the femora was determined by inductively coupled plasma mass spectrometry (ICP-MS). The proximal half of the femora was taken and cleaned using a modified version of the procedure of Raffalt et al.,19 as follows. Each bone sample was soaked in a beaker of 30% (v/v) hydrogen peroxide (analytical reagent grade) for 1 h and then transferred into a beaker of 95% (v/v) ethanol (analytical reagent grade) for a further 30 min (with constant stirring). The bones were then transferred to a beaker of deionised water (18.2 MΩ cm at 23.1 °C) for a further 30 min with constant stirring. Bone samples were then crushed and powdered in a mortar using a porcelain pestle before being transferred into clean Falcon tubes. Powdered bone samples were then freeze-dried for a minimum of 24 h).Digestion of the freeze-dried powdered bone samples was performed in an ultraclean, metal-free Class 10 (ISO4) laboratory (Department of Chemistry, University of Otago, Dunedin, New Zealand). Samples (0.25 g) were transferred to clean Teflon digestion tubes (Mars X-Press, CEM Corporation, Matthews, North Carolina, USA). Nine ml of triple quartz distilled fuming nitric acid was then added. The mixture was left to sit for 15 min before 1 ml of 30% (v/v) hydrogen peroxide (analytical reagent grade) (Labserv, Auckland, New Zealand) was added. The digestion tubes were then sealed and digested in a MARS 6 microwave digestion unit (CEM Corporation, Matthews, North Carolina, USA). The microwave settings used were a ramp of 15 min and a hold of 15 min, with a temperature of 200 °C, a pressure of 800 psi, and a power setting of 900–1050 W. After allowing the samples to cool for a minimum of 2 h, the contents of the digestion tubes were transferred to acid resistant tubes. The volume from the pre-digestion was then made up to approximately 50 ml with deionised water (18.2 MΩ cm at 23.1 °C). This solution was then diluted 10× with 2% (v/v) triple quartz distilled nitric acid (in deionised water (18.2 MΩ cm at 23.1 °C), which was the fully digested sample that was subjected to ICP-MS analysis.
The analysis was carried out using an ICP-MS instrument (Agilent 7900, Agilent, Santa Clara, California, USA) in general purpose plasma mode and with a quartz 2.4 mm torch. The sample depth was set to 10 mm, with a gas flow rate of 1.05 L min−1 and a nebulizer flow rate of 0.1 rps. Internal standards of beryllium (Be), scandium (Sc), germanium (Ge), rhodium (Rh), indium (In), terbium (Tb) and bismuth (Bi) were added online. Detection limits are provided in ESI Table S2.†
Statistical analysis
Univariate statistical analysis was carried out using SPSS v24 (IBM Corporation, New York, USA). Multivariate statistical analysis was carried out using the VEGAN package for R (R Foundation for Statistical Computing, Vienna, Austria).20,21 For univariate analysis of normally distributed data, analysis of variance (ANOVA) was carried out, followed by Tukey's post hoc testing. For non-normally distributed data the Kruskal Wallis test and the Dunns test with Bonferroni correction was used. In addition, Spearman's correlation was used to determine relationships between variables. Permutation multivariate analysis of variance using distance matrices (MANOVA) was applied to the μ-CT based micro-structure data using the adonis function from the VEGAN package for R.20,21P values of 0.05 or less were considered as statistically significant.Results and discussion
The overall animal growth rates from this study have been previously reported in Burrow et al.22 No significant differences (p > 0.05) were observed in rat weights from the various treatments during the experimental period.The macro-nutrient composition of the diet components is reported in Table S3.† The basal diet provided the main source of nutrition for all the animals providing the majority of the protein and essential minerals to the rats’ diets. This was as expected as the AIN-93 M diet is formulated to be a nutritionally complete diet for the rats.
Significant differences in the intake of various nutritional components were observed between diets (Tables 1 and 2). Apart from carbohydrates, the rats fed on SM had a significantly higher intake of nutrients compared to CM (Table 1, p < 0.05). Likewise for minerals, the intake of SM fed rats was significantly higher in comparison to CM for 11 of the 18 minerals identified in Table 2 (Table 2, p < 0.05). The dietary intake of macronutrients for the DM fed rats was not different from the CM fed rats (Table 1, p > 0.05).
| Dietb | Fraction | |||
|---|---|---|---|---|
| Protein | Lipids | Carbohydrates | Lactose | |
| a The macro-composition of the AIN-93 M diet and milks are reported in Table S3.† b CM = cow milk, DM = sheep milk diluted to have the same concentration of milk solids as raw cow milk, and SM = undiluted sheep milk. Superscript letters indicate significant differences in intakes between the kinds of milk determined using ANOVA and Tukey's post hoc testing (p < 0.05). | ||||
| CM | 3.90 ± 0.25b | 2.26 ± 0.18b | 15.89 ± 1.08 | 1.19 ± 0.13b |
| DM | 4.00 ± 0.33ab | 2.24 ± 0.26b | 15.57 ± 1.35 | 1.08 ± 0.18b |
| SM | 4.26 ± 0.28a | 2.68 ± 0.35a | 14.85 ± 1.21 | 1.45 ± 0.28a |
| Element [μg day−1] | Dietc | ||
|---|---|---|---|
| CM | DM | SM | |
| a Data and method as reported in Burrow et al.22 b [mg day−1]. c CM = cow milk, DM = sheep milk diluted to have the same concentration of milk solids as raw cow milk, and SM = undiluted sheep milk. N/D indicates mineral present below the detection limit. Superscript letters indicate significant differences in intakes between the kinds of milk determined using ANOVA and Tukey's post hoc testing (p < 0.05). | |||
| Al | N/D | 7.78 ± 0.38 a | 10.0 ± 0.59 a |
| B | N/D | 4.77 ± 0.23 a | 5.06 ± 0.28 a |
| Ba | 3.25 ± 0.10 c | 10.0 ± 0.58 b | 20.0 ± 0.84 a |
| Cab | 33.7 ± 1.08 c | 46.1 ± 2.25 b | 55.8 ± 3.13 a |
| Cs | N/D | 1.34 ± 0.65 a | 1.63 ± 0.09 a |
| Cu | 0.48 ± 0.02 b | 1.85 ± 0.09 a | 2.11 ± 0.12 a |
| Fe | 7.18 ± 0.23 c | 9.90 ± 0.48 b | 10.0 ± 0.77 a |
| Kc | 42.4 ± 1.36 a | 31.8 ± 1.55 b | 37.8 ± 2.12 a |
| Li | 0.28 ± 0.01 a | N/D | 0.19 ± 0.01 a |
| Mgb | 3.30 ± 0.11 b | 3.98 ± 0.19 b | 4.76 ± 0.27 a |
| Mn | 0.85 ± 0.03 c | 1.35 ± 0.07 b | 1.71 ± 0.96 a |
| Mo | 1.13 ± 0.04 a | 0.60 ± 0.03 c | 0.68 ± 0.04 b |
| Nab | 11.0 ± 0.35 ab | 9.31 ± 0.45 b | 11.0 ± 0.62 a |
| Pb | 26.1 ± 0.84 c | 37.3 ± 1.82 b | 45.1 ± 2.53 a |
| Pb | N/D | 0.04 ± 0.002 b | 0.62 ± 0.04 a |
| Rb | 50.0 ± 1.69 c | 160 ± 7.84 b | 190 ± 1.00 a |
| Se | 0.34 ± 0.01 c | 0.76 ± 0.04 b | 0.95 ± 0.05 a |
| Sr | 10.0 ± 0.04 c | 30.0 ± 1.43 b | 40.0 ± 2.01 a |
| Zn | 100 ± 3.15 c | 160 ± 87.61 b | 190 ± 10.0 a |
Bone macrostructure
As reported in Table 3, no significant differences were found in the diameter (mm) and total length (mm) of the rat femora due to milk type consumed (p > 0.05).μ-CT based analyses of rat femora microstructure
Significant differences were observed in a number of the trabecular bone parameters assessed by μ-CT in the femora.These parameters are trabecular bone surface-to-volume ratio (the ratio between the surface of the area identified as bone and the total volume of that area) (BS/BV, mm2/mm3) (Fig. 1), trabecular bone surface density (the ratio between the region identified as bone to the total volume of the region assessed) (BS/TV, mm2/mm3) (Fig. 2), and trabecular thickness (the mean thickness of trabeculae) (Tb·Th, mm) (Fig. 3). Other trabecular parameters can be observed in ESI Table S4.†
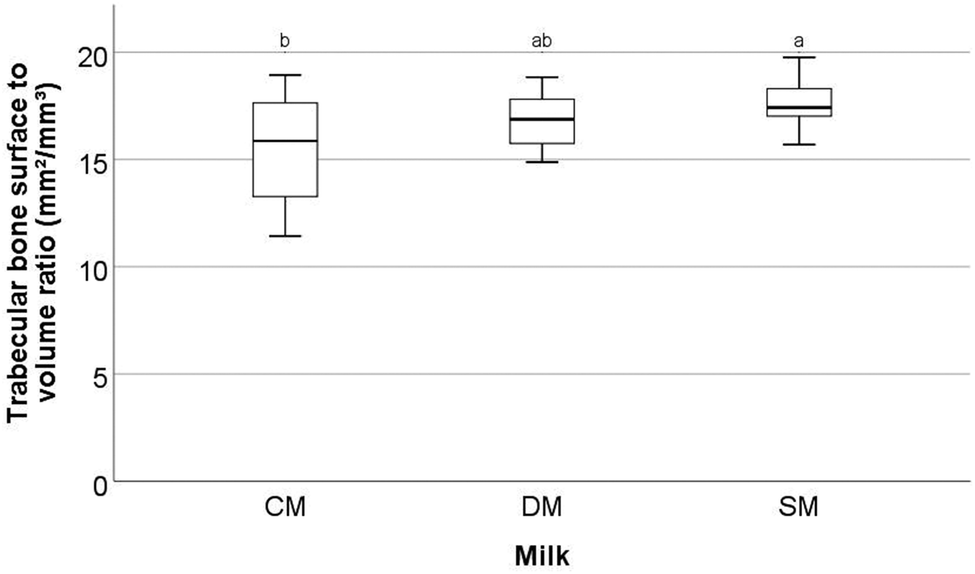 | ||
| Fig. 1 Trabecular bone surface to volume ratio (mm2/mm3) of the femora of rats fed different milk diets. Determined by μ-CT scanning and analysis. CM = cow milk, DM = sheep milk diluted to have the same concentration of milk solids as raw cow milk, and SM = undiluted sheep milk. Superscript letters indicate significant differences in bone parameters between the kinds of milk determined using ANOVA and Tukey's post hoc testing (p = 0.02). | ||
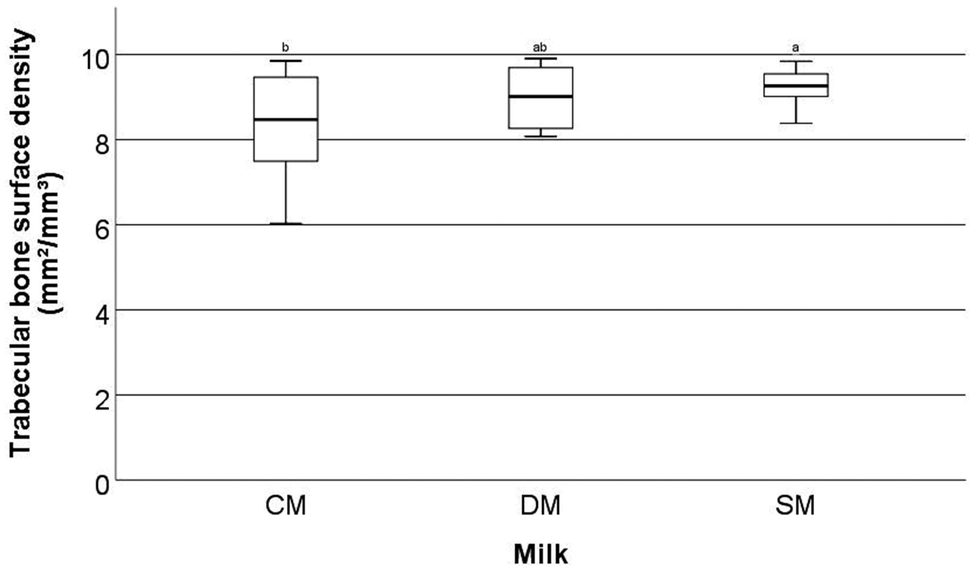 | ||
| Fig. 2 Trabecular bone surface density (mm2/mm3) of the femora of rats fed different milk diets. Determined by μ-CT scanning and analysis. CM = cow milk, DM = sheep milk diluted to have the same concentration of milk solids as raw cow milk, and SM = undiluted sheep milk. Superscript letters indicate significant differences in bone parameters between milks determined using ANOVA and Tukey's post hoc testing (p = 0.037). | ||
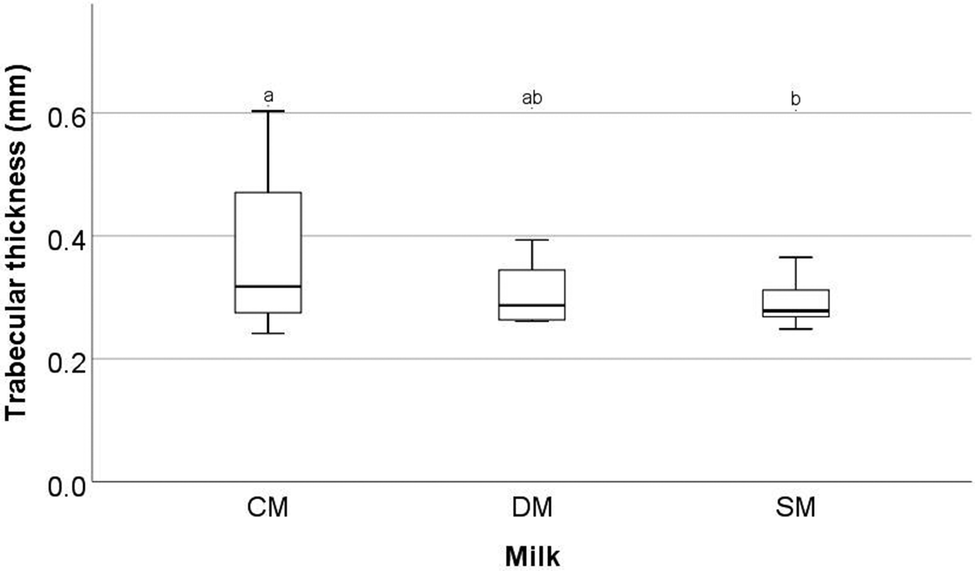 | ||
| Fig. 3 Trabecular thickness (mm) of the femora of rats fed different milk diets. Determined by μ-CT scanning and analysis. CM = cow milk, DM = sheep milk diluted to have the same concentration of milk solids as raw cow milk, and SM = undiluted sheep milk. Superscript letters indicate significant differences in bone parameters between milks determined using ANOVA and Tukey's post hoc testing (p = 0.041). | ||
With respect to trabecular BS/BV (Fig. 1) it was found that the animals fed SM had significantly higher values than animals fed CM (p = 0.02) with mean values of 15.51 ± 2.52, 16.82 ± 1.26 and 17.60 ± 1.11 mm2/mm3 for CM, DM, and SM, respectively. For trabecular BS/TV (Fig. 2), a significant difference between SM and CM fed animals was observed (p = 0.037) with mean values of 8.32 ± 1.23, 8.99 ± 0.70, and 9.23 ± 0.44 mm2/mm3 for CM, DM, and SM, respectively. In contrast, for Tb·Th (Fig. 3) CM-fed animals showed a significantly higher value than SM-fed animals (p = 0.041) with mean values of 0.08 ± 0.002, 0.085 ± 0.02, 0.08 ± 0.04 mm for CM, DM, and SM, respectively. For trabecular BS/BV, trabecular BS/TV, and Tb·Th it was found that the amounts measured from DM-fed animals were not significantly different from either the CM-fed or SM-fed animals (p > 0.05).
No significant differences in individual cortical bone characteristics among treatments were observed (ESI Table S5†).
No correlations were observed between mineral intake and bone structure. However, MANOVA identified that a significant difference between CM and SM is present in the bone microstructure (p = 0.01) but no difference was present between CM and DM or DM and SM (p > 0.05).
The increase observed in the trabecular BS/BV and trabecular BS/TV due to the consumption of SM in the present study can be interpreted as an indication that SM has a positive effect on the structure of the trabecular bone.16 It has been previously shown that trabecular bone is more sensitive to the effects of diet and supplementation than cortical bone.23 It is believed that the trabecular bone responds to the effects of diet due to the higher rate of turnover.24 Experimental work on animals is also consistent with this theory. Dirkes et al.25 investigated the effect of soy and milk protein isolates using Otsuka Long Evans Tokushima Fatty rats fed isocaloric diets for 16 weeks from four weeks of age. The diets contained milk protein isolate (CM based), soy protein isolate, or a 50/50 combination of the proteins. No significant differences were observed in the cortical bone parameters (when assessed by μ-CT) (p > 0.05) between any of the diets. However, a reduction in trabecular number (Tb·N) and an increase in trabecular separation (Tb·S) was observed when the animals were fed the soy protein isolate diet.
Calcium intake has been widely associated with positive effects on bone health.2 However, the positive effects of SM on the trabecular BS/TV and trabecular BS/BV observed in the present study (Fig. 1 and 2) are most likely not due to the increased level of Ca consumed by the SM-fed rats (Table 2). It has been shown that excess Ca intake alone does not innately improve bone mechanical and structural properties in the short term. Agata et al.26 identified that an increase in Ca intake beyond 0.6% of the total diet did not significantly affect the mechanical and structural properties of bone in ovariectomized 8-week old female Wistar rats after 8 weeks of feeding. In this current study, all animals received a Ca intake in excess of 0.6% (of total diet).22
Even though a significant difference was observed in the trabecular bone structure due to the consumption of different milk types, we are unable at this stage to specify the mechanism behind these differences. There are two milk fractions (lipid and protein fractions) that are most likely to drive the differences observed in the present study. It is well established that dietary protein and peptides are able to interact with aspects of bone metabolism including the development of trabecular architecture.27 Reddi et al.27 identified four buffalo milk casein-derived peptides, prepared from pepsin and trypsin digests of buffalo milk casein that increased proliferation of calvarial osteoblast cells (p < 0.05). Further work by Mada et al.28 has also been carried out on one of the buffalo peptides identified (sequence VLPVPQK). The peptide was tested for its effects on bone development in a male rat model. The peptide when administered at either 50 μg kg−1 or at 100 μg kg−1 resulted in an increase in trabecular bone mineral density (BMD), Tb·Th, and trabecular number (Tb·N). In the present study, an increase in trabecular BS/TV and trabecular BS/BV in rats fed SM compared to CM (Fig. 1 and 2) is evident. The unique protein composition of SM could play a part in the enhancement of trabecular architecture that was found.
Zou et al.29 identified that on average SM contains significantly higher levels of polyunsaturated fatty acids (PUFAs), particularly omega-3(ω-3) PUFAs when compared to CM (with concentrations of 1.20 mol% and 0.52 mol% in SM and CM, respectively). The role of ω-3 PUFAs are important in the context of this study, as it has been shown that ω-3 PUFA has a positive effect on bone development in both in vitro and in vivo testing.30 A cohort study by Högström et al.31 was conducted on 95 healthy adolescent white males in Umeå in northern Sweden that found a positive correlation between ω-3 PUFA concentration in the blood and total BMD (r = 0.27, p = 0.02) in males 22 years of age. These data are consistent with the wider literature. Watkins et al.32 reviewed both in vitro and in vivo testing methods with a focus on human and animal studies. From this review, it was concluded that a lower ω-6 to ω-3 PUFA ratio (effectively an increase in ω-3 PUFA intake) is beneficial to bone health.
The increased concentration of ω-3 PUFAs (due to higher total fat content) and the ratio of ω-6 to ω-3 PUFAs might be an aspect driving the improvement observed in trabecular BS/TV and trabecular BS/BV due to the consumption of SM (Fig. 1 and 2). Based on this information it is possible that the differences in the trabecular bone structure observed in the present study may be driven by the differences in lipid composition between CM and SM.
It has been noted that the CM fed rats showed a higher variability in the bone microstructure compared to the SM and DM fed rats. It is believed this may be related to the digestibility of SM. It is well established that different types of milk have different levels of digestibility. Vithana et al.33 identified that casein protein fractions from deer milk are more digestible in comparison to protein from cow milk when tested using an in vitro human stomach model system. Similar characteristics have been identified in sheep milk.34,35
Three-point bend analysis of rat femora mechanical properties
Mechanical parameters assessed by three-point bend analysis of the rat femora are reported in Fig. 4–6. This includes strain at maximum force (ε at Fmax, %), maximum tensile stress (σmax, N mm−2), and elastic modulus (EMod, GPa). No significant differences were observed in the above characteristics between the different milk groups (p > 0.05).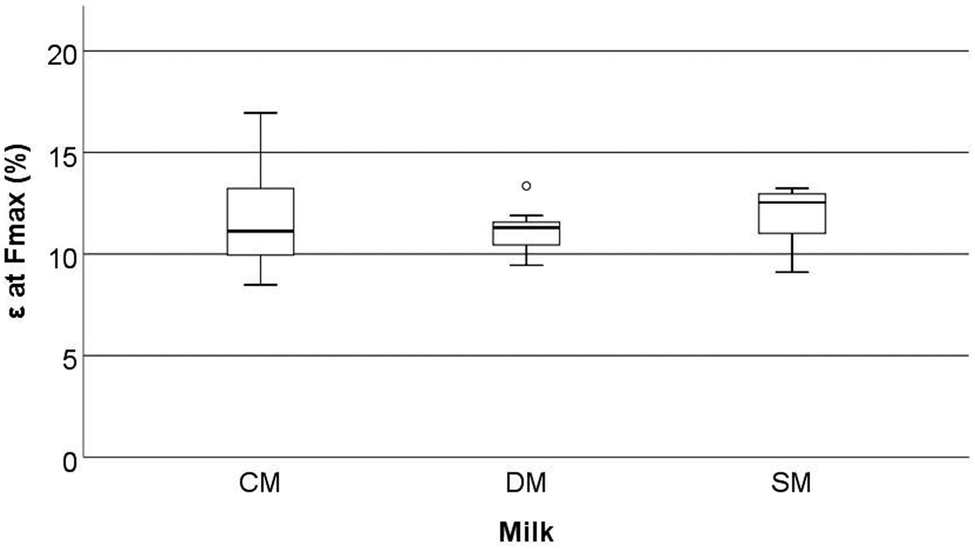 | ||
| Fig. 4 Strain at maximum force (ε at Fmax, %) of the femora of rats fed different milk diets when tested using a three-point bend test (2.5 kN load cell, a fixed span of 12 mm and a constant depression rate of 10 mm min−1). CM = cow milk, DM = sheep milk diluted to have the same concentration of milk solids as raw cow milk, and SM = undiluted sheep milk. | ||
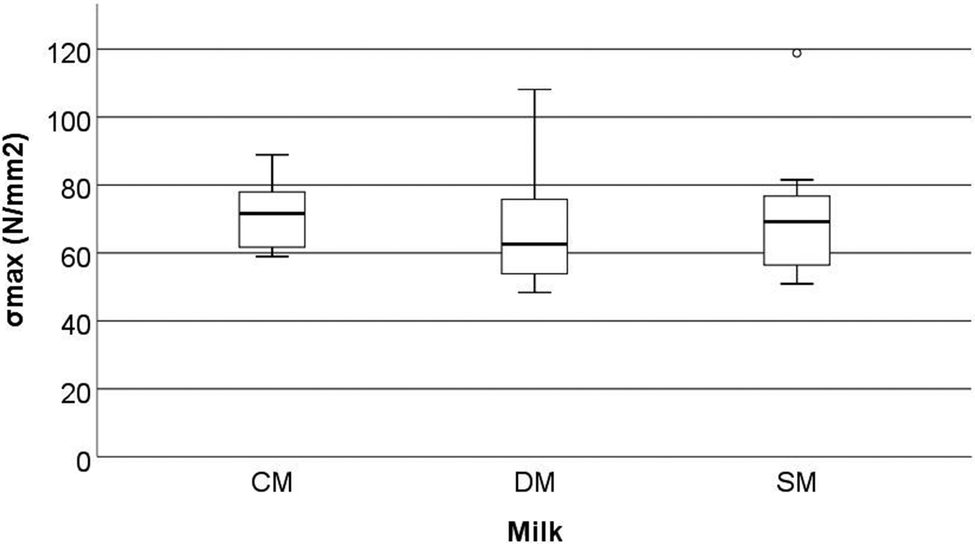 | ||
| Fig. 5 Maximum tensile stress (σmax, N mm−2) of the femora of rats fed different milk diets when tested using a three-point bend test (2.5 kN load cell, a fixed span of 12 mm and a constant depression rate of 10 mm min−1). CM = cow milk, DM = sheep milk diluted to have the same concentration of milk solids as raw cow milk, and SM = undiluted sheep milk. | ||
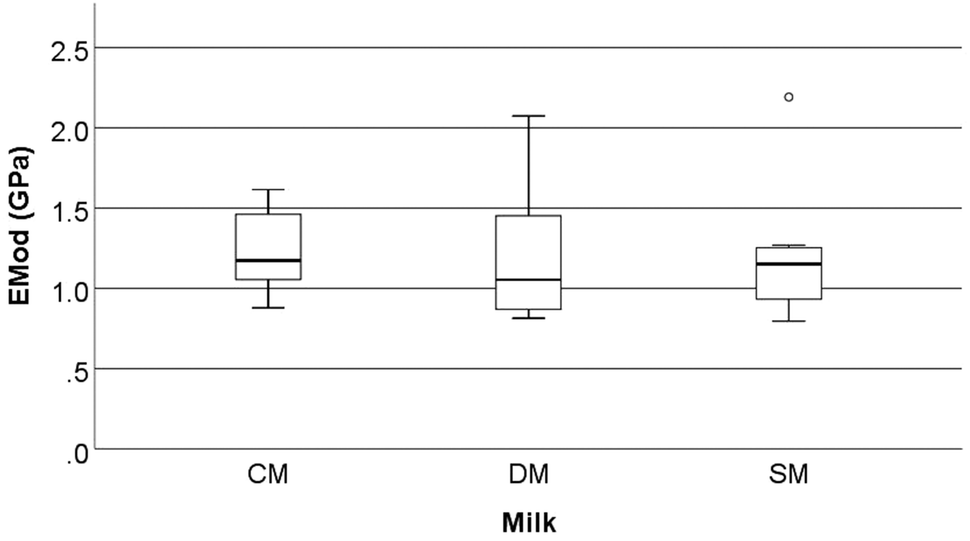 | ||
| Fig. 6 Elastic modulus (EMod, GPa) of the femora of rats fed different milk diets when tested using a three-point bend test (2.5 kN load cell, a fixed span of 12 mm and a constant depression rate of 10 mm min−1). CM = cow milk, DM = sheep milk diluted to have the same concentration of milk solids as raw cow milk, and SM = undiluted sheep milk. | ||
Although the bone mechanical properties of ε at Fmax, σmax, and EMod were not significantly altered in the present study, it should be noted that these rats were only fed the milks over a short period of time compared to other studies. Studies on both goat milk and CM have shown the potential to alter the development of the microstructure of bone even when mechanical properties are not affected.1,36 McKinnon et al.18 investigated the effects of the consumption of a goat milk based formula using 3-week old male Sprague Dawley rats, which were fed for 9 weeks. They showed that the whey to casein ratio and milk fat ratio both affected the absorption of Ca (as determined by a metabolic study) and BMD (that was measured by dual-energy X-ray absorptiometry). However, these effects were not translated into bone macrostructure, or mechanical differences (when assessed using a three-point bend test). Likewise, Fried et al.37 showed that the cortical bone volume to total volume ratio (BV/TV) (measured by μ-CT) increased when animals were fed skim milk powder (at 2.4% of the final diet) without changes in the mechanical proprieties of bone (measured by three-point bend testing). Fried et al.37 conducted testing using 12-week old male Sprague-Dawley rats with induced obesity that were fed for 8 weeks on diets containing different ratios of CM based, casein, whey or skim milk powder. The results from McKinnon10 and Fried et al.37 are similar in nature to those observed in the present study. Our study found significant differences in the trabecular microstructure (the increase in trabecular BS/TV, trabecular BS/BV, and a decrease in Tb·Th) of the femora but this was not translated into mechanical differences (measured as Fmax, σmax, and EMod) (Fig. 1–6).
ICP-MS analysis of the bone mineral composition
No significant differences in the bone mineral composition between treatments were observed when assessed by the Kruskal Wallis test and the Dunns test with Bonferroni correction, except for Rb (Table 4, p > 0.05). The concentration of Rb was found to be significantly higher in rats fed either SM or DM compared to the CM feed animal group (p ≤ 0.001).| Mineral | Dietb | ||
|---|---|---|---|
| CM | DM | SM | |
| a g kg−1. b CM = cow milk, DM = sheep milk diluted to have the same concentration of milk solids as raw cow milk, and SM = undiluted sheep milk. Superscript letters indicated significant differences in mineral concentrations between treatments (calculated using the Kruskal Wallis test and the Dunns test with Bonferroni correction (p < 0.05)). | |||
| Al | 39.1 ± 2.53 | 38.3 ± 3.47 | 37.2 ± 3.00 |
| Ba | 7.57 ± 1.35 | 8.44 ± 1.48 | 8.62 ± 0.98 |
| Caa | 218 ± 7.51 | 213 ± 7.21 | 216 ± 7.08 |
| Cu | 1.06 ± 0.15 | 1.08 ± 0.14 | 1.15 ± 0.28 |
| Fe | 55.9 ± 15.5 | 54.5 ± 12.7 | 47.8 ± 9.08 |
| K | 326 ± 31.5 | 337 ± 34.9 | 344 ± 34.9 |
| Mga | 3.61 ± 0.20 | 3.66 ± 0.16 | 3.68 ± 0.14 |
| Mn | 1.08 ± 0.34 | 1.18 ± 0.42 | 0.9 ± 0.32 |
| Mo | 0.11 ± 0.01 | 0.10 ± 0.008 | 0.11 ± 0.01 |
| Naa | 7.62 ± 0.29 | 7.88 ± 0.30 | 7.79 ± 0.50 |
| Ni | 2.82 ± 1.34 | 2.90 ± 2.61 | 1.92 ± 1.80 |
| Pa | 116 ± 3.58 | 116 ± 2.52 | 114 ± 4.12 |
| Pb | 0.61 ± 0.97 | 0.24 ± 0.11 | 0.25 ± 0.13 |
| Rb | 0.25b ± 0.02 | 0.76a ± 0.12 | 0.91a ± 0.17 |
| Sb | 0.20 ± 0.004 | 0.21 ± 0.02 | 0.21 ± 0.005 |
| Se | 0.05 ± 0.007 | 0.04 ± 0.002 | 0.05 ± 0.008 |
| Sr | 61.6 ± 5.44 | 64.4 ± 5.24 | 66.5 ± 5.53 |
| Zn | 197 ± 13.9 | 120 ± 8.57 | 207 ± 12.9 |
With respect to the mineral composition of the bones, the data presented here are consistent with the mineral analysis of soft tissues previously carried out in conjunction with this animal trial and reported in Burrow et al.22
The only significant difference in mineral composition observed in the present study was a significant increase in the Rb content of the bones in the SM fed and DM fed animals when compared with the CM fed animals. As discussed above, it has been shown that an increase in the intake of dietary minerals beyond the recommended intake does not necessarily influence the composition of bone.26,38
When non-dietary minerals are considered, it should be noted that limited information is available for the biological pathways for non-dietary minerals, including the absorption and distribution pathways.39,40 What is understood is that non-dietary minerals that form monovalent cations, such as Rb or Cs, have a tendency to accumulate in soft tissues that have a requirement for monovalent cations (including K and Na).39 When the limited information available is considered, the significant increase in Rb content of the bones in the SM fed and DM fed animals is consistent with published data.39,40 The elevated levels of these minerals present in bone is linked to the respective milk compositions. As no significant differences were observed in the animal growth rates or overall animal health it can be concluded in the context of this trial that no negative effects occurred due to the increased Rb levels in the diet.
Conclusions
Although CM and CM fractions have been shown to exert positive effects on the development of bone in cellular models, animal models and human trials, the extent of the effect has not been fully elucidated. The results reported here in the current study indicate that SM may enhance bone development more than CM.An improvement in the trabecular microstructure of rat femora bones was observed in rats consuming SM compared to rats consuming CM. This was indicated by significant increases in trabecular BS/BV and BS/TV. It is most likely that these improvements are due to the function of the lipid and/or protein components of SM, however, further work to identify the specific mechanism and/or milk fraction(s) is required.
The differences in trabecular microstructure did not result in an improvement in the bone mechanical properties. However, an improvement in trabecular microstructure in healthy animals does not always correspond to an improvement in bone mechanical properties in the short-term but may result in long-term benefits for bone health.
In an analogous manner to the mechanical properties, no significant differences in the mineral concentration in the bones were identified between treatments, except for the non-dietary element Rb. A significantly higher concentration of Rb was present in the femora of both the SM and the DM fed rats when compared to those fed CM. As the rats in this study were otherwise healthy, it can be concluded that the increased Rb concentration had no overall negative impact.
This study indicates that there may be a benefit for bone health from consumption of sheep milk. However, further work is required to identify the long term effects of the consumption of sheep milk on bone health and secondly, to identify any mechanism(s) related to this benefit.
Conflicts of interest
There are no conflicts to declare.Acknowledgements
This work was supported by grants from the New Zealand Ministry of Business, Innovation, and Employment (C10X1305) and the Agricultural and Marketing Research and Development Trust (AIGPrReq-000220). The first author acknowledges receipt of a PhD scholarship from the University of Otago, New Zealand.Notes and references
- K. Burrow, W. Young, M. McConnell, A. Carne and A. E.-D. Bekhit, Do Dairy Minerals Have a Positive Effect on Bone Health?, Compr. Rev. Food Sci. Food Saf., 2018, 17, 989–1005 CrossRef.
- C. Weaver, C. Gordon, K. Janz, H. Kalkwarf, J. Lappe, R. Lewis, M. O'Karma, T. Wallace and B. Zemel, The National Osteoporosis Foundation's Position Statement on Peak Bone Mass Development and Lifestyle Factors: A Systematic Review and Implementation Recommendations, Osteoporosis Int., 2016, 27, 1281–1386 CrossRef CAS PubMed.
- J. P. Tortolani, E. F. McCarthy and P. D. Sponseller, Bone Mineral Density Deficiency in Children, J. Am. Acad. Orthop. Surg., 2002, 10, 57–66 CrossRef.
- G. Osterhoff, E. F. Morgan, S. J. Shefelbine, L. Karim, L. M. McNamara and P. Augat, Bone Mechanical Properties and Changes with Osteoporosis, Injury, 2016, 47, S11–S20 CrossRef.
- D. I. Givens, K. M. Livingstone, J. E. Pickering, Á. A. Fekete, A. Dougkas and P. C. Elwood, Milk: White Elixir or White Poison? An Examination of the Associations between Dairy Consumption and Disease in Human Subjects, Animal Front., 2014, 4, 8–15 CrossRef.
- K. D. Cashman, Milk Minerals (Including Trace Elements) and Bone Health, Int. Dairy J., 2006, 16, 1389–1398 CrossRef CAS.
- A. Mora-Gutierrez, H. M. Farrell, R. Attaie, V. J. McWhinney and C. Z. Wang, Influence of Bovine and Caprine Casein Phosphopeptides Differing in A S1-Casein Content in Determining the Absorption of Calcium from Bovine and Caprine Calcium-Fortified Milks in Rats, J. Dairy Res., 2007, 74, 356–366 CrossRef CAS.
- A. Mora-Gutierrez, H. M. Farrell Jr., R. Attaie, V. J. McWhinney and C. Wang, Effects of Bovine and Caprine Monterey Jack Cheeses Fortified with Milk Calcium on Bone Mineralization in Rats, Int. Dairy J., 2007, 17, 255–267 CrossRef CAS.
- M. C. Kruger, W. H. Chua, A. Darragh, C. L. Booth, C. Prosser and D. Lowry, Impact of Goat Milk Powdered Formulations on Mineral Absorption, Peak Bone Mass and Bone Loss Due to Ovariectomy in Rats, J. Sci. Food Agric., 2008, 88, 1082–1090 CrossRef CAS.
- H. McKinnon, PhD thesis, Massey University, 2012.
- M. Xu, Y. Wang, Z. Dai, Y. Zhang, Y. Li and J. Wang, Comparison of Growth and Nutritional Status in Infants Receiving Goat Milk-Based Formula and Cow Milk-Based Formula: A Randomized, Double-Blind Study, Food Nutr. Res., 2015, 59, 28613 CrossRef.
- M. A. De La Fuente, R. Mercedes, R. Isidra and J. Manuela, in Milk and Dairy Products in Human Nutrition: Production, Composition and Health, ed. Y. W. Park and G. F. W. Haenlein, Wiley & Sons Chichester, 2013, ch. 25, pp. 554–577 Search PubMed.
- J. Chia, K. Burrow, A. Carne, M. McConnell, L. Samuelsson, L. Day, W. Young and A. E.-D. Bekhit, in Nutrients in Milk and Their Implications on Health and Disease, ed. R. R. Watson, R. J. Collier and V. Preedy, Elsevier Publishing, London, 2017, ch. 27, pp. 345–363 Search PubMed.
- Z. Liu, N. C. Roy, Y. Guo, H. Jia, L. Ryan, L. Samuelsson, A. Thomas, J. Plowman, S. Clerens, L. Day and W. Young, Human Breast Milk and Infant Formulas Differentially Modify the Intestinal Microbiota in Human Infants and Host Physiology in Rats, J. Nutr., 2016, 146, 191–199 CrossRef CAS PubMed.
- L. Frommelt, M. Bielohuby, B. J. Stoehr, D. Menhofer, M. Bidlingmaier and E. Kienzle, Effects of Low-Carbohydrate, High-Fat Diets on Apparent Digestibility of Minerals and Trace Elements in Rats, Nutrition, 2014, 30, 869–875 CrossRef CAS PubMed.
- M. L. Bouxsein, S. K. Boyd, B. A. Christiansen, R. E. Guldberg, K. J. Jepsen and R. Müller, Guidelines for Assessment of Bone Microstructure in Rodents Using Micro–Computed Tomography, J. Bone Miner. Res., 2010, 25, 1468–1486 CrossRef.
- O. Leppänen, H. Sievänen, J. Jokihaara, I. Pajamäki and T. L. Järvinen, Three-Point Bending of Rat Femur in the Mediolateral Direction: Introduction and Validation of a Novel Biomechanical Testing Protocol, J. Bone Miner. Res., 2006, 21, 1231–1237 CrossRef PubMed.
- H. McKinnon, M. Kruger, C. Prosser and D. Lowry, The Effect of Formulated Goats’ Milk on Calcium Bioavailability in Male Growing Rats, J. Sci. Food Agric., 2010, 90, 112–116 CrossRef CAS.
- A. C. Raffalt, J. E. T. Andersen and S. Christgau, Application of Inductively Coupled Plasma–Mass Spectrometry (Icp–Ms) and Quality Assurance to Study the Incorporation of Strontium into Bone, Bone Marrow, and Teeth of Dogs after One Month of Treatment with Strontium Malonate, Anal. Bioanal. Chem., 2008, 391, 2199–2207 CrossRef CAS PubMed.
- R Core Team, R: A Language and Environment for Statistical Computing, R Foundation for Statistical Computing, Vienna, Austria, 2013 Search PubMed.
- D. Philip, Vegan, a Package of R Functions for Community Ecology, J. Veg. Sci., 2003, 14, 927–930 CrossRef.
- K. Burrow, W. Young, M. McConnell, A. Carne, D. Barr, M. Reid and A. E.-D. Bekhit, The Distribution of Essential, Trace, and Non-Essential Minerals in Weanling Male Rats Fed Sheep or Cow Milk, Mol. Nutr. Food Res., 2018, 62, 1800482 CrossRef.
- Z. Noor, N. Kania and B. Setiawan, Tibia Bone Properties at Different Time Course of Ovariectomized Rats, J. Diabetes Metab. Disord., 2014, 13, 91 CrossRef.
- B. Clarke, Normal Bone Anatomy and Physiology, Clin. J. Am. Soc. Nephrol., 2008, 3, S131–S139 CrossRef CAS PubMed.
- R. K. Dirkes, M. W. Richard, G. M. Meers, D. N. Butteiger, E. S. Krul, J. P. Thyfault, R. S. Rector and P. S. Hinton, Soy Protein Isolate Suppresses Bone Resorption and Improves Trabecular Microarchitecture in Spontaneously Hyperphagic, Rapidly Growing Male Oletf Rats, Curr. Dev. Nutr., 2018, 2, nzy010 Search PubMed.
- U. Agata, J. Park, S. Hattori, Y. Aikawa, Y. Kakutani, I. Ezawa, T. Akimoto and N. Omi, The Impact of Different Amounts of Calcium Intake on Bone Mass and Arterial Calcification in Ovariectomized Rats, J. Nutr. Sci. Vitaminol., 2015, 61, 391–399 CrossRef CAS.
- S. Reddi, V. P. Shanmugam, S. Kapila and R. Kapila, Identification of Buffalo Casein-Derived Bioactive Peptides with Osteoblast Proliferation Activity, Eur. Food Res. Technol., 2016, 242, 2139–2146 CrossRef CAS.
- S. B. Mada, S. Reddi, N. Kumar, R. Kumar, S. Kapila, R. Kapila, R. Trivedi, A. Karvande and N. Ahmad, Antioxidative Peptide from Milk Exhibits Antiosteopenic Effects through Inhibition of Oxidative Damage and Bone-Resorbing Cytokines in Ovariectomized Rats, Nutrition, 2017, 43, 21–31 CrossRef.
- X. Zou, J. Huang, Q. Jin, Z. Guo, Y. Liu, L. Cheong, X. Xu and X. Wang, Lipid Composition Analysis of Milk Fats from Different Mammalian Species: Potential for Use as Human Milk Fat Substitutes, J. Agric. Food Chem., 2013, 61, 7070–7080 CrossRef CAS.
- M. C. Kruger and M. Coetzee, in Nutritional Influences on Bone Health, ed. P. Burckhardt, B. Dawson-Hughes and C. M. Weaver, Springer, London, 2013, ch. 13, pp. 133–145 Search PubMed.
- M. Högström, P. Nordström and A. Nordström, N−3 Fatty Acids Are Positively Associated with Peak Bone Mineral Density and Bone Accrual in Healthy Men: The No2 Study–, Am. J. Clin. Nutr., 2007, 85, 803–807 CrossRef PubMed.
- B. A. Watkins, Y. Li, H. E. Lippman and S. Feng, Modulatory Effect of Omega-3 Polyunsaturated Fatty Acids on Osteoblast Function and Bone Metabolism, Prostaglandins, Leukotrienes Essent. Fatty Acids, 2003, 68, 387–398 CrossRef CAS.
- N. Vithana, S. Mason, A. Bekhit and J. Morton, In Vitro Digestion of Red Deer (Cervus elaphus) and Cow (Bos taurus) Milk, Int. Food Res. J., 2012, 19, 1367–1374 CAS.
- C. F. Balthazar, T. C. Pimentel, L. L. Ferrao, C. N. Almada, A. Santillo, M. Albenzio, N. Mollakhalili, A. M. Mortazavian, J. S. Nascimento, M. C. Silva, M. Q. Freitas, A. S. Sant'Ana, D. Granato and A. G. Cruz, Sheep Milk: Physicochemical Characteristics and Relevance for Functional Food Development, Compr. Rev. Food Sci. Food Saf., 2017, 16, 247–262 CrossRef.
- W. Claeys, C. Verraes, S. Cardoen, J. De Block, A. Huyghebaert, K. Raes, K. Dewettinck and L. Herman, Consumption of Raw or Heated Milk from Different Species: An Evaluation of the Nutritional and Potential Health Benefits, Food Control, 2014, 42, 188–201 CrossRef.
- R. P. Heaney, Vitamin D and Calcium Interactions: Functional Outcomes, Am. J. Clin. Nutr., 2008, 88, 541S–544S CrossRef CAS PubMed.
- A. Fried, S. L. Manske, L. K. Eller, C. Lorincz, R. A. Reimer and R. F. Zernicke, Skim Milk Powder Enhances Trabecular Bone Architecture Compared with Casein or Whey in Diet-Induced Obese Rats, Nutrition, 2012, 28, 331–335 CrossRef CAS PubMed.
- S. Viguet-Carrin, M. Hoppler, F. Membrez Scalfo, J. Vuichoud, M. Vigo, E. A. Offord and P. Ammann, Peak Bone Strength Is Influenced by Calcium Intake in Growing Rats, Bone, 2014, 68, 85–91 CrossRef CAS PubMed.
- R. W. Leggett, L. R. Williams, D. R. Melo and J. L. Lipsztein, A Physiologically Based Biokinetic Model for Cesium in the Human Body, Sci. Total Environ., 2003, 317, 235–255 CrossRef CAS PubMed.
- G. F. Nordberg, M. Nordberg, B. A. Fowler and L. T. Friberg, Handbook on the Toxicology of Metals, Elsevier, Burlington, 3rd edn, 2007 Search PubMed.
Footnote |
| † Electronic supplementary information (ESI) available. See DOI: 10.1039/c8fo01598h |
| This journal is © The Royal Society of Chemistry 2019 |