DHA-phospholipids (DHA-PL) and EPA-phospholipids (EPA-PL) prevent intestinal dysfunction induced by chronic stress†
Wanxiu
Cao
 ,
Chengcheng
Wang
,
Yaoxian
Chin
,
Xin
Chen
,
Yuan
Gao
,
Shihan
Yuan
,
Changhu
Xue
,
Yuming
Wang‡
,
Chengcheng
Wang
,
Yaoxian
Chin
,
Xin
Chen
,
Yuan
Gao
,
Shihan
Yuan
,
Changhu
Xue
,
Yuming
Wang‡
 * and
Qingjuan
Tang‡
 *
*
College of Food Science and Engineering, Ocean University of China, Yushan Road 5th, Qingdao, Shandong Province 266003, China. E-mail: wangyuming@ouc.edu.cn; tangqingjuan@ouc.edu.cn; Fax: +86-532-82032468; Tel: +86-532-82032597
First published on 4th December 2018
Abstract
Stress exposure can increase the appearance of intestinal dysfunction. DHA and EPA have been shown to possess significant anti-inflammatory and immuno-enhancement bioactivities. The aim of the study was to investigate whether different forms of DHA or EPA would affect intestinal barriers (including intestinal epithelium integrity and immunity responses, gut microbiota and its metabolites) in mice under chronic stress, and might therefore prevent stress induced intestinal dysfunction. Chronic stress caused a series of anomalies in the intestine, including decreased faecal water content, increased pro-inflammatory cytokines (IFN-γ, TNF-α, IL-1β and IL-6), reduced expression levels of ZO-1, occludin and E-cadherin, and aberrant microbiota composition (especially Roseburia spp., Prevotella spp., bifidobacteria and lactobacilli) and its metabolites, mainly LPS, acetic acid, propionic acid and butyric acid. Our data indicated that both DHA-PL and EPA-PL counteracted these adverse effects effectively. In conclusion, DHA-PL and EPA-PL may effectively protect mice against intestinal dysfunction under chronic stress exposure as potential ingredients for functional food.
Introduction
In modern society, people constantly endure various forms of stress from physical fatigue, work or lifestyle changes, and so on. These physical or psychological stressors may result in serious consequences, such as chronic fatigue syndrome, depression or anxiety.1,2 Recent studies have increasingly suggested that chronic stress may initiate intestinal dysfunction, such as irritable bowel syndrome (IBS), which is mainly characterized by abnormal gut motility, leaking intestinal epithelium and mucosal inflammation.3,4 Interactions between gut microbiota and host intestinal mucosa have been shown to contribute to aberrant gut inflammation induced by chronic stress, resulting in stress-driven syndromes.5Intestinal barriers, including physical, microbiological and immunological barriers, are a key component of intestinal defense against infection and inflammation.6 The intact physical barrier comprises a single layer of intestinal epithelial cells, which are tightly bound together by junctional complexes, including tight junctions, adherens junctions and desmosome.7 The microbiological barrier refers to commensal bacteria and their metabolites, providing an important barrier effect mainly by competing with invading microorganisms.8 Another barrier against pathogens is the immunological barrier, and it is mainly composed of pattern recognition receptors (PRRs), gut lymphoid tissue and endocrine cells, which can secret antimicrobial peptides and inflammatory cytokines.9
Crucially, the intestinal barriers are influenced by neural hormones, and are therefore potential targets for stress intervention.10 A compromised intestinal barrier is the primary determinant of intestinal dysfunction through the translocation of LPS from increased Gram-negative enterobacterium induced by chronic stress.11 LPS-driven stimulation of TLR4 activates the canonical NF-κB pathway via phosphorylating TAK1 kinase,12 and then stimulates the release of pro-inflammatory cytokines (e.g. IL-1, IL-6 and IL-8) and impairs intestinal barriers.13 Therefore, therapeutic restoration of intestinal barriers may be imperative for the amelioration of stress induced intestinal dysfunction.
Various methods have been validated for scientific research on specific stressors in animal models, including, but not limited to, bad animal housing conditions, forced swimming, noise interference, and chemical exposure.14,15 Intraperitoneal injection of low-dose LPS exacerbates chronic stress induced symptoms. Therefore, experimental mice were regularly injected with LPS to enhance the effects of chronic stress in this study.
Recently, scientists have started to realize the importance of nutritional strategy that can ameliorate stress-induced intestinal dysfunction.16,17 Dietary DHA and EPA have been shown to maintain the intestinal barrier function and possess an anti-inflammatory effect.18,19 Among the various molecular forms of DHA and EPA, DHA-PL/DHA-TG and EPA-PL/EPA-TG can be directly extracted from natural sources, while DHA-EE/EPA-EE is artificially synthesized.20,21 Previous studies have reported that DHA and EPA in the form of a phospholipid are superior to other forms with respect to tissue absorption and anti-inflammatory activity.22,23
This study aimed to determine the effect of DHA-PL and EPA-PL on chronic stress induced dysfunction in the intestine, and discover the mechanism underlying it. Accordingly, we analyzed and compared the protective effects of DHA-PL and EPA-PL with DHA-EE and EPA-EE on stress-induced intestinal barrier impairment and inflammatory responses.
Materials and methods
Preparation of DHA and EPA
Using a method described by Liu et al., DHA-PL and EPA-PL were extracted respectively from squid (S. oualaniensis) egg and sea cucumber (C. frondosa). The yield of the DHA-PL sample and EPA-PL sample from the raw material was 50–60% and 5% on a dry weight basis, respectively. The purity of the two PL samples from squid egg and sea cucumber was also confirmed by HPLC-ELSD analysis as previously described,24 and the results were 93% and 94%, respectively. Synthetic DHA-EE and EPA-EE were purchased from Sinomega Biotech Engineering Co., Ltd (Zhoushan, China).Determination of fatty acid composition
The fatty acid compositions of the DHA and EPA samples were determined as described by the method of L. Zhang.25 The DHA-PL and EPA-PL samples contain DHA and EPA: 38% and 9%, and 5% and 36%, respectively. The DHA-EE and EPA-EE samples contain DHA and EPA: 89% and 11%, and 10% and 79%, respectively.Animals and treatments
This study was carried out in strict accordance with the Guide for the Care and Use of Laboratory Animals of the National Institutes of Health. All experimental procedures were approved by the Committee on the Ethics of Animal Experiments of Ocean University of China (approved protocol ID SCKK2012-0001).Male BALB/c mice were purchased from Vital River Laboratory Animal Technology Co., Ltd (Beijing, China) at 4 weeks of age. All the animals were individually housed in polycarbonate cages, and all the cages were under controlled conditions of lighting (12 h light/dark cycle), temperature (24 ± 2 °C) and humidity (65 ± 15%). After a week of acclimatization, the mice were randomly divided into 6 groups (n = 10): control, model, DHA-PL treatment, EPA-PL treatment, DHA-EE treatment and EPA-EE treatment groups. All the groups were maintained with free access to food and water. The ingredients of the experimental diets (based on AIN-93 M) are summarized in ESI Table S1.† Corresponding amounts of soybean oil were subtracted from the diets of treatment groups to counteract the lipid content in treatment doses.
Chronic stress protocol
As shown in ESI Fig. S1,† five groups were subjected to chronic stress every day, while the control group remained in another room. The stress-treated mice were subjected to one of the following stressors randomly every day for 21 days: wet bedding, swimming in 24 °C water for 25 min, chronic immobilization for 2 h and noise disturbances for 2 h. Every 7 days, all mice except those in the control group were injected with 0.1 mg kg−1 of LPS intraperitoneally. Body weight and food consumption of the mice were monitored until the end of the study.Sample collection
After 21 days of feeding, the mice were anesthetized and killed by cervical dislocation after fasting for 12 h. Following sacrifice, the intestine was harvested and 2 cm length of jejunum was immediately fixed in 4% paraformaldehyde. Subsequently, other intestinal samples were frozen in liquid nitrogen immediately. Blood was collected and serum was separated by centrifugation at 7500 rpm for 15 min. Faeces in the colon were collected for faecal DNA extraction and microbiota metabolite measurement. All samples were stored at −80 °C until analysis.Analysis of intestinal morphology
The jejunum samples fixed in 4% paraformaldehyde were routinely processed using haematoxylin and eosin (HE) staining and Alcian blue staining as previously mentioned.26,27Measurement of faecal water content
Faecal samples collected by rectal stimulation were treated using a drying oven (110 °C, 24 h). Faecal water content (%) is calculated by:Wwet and Wdry are the weight of the faecal sample before and after drying in the oven.
Real-time qPCR
Total RNA from intestinal samples was extracted using the method of Shi et al.28 Real-time qPCR was performed according to the method described previously.29 The primers were synthesized by Shanghai Sangon Gene Company (Qingdao, China) and the sequences are listed in Table S2.† The results were expressed as relative mRNA expression compared to the control mice.ELISA analysis
The cell nucleus extracted from the intestinal sample was isolated using the Nuclear Extract Kit from Beijing Solarbio Science & Technology Co., Ltd (Beijing, China). The expression level of NF-κB p65 was analyzed with a commercial ELISA kit from Shanghai Fanke Biotechnology Co., Ltd (Shanghai, China) following the manufacturer's instructions.Western blot
For protein extraction, jejunum homogenate was lysed with RIPA lysis buffer and PMSF. Then the lysates were centrifuged at 12![[thin space (1/6-em)]](https://www.rsc.org/images/entities/char_2009.gif) 000g for 5 minutes, and the supernatant was collected. Protein concentration was determined by using a BCA kit (Beyotime, China). Samples were boiled to denature at 100 °C for 15 min before separation on 10% SDS-PAGE gels. Then the protein was wet-transferred to a 0.22 μm PVDF membrane (Millipore, USA). After this, the membranes were subjected to overnight incubation at 4 °C with a primary antibody against occludin, ZO-1 and E-cadherin (Proteintech, China). Then the membranes were incubated with the anti-mouse secondary antibody for 2 h at room temperature, successively. The gel images were scanned by using an imaging system (Tanon, China).
000g for 5 minutes, and the supernatant was collected. Protein concentration was determined by using a BCA kit (Beyotime, China). Samples were boiled to denature at 100 °C for 15 min before separation on 10% SDS-PAGE gels. Then the protein was wet-transferred to a 0.22 μm PVDF membrane (Millipore, USA). After this, the membranes were subjected to overnight incubation at 4 °C with a primary antibody against occludin, ZO-1 and E-cadherin (Proteintech, China). Then the membranes were incubated with the anti-mouse secondary antibody for 2 h at room temperature, successively. The gel images were scanned by using an imaging system (Tanon, China).
Primary antibodies against ZO-1 (dilution 1![[thin space (1/6-em)]](https://www.rsc.org/images/entities/char_2009.gif) :
:![[thin space (1/6-em)]](https://www.rsc.org/images/entities/char_2009.gif) 1000), occludin (dilution 1
1000), occludin (dilution 1![[thin space (1/6-em)]](https://www.rsc.org/images/entities/char_2009.gif) :
:![[thin space (1/6-em)]](https://www.rsc.org/images/entities/char_2009.gif) 500), E-cadherin (dilution 1
500), E-cadherin (dilution 1![[thin space (1/6-em)]](https://www.rsc.org/images/entities/char_2009.gif) :
:![[thin space (1/6-em)]](https://www.rsc.org/images/entities/char_2009.gif) 2000), TLR4 (dilution 1
2000), TLR4 (dilution 1![[thin space (1/6-em)]](https://www.rsc.org/images/entities/char_2009.gif) :
:![[thin space (1/6-em)]](https://www.rsc.org/images/entities/char_2009.gif) 1000), TAK1 (dilution 1
1000), TAK1 (dilution 1![[thin space (1/6-em)]](https://www.rsc.org/images/entities/char_2009.gif) :
:![[thin space (1/6-em)]](https://www.rsc.org/images/entities/char_2009.gif) 1000), NF-κB p65 (dilution 1
1000), NF-κB p65 (dilution 1![[thin space (1/6-em)]](https://www.rsc.org/images/entities/char_2009.gif) :
:![[thin space (1/6-em)]](https://www.rsc.org/images/entities/char_2009.gif) 500), β-actin (dilution 1
500), β-actin (dilution 1![[thin space (1/6-em)]](https://www.rsc.org/images/entities/char_2009.gif) :
:![[thin space (1/6-em)]](https://www.rsc.org/images/entities/char_2009.gif) 2000), and anti-rabbit secondary antibodies (dilution 1
2000), and anti-rabbit secondary antibodies (dilution 1![[thin space (1/6-em)]](https://www.rsc.org/images/entities/char_2009.gif) :
:![[thin space (1/6-em)]](https://www.rsc.org/images/entities/char_2009.gif) 2000) were purchased from Proteintech Group, Inc. (Wuhan, China). GPR120 (dilution 1
2000) were purchased from Proteintech Group, Inc. (Wuhan, China). GPR120 (dilution 1![[thin space (1/6-em)]](https://www.rsc.org/images/entities/char_2009.gif) :
:![[thin space (1/6-em)]](https://www.rsc.org/images/entities/char_2009.gif) 1000) was obtained from Thermo Fisher Scientific Inc. (USA).
1000) was obtained from Thermo Fisher Scientific Inc. (USA).
Analysis of dominant faecal microbiota
Total DNA was extracted from the faecal samples collected from the colon with a fast DNA stool kit (QIAamp, Germany) according to the manufacturer's instructions. DNA integrity was verified using a BioAnalyzer 2000 (Agilent, Palo Alto, CA, USA).Total bacteria and the main taxonomic groups or species of the gut microbiota, such as Roseburia spp., Bacteroides, Prevotella spp., bifidobacteria, lactobacilli and Bacteroides fragilis, were quantified by quantitative PCR as described before.30,31 The primer sequences are provided in Table S3.†
Determination of primary microbiota metabolites
Faecal LPS levels were measured with an ELISA kit (Shanghai Elisa Biotech Co. Ltd, China), following the manufacturer's protocols.Faecal SCFA content was determined by gas chromatography (GC) as previously described with some modification. Chromatographic analysis was carried out using an Agilent 6890 system with a flame ionization detector (FID).32 30 m × 0.25 mm columns coated with a 0.25 μm thick film (Agilent, CB-FFAP, USA) were used for volatile acids. The oven temperature was 170 °C, and the temperature of the FID and the injection port was 250 °C. The volume of the injected sample was 2 μL and each analysis was run for 17 min. A mixture of SCFAs containing acetic, propionic, butyric, valeric, isobutyric and isovaleric acids (Aladdin, China) was used to obtain a standard chromatographic profile for these acids. A standard solution containing 2-ethyl butyrate was prepared as an internal standard control.
Statistical analysis
Statistical analysis of two groups was performed using Student's t test; comparisons of multiple groups were analyzed by one-way ANOVA; and the correlation coefficient was evaluated by Pearson correlation analysis with SPSS 24.0. Data were presented as mean ± SEM. Significance was accepted at *p < 0.05, **p < 0.01 vs. the control group; # p < 0.05, ## p < 0.01 vs. the model group.Results
Changes in body weight gain, food intake and faecal water content
Exposure to stress always produces various physiological effects in animals, such as changes in food intake and body weight gain.33,34 However, as shown in Table 1, there was no significant difference in body weight gain and food intake between all groups.| Group | Normal | Model | DHA-PL | EPA-PL | DHA-EE | EPA-EE |
|---|---|---|---|---|---|---|
| Food intake (g per day) | 3.23 ± 0.22 | 3.10 ± 0.16 | 3.12 ± 0.18 | 3.18 ± 0.10 | 3.04 ± 0.14 | 3.04 ± 0.13 |
| Body weight gain (g) | 2.93 ± 0.68 | 2.48 ± 0.71 | 2.35 ± 0.71 | 2.93 ± 0.67 | 2.52 ± 0.44 | 2.82 ± 0.45 |
| Fecal wet weight (mg per piece) | 19.04 ± 3.68 | 12.18 ± 2.25** | 18.34 ± 4.18# | 17.36 ± 4.24# | 14.98 ± 2.45 | 14.28 ± 3.79 |
| Fecal water content (%) | 52.46 ± 12.84 | 31.14 ± 12.68* | 45.29 ± 13.29 | 44.72 ± 15.23 | 42.32 ± 12.19 | 42.56 ± 11.63 |
As stress exposure is a well-known stimulator of functional gut disorders, faecal water content was measured as a marker of gut motility (Table 1). The faecal wet weight of the model group was significantly lower when compared to the normal group (6.86 mg reduction, p < 0.01), as was faecal water content (21.32% reduction, p < 0.05). An increase in the faecal wet weight by DHA-PL and EPA-PL, but not DHA-EE and EPA-EE, was also evident (p < 0.05). Meanwhile, faecal water contents were slightly enhanced in the DHA-PL and EPA-PL groups.
DHA-PL and EPA-PL supplementation protected intestinal epithelium integrity in mice under chronic stress
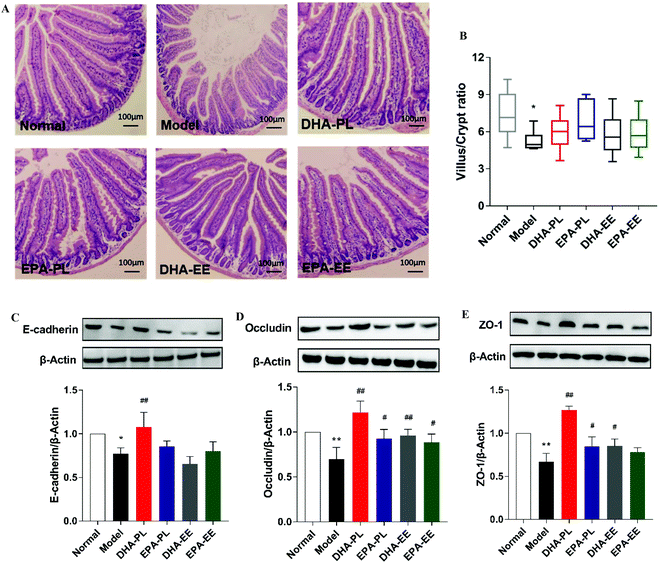
To evaluate whether chronic stress induced gut dysfunction, analysis of intestinal physical barrier integrity was conducted. Firstly, the histological morphology of the jejunum was evaluated (Fig. 1A). When compared to normal mice, the villus to crypt (V/C) ratio was significantly decreased in mice under chronic stress (p < 0.05; Fig. 1B), while the intestinal villus length and crypt depth were not significantly impacted (Fig. S2A and B†). But all the test substances did not appear to have a notable effect on the intestinal villus length (V), crypt depth (C) and V/C ratio, as shown in Fig. S2 A, B† and Fig. 1B.We also analyzed the reduced protein expression of the adherens junction protein E-cadherin and tight junction components, including ZO-1 and occludin, and these effects were reversed by DHA and EPA supplementation (Fig. 1C–E). For example, DHA-PL and EPA-PL increased the expression of occludin by 77.78% and 34.49%, respectively. In addition, DHA-EE also improved the expression of occludin and ZO-1 significantly (p < 0.05).
DHA-PL and EPA-PL supplementation ameliorated gut inflammation in mice under chronic stress
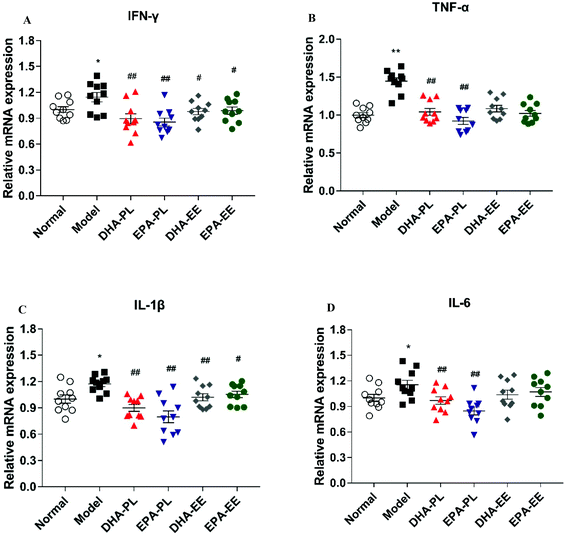
As a part of the immunological barrier, pro-inflammatory cytokines were examined as markers of gut inflammation and immune mediators reacted to physical barrier damage. As demonstrated in Fig. 2A–D, IFN-γ, TNF-α, IL-1β and IL-6 exhibited significantly enhanced the expression in mice under chronic stress (p < 0.05). In contrast, mice treated with DHA-PL and EPA-PL showed markedly decreased the expression of the abovementioned cytokines (p < 0.01). Similarly, the administration of DHA-EE and EPA-EE significantly decreased the expression of IFN-γ and IL-1β (p < 0.05, Fig. 2A and C), but were less effective than DHA-PL and EPA-PL.DHA-PL and EPA-PL supplementation regulated TLR4/NF-κB p65 signaling
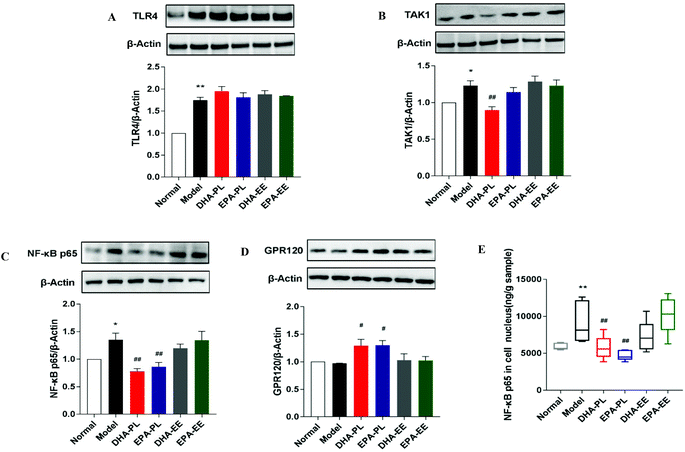
To investigate whether the impairment of the intestinal epithelial barrier and increased expression of pro-inflammatory cytokines were the result of elevated systemic LPS (data not shown), western blot analysis was used to study the expression of several regulators in TLR4/NF-κB p65 signaling. Mice treated with chronic stress exhibited marked increases in the protein expression of TLR4 (p < 0.01; Fig. 3A). However, the administration of DHA and EPA did not abrogate the stimulatory effect of LPS on TLR4 expression. DHA-PL or EPA-PL led to an attenuated increase in the protein expression of TAK1 and NF-κB p65 in mice under chronic stress in this study (p < 0.01), while DHA-EE and EPA-EE didn't exhibit any effect (Fig. 3B and C). The level of NF-κB p65 in the cell nucleus was also detected, and the results suggested that DHA-PL and EPA-PL could prevent the translocation of NF-κB p65 to the nucleus effectively (Fig. 3E).The functional ω-3 fatty acid receptor GPR120, which could affect LPS-driven inflammatory responses, was also detected. DHA-PL and EPA-PL have been shown to promote the expression of GPR120 significantly (p < 0.01). As shown in Fig. 3D, the relative expression of GPR 120 was respectively increased by 33.19% and 33.89%, but DHA-EE and EPA-EE were ineffective.
DHA-PL and EPA-PL supplementation modulated dominant gut microbiota in faeces
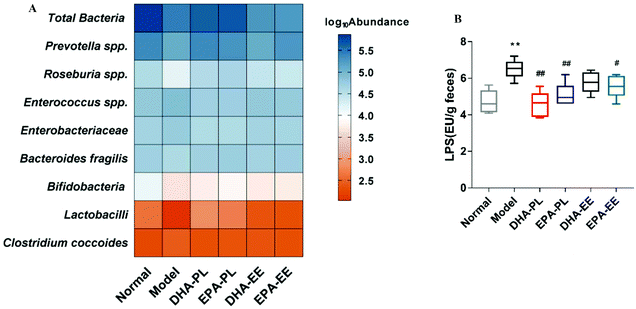
Total bacteria displayed a large difference in relative abundance between the control and model groups (p < 0.01), and this reduction was slightly improved by DHA-PL and EPA-PL supplementation (Fig. 4A). Then we analyzed the following common probiotics—lactobacilli and bifidobacteria, which are related to maintaining intestinal epithelium integrity and inhibiting inflammatory responses. Compared with the normal group, their abundance was decreased significantly in the model group (p < 0.05), while lactobacilli was significantly increased in the DHA-PL and EPA-PL groups (p < 0.01). However, DHA-EE and EPA-EE did not exert the same effects on the abundance of lactobacilli and bifidobacteria in mice under chronic stress.We also investigated several neutral or harmful microbes involved in mucosal inflammation. Compared with the normal group, Clostridium coccoides in the model group was remarkably increased, whereas Bacteroides fragilis was significantly reduced (p < 0.05). In contrast to Clostridium coccoides, Bacteroides fragilis was significantly increased in mice supplemented with EPA-PL and EPA-EE (p < 0.05). Moreover, Enterobacteriaceae and Enterococcus spp., both related to gut inflammation, were increased markedly in the model group, and their abundance was significantly decreased by DHA-PL and EPA-PL (p < 0.01).
Finally, Prevotella spp. and Roseburia spp., which mainly produce acetate and butyrate, respectively, were significantly reduced in mice under chronic stress (p < 0.01), and were notably restored in mice supplemented with DHA-PL (p < 0.01). Furthermore, EPA-PL markedly increased the abundance of Prevotella spp. (p < 0.01). Together, these findings indicated that SCFAs might be significantly different in all the groups in our study.
DHA-PL and EPA-PL supplementation changed primary microbiota metabolites
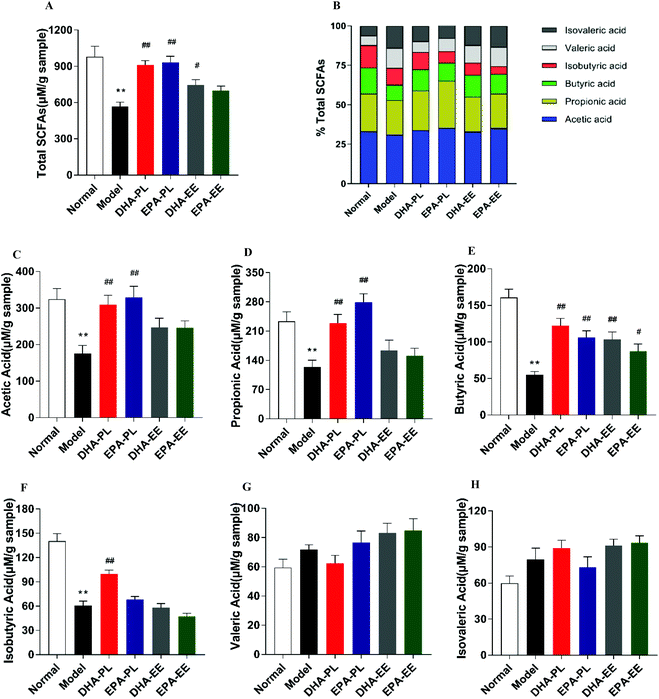
Faecal LPS concentrations were measured to determine whether stress induced changes of gut microbiota resulted in an increased LPS production. The results showed that the LPS level was approximately 1.4-fold higher in the model group (6.51 EU per g of faeces) than that in the normal group (4.71 EU per g of faeces) (p < 0.01), and DHA-PL, EPA-PL and EPA-EE could effectively decrease faecal LPS levels in mice under chronic stress (p < 0.05; Fig. 4B).SCFAs, especially acetic acid and butyric acid, are effective in improving intestinal epithelium integrity and reducing gut inflammation.35,36 In our study, total SCFA levels were significantly reduced in chronic stress treated mice (p < 0.01; Fig. 5A). Of note, DHA-PL, EPA-PL and DHA-EE increased total SCFA levels from 566.39 ± 90.30 μM to 912.53 ± 84.70 μM, 932.93 ± 124.79 μM, and 746.58 ± 105.42 μM, respectively. Fig. 5B shows the percentage of detectable individual SCFAs accounting for total SCFAs. It turned out that acetic acid was the most prevailing product with a fraction of 30.99–35.33%. Changes in the percentage of butyric acid, valeric acid and isovaleric acid between all the groups were evident. For example, the percentage of butyric acid decreased from 16.44% to 9.70% when compared to the normal group, and butyric acid accounted for 13.43% and 13.85% in the DHA-PL and EPA-PL groups.
As is shown in Fig. 5C–E, while chronic stress induced a significant reduction in faecal acetic acid, propionic acid and butyric acid levels, DHA-PL and EPA-PL supplementation significantly increased their production (p < 0.01). Similarly, an increase in faecal butyric acid was observed in the DHA-EE and EPA-EE groups (p < 0.05; Fig. 5E). By comparison, isobutyric acid was increased by DHA-PL in mice under chronic stress (p < 0.01, Fig. 5F). Finally, valeric acid and isovaleric acid did not change significantly among all the groups (Fig. 5G and H).
DHA-PL and EPA-PL supplementation stimulated the expression of FFAR2 and subsequently regulated intestinal immunity
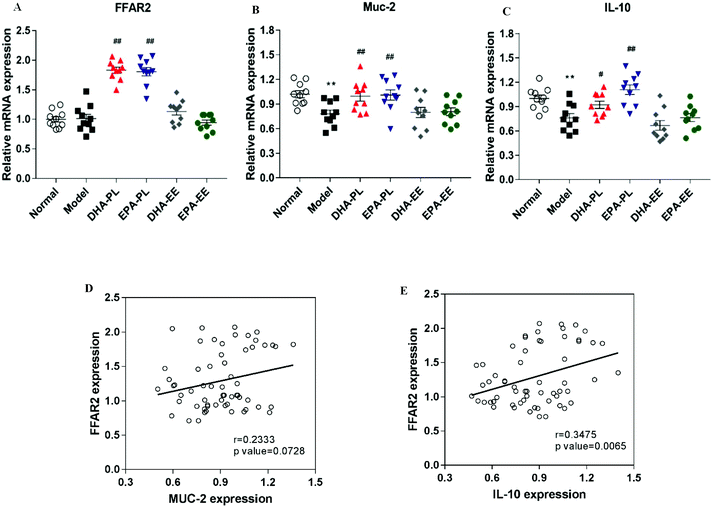
FFAR2 (also known as GPR43), a key receptor for SCFAs, plays a vital role in stimulating the release of mucins and facilitating the production of anti-inflammatory cytokines.37 Our results demonstrated that the mRNA expression of FFAR2 was significantly upregulated in the DNA-PL and EPA-PL groups (p < 0.01; Fig. 6A). The expressions of Muc-2 and IL-10 were markedly suppressed in the model group (p < 0.01; Fig. 6B and C). In contrast, the expression of mucin 2 (Muc-2) was increased by DHA-PL and EPA-PL significantly (p < 0.01; Fig. 6B). Then Alcian blue staining of mucins was performed, and the results also supported that DHA-PL and EPA-PL could improve the levels of mucins (Fig. S2C†). Consistently, DHA-PL and EPA-PL also highly enhanced the expression of IL-10 (Fig. 6C). As illustrated in Fig. 6E, mRNA expressions of FFAR2 and IL-10 were positively correlated (r = 0.3475, p = 0.0065). But there was no correlation between FFAR2 and Muc-2 expressions (r = 0.2333, p = 0.0728; Fig. 6D).Discussion
Chronic stress is an important factor in the initiation of gut dysfunction by impairing intestinal barriers. Disorder of gut motility is one of the most well-known intestinal stress responses.38 Most studies suggest that stressful stimuli contribute to diarrhea.39,40 But our data suggested that chronic stress exposure might result in potential constipation, and DHA and EPA supplementation could ameliorate it.41Decreased expression of tight junctions and adherens junctions promotes intestinal epithelium damage and sequentially exacerbates gut inflammation.42 Consistent with other studies,43,44 we found that chronic stress led to intestinal leakage. Beguin et al. demonstrated that DHA could partially restore the occludin intensity and improve the functionality of ZO-1.45 Similarly, our findings suggested that all the preparations of DHA and EPA, especially DHA-PL, might effectively prevent the impairment of the intestinal physical barrier in mice under chronic stress.
Intestinal barrier damage is always accompanied by the elevation of pro-inflammatory cytokines, such as IL-1α, IL-1β, IL-6, and IFN-γ.46 Xu et al. observed a significant increase in IL-6 and TNF-α mRNA levels in mice exposed to chronic water avoidance stress (WAS) or repeated restraint stress.47 We also obtained evidence that exposure of chronic stress rendered mice highly susceptible to gut inflammation.
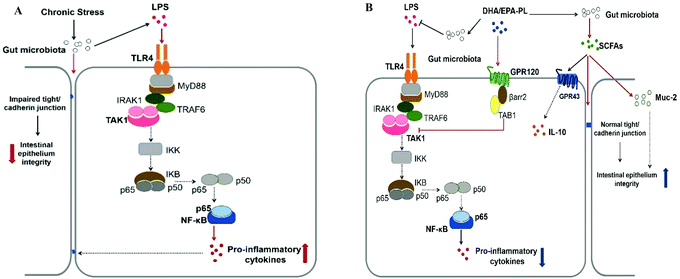
The occurrence of gut inflammation and intestinal leakage can be attributed to the activation of TLR4, one of the most important PRRs.48 Previous studies have demonstrated that DHA and EPA reduce inflammatory reactions activated by LPS via a TLR4/NF-κB-dependent pathway.49 Similarly, DHA-PL and EPA-PL could suppress the LPS-induced synthesis of pro-inflammatory cytokines via inhibiting TAK1 and NF-κB expressions. Besides, GPR120 is an omega-3 fatty acid receptor mediating potential anti-inflammatory effects through inhibiting TAK1.50 The expression of GPR120 was markedly elevated by DHA-PL and EPA-PL, which might explain their anti-inflammatory effect.
Clearly, abnormal composition of gut microbiota can also lead to the impairment of the intestinal physical barrier and the development of gut inflammation.51 Thus, therapeutic approaches to modulate gut microbiota could be a potential approach for ameliorating intestinal dysfunction induced by chronic stress.52 However, currently, the study about gut microbiota regulation by DHA or EPA is very little as we know.
Constipation might be closely related to changes of gut microbiota. Bifidobacteria and lactobacilli were decreased significantly in irritable bowel syndrome patients with constipation (C-IBS),53 while Enterobacteriaceae was shown to be increased in C-IBS individuals compared with the control ones.54 Choi et al. also report a significant decrease in the abundance of bifidobacteria in patients with functional constipation.55
We also confirm that specific strains of lactobacilli and bifidobacteria may regulate the transcription of genes encoding tight junctions, which can support the integrity of the intestinal epithelium.56,57 In accordance with previous findings,31 our data suggested that bifidobacteria and lactobacilli were decreased by stress stimuli, and it might be one of the most important causes of stress-induced intestinal leakage. Fortunately, DHA-PL and EPA-PL effectively increased lactobacilli, which might be helpful for ameliorating intestinal leakage.
As reported before,58 chronic stress resulted in higher levels of LPS in this study. Stimulation of NF-κB through TLR4 by excessive levels of LPS can promote gut inflammation, and this adverse effect can be ameliorated by the modulation of gut microbiota by DHA and EPA treatment. Although bifidobacteria have been reported to significantly inhibit LPS-induced activation of NF-κB,59 their abundance did not change significantly in DHA or EPA treated mice. Lactobacilli can also decrease pro-inflammatory cytokine production in a LPS activated murine model,60 and our findings support this.
Additionally, the populations of Clostridium coccoides and Bacteroides fragilis have been found to change significantly after stress.61 Fortunately, Bacteroides fragilis was notably increased in mice fed with EPA-PL and EPA-EE in this study. According to Mazmanian et al., increased proportion of Bacteroides fragilis is capable of facilitating anti-inflammatory IL-10 production in the intestine.62 Furthermore, Enterococcus spp. have been shown to result in consistent and increased colon inflammation in IL10−/− mice.63 In accordance with our results, Nedialkova et al. have reported that gut inflammation favours the overgrowth of Gram-negative Enterobacteriaceae.64
Previous studies have reported that chronic stress exposure can lead to significant reduction in total SCFAs, and then promote intestinal dysfunction.52 According to previous reports,65,66 DHA or EPA supplementation can significantly increase faecal total SCFA concentration, but Zhuang et al. suggest that SCFA concentration is not affected.67 Consistent with this, we observed a significant increase in the faecal levels of total SCFAs, particularly acetic acid, propionic acid and butyric acid, with the supplementation of DHA-PL and EPA-PL.
SCFA-mediated activation of FFAR2 contributes to the production of anti-inflammatory cytokines and the protection of intestinal barriers.68 Intestinal epithelium is lined by a layer of mucins, mainly Muc-2, which can facilitate the intestinal immunological barrier via providing binding sites for antibacterial peptides.69 DHA-PL and EPA-PL could effectively reverse the suppression of the Muc-2 level in mice under chronic stress according to our data. However, there was no significant correlation between the expression levels of FFAR2 and Muc-2. It can be speculated that the secretion of Muc-2 might be promoted by other factors in our study.
Another device for protecting intestinal mucosa from chronic stress interference is the production of anti-inflammatory cytokines. For example, IL-10 plays a role in the regulation of immune responses, and is also implicated in stress responses.70 In this study, we have identified a link between the mRNA expressions of FFAR2 and IL-10. Moreover, IL-10 can also upregulate genes related to Muc-2 folding and maintain correct folding of Muc-2,71 thus improving intestinal epithelium integrity.
Overall, DHA-PL and EPA-PL might have therapeutic effects on stress induced intestinal dysfunction, and they were more effective than DHA-EE and EPA-EE. Previous studies also indicated that DHA-PL and EPA-PL would exert superior biological functions such as decreasing adipocyte size,72 improving lipid catabolism,73 and reducing hepatic steatosis.74 Cansell et al.75 pointed out that this can be attributed to better absorption of DHA-PL and EPA-PL in the gut. Burri et al.76 performed hepatic transcriptome analysis to compare mice fed with n-3 PUFA in the form of PL and n-3 PUFA in the form of TG, and found that the former could effectively downregulate pathways related to hepatic lipid synthesis. However, the specific mechanism behind these superior effects of n-3 PUFA in the form of PL is unclear, and we may conduct further studies in the future.
The mechanisms of DHA-PL and EPA-PL ameliorating stress-driven intestinal dysfunction are summarized in Fig. 7A and B. Notably, our data suggested that gut microbiota and its metabolites could be potential targets for preventing stress-induced intestinal dysfunction. To investigate more, we may conduct further studies which actually measure the whole composition and diversity of intestinal microbiota in mice under stress through high throughput sequencing in the future.
Conclusions
In summary, DHA-PL and EPA-PL have the capacity to alleviate chronic stress induced-intestinal dysfunction, such as abnormal intestinal motility and pro-inflammatory responses, through repairing intestinal epithelium integrity, modulating gut microbiota composition and regulating gut immune responses. As a result, our findings suggested that DHA-PL and EPA-PL could be used as functional food ingredients for the prevention of stress induced intestinal dysfunction.Abbreviations
| DHA | Docosahexaenoic acid |
| DHA-EE | Docosahexaenoic acid-ethyl ester |
| DHA-PL | Docosahexaenoic acid-phospholipids |
| DHA-TG | Docosahexaenoic acid-triglycerides |
| EPA | Eicosatetraenoic acid |
| EPA-EE | Eicosatetraenoic acid-ethyl ester |
| EPA-PL | Eicosatetraenoic acid-phospholipids |
| EPA-TG | Eicosatetraenoic acid-triglycerides |
| GPR120 | G protein-coupled receptor 120 |
| LPS | Lipopolysaccharide |
| n-3 PUFA | n-3 polyunsaturated fatty acid |
| NF-κB | Nuclear transcription factor κB |
| SCFAs | Short-chain fatty acids |
| TAK1 | TGF-β activated kinase 1 |
| TLR4 | Toll-like receptor 4 |
| ZO-1 | Zonula occludens-1 |
Conflicts of interest
There are no conflicts to declare.Acknowledgements
This study was supported by the National Natural Science Foundation of China (U1606403-5 and 31330060).References
- Y. Couch, A. Trofimov, N. Markova, V. Nikolenko, H. W. Steinbusch, V. Chekhonin, C. Schroeter, K. P. Lesch, D. C. Anthony and T. Strekalova, J. Neuroinflammation, 2016, 13(1), 108 CrossRef PubMed.
- Y. S. Mineur, C. Belzung and W. E. Crusio, Behav. Brain Res., 2006, 175(1), 43–50 CrossRef PubMed.
- M. E. de Sousa Rodrigues, M. Bekhbat, M. C. Houser, J. Chang, D. I. Walker, D. P. Jones, C. M. P. Oller do Nascimentoc, C. J. Barnuma and M. G. Tansey, Brain, Behav., Immun., 2017, 59, 158–172 CrossRef CAS PubMed.
- M. Vicario, M. Guilarte, C. Alonso, P. Yang, C. Martínez, L. Ramos, B. Loboa, A. González, M. Guilà, M. Pigrau, E. Saperas, F. Azpiroza and J. Santos, Brain, Behav., Immun., 2010, 24(7), 1166–1175 CrossRef CAS PubMed.
- S. E. Lakhan and A. Kirchgessner, Nutr. Metab., 2010, 7(1), 79 CrossRef PubMed.
- X. Dai and B. Wang, Gastroenterol. Res. Pract., 2015, 6, 287348 Search PubMed.
- J. Luettig, R. Rosenthal, C. Barmeyer and J. D. Schulzke, Tissue Barriers, 2015, 3(1–2), e977176 CrossRef CAS PubMed.
- R. Martin, A. Nauta, K. Ben Amor, L. Knippels, J. Knol and J. Garssen, Benefic. Microbes, 2010, 1(4), 367–382 CrossRef CAS PubMed.
- R. Daneman and M. Rescigno, Immunity, 2009, 31(5), 722–735 CrossRef CAS PubMed.
- J. D. Soderholm and M. H. Perdue II., Am. J. Physiol.: Gastrointest. Liver Physiol., 2001, 280(1), G7–G13 CrossRef CAS PubMed.
- M. Maes and J. C. Leunis, Neuroendocrinol. Lett., 2008, 29(6), 902 Search PubMed.
- J. P. Fang, Y. Liu, J. Li, W. F. Liao, Y. H. Hu and K. Ding, Acta Pharmacol. Sin., 2012, 33(9), 1204 CrossRef CAS PubMed.
- W. Wang, T. Xia and X. Yu, Inflammation Res., 2015, 64(6), 423–431 CrossRef CAS PubMed.
- C. J. Barnum, T. W. Pace, F. Hu, G. N. Neigh and M. G. Tansey, J. Neuroinflammation, 2012, 9(1), 9 Search PubMed.
- A. M. Espinosa-Oliva, R. M. De Pablos, R. F. Villarán, S. Argüelles, J. L. Venero, A. Machado and J. Cano, Neurobiol. Aging, 2011, 32(1), 85–102 CrossRef CAS PubMed.
- M. Zareie, K. Johnson-Henry, J. Jury, P. C. Yang, B. Y. Ngan, D. M. McKay, J. D. Soderholm, M. H. Perdue and P. M. Sherman, Gut, 2006, 55(11), 1553–1560 CrossRef CAS PubMed.
- S. Y. Zhou, M. Gillilland, X. Wu, P. Leelasinjaroen, G. Zhang, H. Zhou, B. Ye, Y. Lu and C. Owyang, J. Clin. Invest., 2018, 128(1), 267–280 CrossRef PubMed.
- P. C. Calder, Mol. Cell Biol. Lipids, 2015, 1851(4), 469–484 CrossRef CAS PubMed.
- J. Zhao, P. Shi, Y. Sun, J. Sun, J. N. Dong, H. G. Wang, L. G. Zuo, J. F. Gong, Y. Li, L. L. Gu, N. Li, J. S. Li, W. M. Zhu and N. Li, Br. J. Nutr., 2015, 114(2), 181–188 CrossRef CAS PubMed.
- M. Wen, J. Xu, L. Ding, L. Zhang, L. Du, J. Wang, Y. Wang and C. Xue, J. Funct. Foods, 2016, 24, 537–548 CrossRef CAS.
- M. M. Zhou, L. Ding, M. Wen, H. X. Che, J. Q. Huang, T. T. Zhang, C. Xue, X. Mao and Y. M. Wang, J. Nutr. Biochem., 2018, 59, 64–75 CrossRef CAS PubMed.
- N. Ding, Y. Xue, X. Tang, Z. M. Sun, T. Yanagita and C. H. Xue, J. Oleo Sci., 2013, 62(11), 883–891 CrossRef CAS PubMed.
- L. Du, Y. H. Yang, Y. M. Wang, C. H. Xue, H. Kurihara and K. Takahashi, Food Funct., 2015, 6(12), 3652–3662 RSC.
- X. Liu, J. Cui, Z. Li, J. Xu, J. Wang, C. Xue and Y. Wang, Eur. J. Lipid Sci. Technol., 2014, 116(3), 255–265 CrossRef CAS.
- L. Zhang, D. Wang, M. Wen, L. Du, C. Xue, J. Wang, J. Xu and Y. Wang, J. Funct. Foods, 2017, 28, 28–35 CrossRef CAS.
- F. Liu, N. Zhang, Z. Li, X. Wang, H. Shi, C. Xue, R. W. Li and Q. Tang, Sci. Rep., 2017, 7(1), 6783 CrossRef.
- V. Greco, G. Lauro, A. Fabbrini and A. Torsoli, Gut, 1967, 8(5), 491 CrossRef CAS.
- H. Shi, Y. Chang, Y. Gao, X. Wang, X. Chen, Y. Wang, C. Xue and Q. Tang, Food Funct., 2017, 8(9), 3383–3393 RSC.
- N. Zhang, X. Mao, R. W. Li, E. Hou, Y. Wang, C. Xue and Q. Tang, Mol. Nutr. Food Res., 2017, 61(8), 1600585 CrossRef.
- A. Croswell, E. Amir, P. Teggatz, M. Barman and N. H. Salzman, Infect. Immun., 2009, 77(7), 2741–2753 CrossRef CAS.
- A. M. Neyrinck, S. Possemiers, W. Verstraete, F. De Backer, P. D. Cani and N. M. Delzenne, J. Nutr. Biochem., 2012, 23(1), 51–59 CrossRef CAS PubMed.
- L. A. David, C. F. Maurice, R. N. Carmody, D. B. Gootenberg, J. E. Button, B. E. Wolfe, A. V. Ling, A. S. Devlin, Y. Varma, M. A. Fischbach, S. B. Biddinger, R. J. Dutton and P. J. Turnbaugh, Nature, 2014, 505(7484), 559 CrossRef CAS PubMed.
- C. J. Roberts, I. C. Campbell and N. Troop, Eur. Eat. Disord. Rev., 2014, 22(1), 77–82 CrossRef PubMed.
- Y. M. Lai Ulrich, S. Fulton, M. Wilson, G. Petrovich and L. Rinaman, Stress, 2015, 18(4), 381–399 Search PubMed.
- P. Cani, Clin. Microbiol. Infect., 2012, 18, 50–53 CrossRef CAS.
- G. Morris, M. Berk, A. Carvalho, J. R. Caso, Y. Sanz, K. Walder and M. Maes, Mol. Neurobiol., 2017, 54(6), 4432–4451 CrossRef CAS.
- M. Levy, E. Blacher and E. Elinav, Curr. Opin. Microbiol., 2017, 35, 8–15 CrossRef CAS.
- T. Murakami, K. Kamada, K. Mizushima, Y. Higashimura, K. Katada, K. Uchiyama, K. Uchiyama, O. Handa, T. Takagi, Y. Naito and Y. Itoh, Digestion, 2017, 95(1), 55–60 CAS.
- M. Ida, A. Nishida, H. Akiho, Y. Nakashima, K. Matsueda and S. Fukudo, BioPsychoSoc. Med., 2017, 11(1), 8 CrossRef.
- M. H. Kazi, J. Aoun, P. Sarkar, T. Saha, H. Koley, V. M. Rajendran and S. Dutta, Gastroenterology, 2018, 154(6), S-53 CrossRef.
- H. Cao, X. Liu, Y. An, G. Zhou, Y. Liu, M. Xu, W. Dong, S. Wang, F. Yan, K. Jiang and B. Wang, Sci. Rep., 2017, 7(1), 10322 CrossRef PubMed.
- R. Mennigen, Am. J. Physiol.: Gastrointest. Liver Physiol., 2009, 296, G1140–G1149 CrossRef CAS PubMed.
- K. Dokladny, M. N. Zuhl and P. L. Moseley, J. Appl. Physiol., 2015, 120(6), 692–701 CrossRef.
- J. R. Kelly, P. J. Kennedy, J. F. Cryan, T. G. Dinan, G. Clarke and N. P. Hyland, Front. Cell. Neurosci., 2015, 9, 392 Search PubMed.
- P. Beguin, A. Errachid, Y. Larondelle and Y. J. Schneider, Food Funct., 2013, 4(6), 923–931 RSC.
- G. Clarke, E. M. Quigley, J. F. Cryan and T. G. Dinan, Trends Mol. Med., 2009, 15, 478–489 CrossRef CAS PubMed.
- D. Xu, J. Gao, M. Gillilland, X. Wu, I. Song, J. Y. Kao and C. Owyang, Gastroenterology, 2014, 146(2), 484–496 CrossRef CAS.
- B. M. Buchholz and A. J. Bauer, Neurogastroenterol. Motil., 2010, 22(3), 232–245 CrossRef CAS PubMed.
- S. Lee, H. J. Kim, K. C. Chang, J. C. Baek, J. K. Park, J. K. Shin, J. K. Shin, W. J. Choi, J. H. Lee and W. Y. Paik, Korean J. Physiol. Pharmacol., 2009, 13(4), 301–307 CrossRef CAS PubMed.
- S. Talukdar, E. J. Bae, T. Imamura, H. Morinaga, W. Fan, P. Li, W. J. Lu, S. M. Watkins and J. M. Olefsky, Cell, 2010, 142(5), 687–698 CrossRef PubMed.
- C. Ferreira, A. Vieira, M. Vinolo, F. Oliveira, R. Curi and F. Martins, J. Immunol. Res., 2014, 1–12 Search PubMed.
- A. Burokas, S. Arboleya, R. D. Moloney, V. L. Peterson, K. Murphy, G. Clarke, C. Stantonad, T. G. Dinana and J. F. Cryan, Biol. Psychiatry, 2017, 82(7), 472–487 CrossRef CAS.
- C. Chassard, M. Dapoigny, K. P. Scott, L. Crouzet, C. Del'Homme and P. Marquet, Aliment. Pharmacol. Ther., 2012, 35(7), 828–838 CrossRef CAS.
- J. M. Si, Y. C. Yu, Y. J. Fan and S. J. Chen, World J. Gastroenterol., 2004, 10, 1802–1805 CrossRef.
- C. H. Choi and S. K. Chang, J. Neurogastroenterol. Motil., 2015, 21(1), 4–7 CrossRef PubMed.
- R. Anderson, A. L. Cookson and W. C. McNabb, BMC Microbio.l, 2010, 10, 316 CrossRef CAS PubMed.
- C. Hsieh, T. Osaka, E. Moriyama, Y. Date, J. Kikuchi and S. Tsuneda, Physiol. Rep., 2015, 3, e12327 CrossRef PubMed.
- A. Fasano and T. Shea-Donohue, Nat. Clin. Pract. Gastroenterol. Hepatol., 2005, 2(9), 416–422 CrossRef CAS PubMed.
- P. A. Ruiz, M. Hoffmann, S. Szcesny, M. Blaut and D. Haller, Immunology, 2005, 115, 441–450 CrossRef CAS PubMed.
- S. Matsumoto, T. Hara, T. Hori, K. Mitsuyama, M. Nagaoka, N. Tomiyasu, A. Suzuki and M. Sata, Clin. Exp. Immunol., 2005, 140(3), 417–426 CrossRef CAS PubMed.
- M. T. Bailey, Adv. Exp. Med. Biol., 2014, 817, 255–276 CrossRef CAS PubMed.
- S. K. Mazmanian, C. H. Liu, A. O. Tzianabos and D. L. Kasper, Cell, 2005, 122, 107–118 CrossRef CAS PubMed.
- M. P. Barnett, W. C. McNabb, A. L. Cookson, S. Zhu, M. Davy, B. Knoch, K. Nones, A. J. Hodgkinson and N. C. Roy, BMC Immunol., 2010, 11(1), 39 CrossRef PubMed.
- L. P. Nedialkova, R. Denzler, M. B. Koeppel, M. Diehl, D. Ring, T. Wille, R. G. Gerlach and B. Stecher, PLoS Pathog., 2014, 10(1), e1003844 CrossRef PubMed.
- J. Wan, S. Hu, J. J. Jacoby, J. Liu, Y. Zhang and L. L. Yu, Food Funct., 2017, 8(5), 1793–1802 RSC.
- B. Fotschki, J. Juśkiewicz, A. Jurgoński, K. Kołodziejczyk, J. Milala, M. Kosmala and Z. Zduńczyk, PLoS One, 2016, 11(2), e0149081 CrossRef.
- P. Zhuang, W. Wang, Y. Zhang and J. Jiao, FASEB J., 2017, 31, 971–911 Search PubMed.
- M. H. Kim, S. G. Kang, J. H. Park, M. Yanagisawa and C. H. Kim, Gastroenterology, 2013, 145(2), 396–406 CrossRef CAS PubMed.
- J. M. Larsson, H. Karlsson, J. G. Crespo, M. E. Johansson, L. Eklund, H. Sjövall and G. C. Hansson, Inflammatory Bowel Dis., 2011, 17, 2299–2307 CrossRef PubMed.
- D. A. Padgett and R. Glaser, Trends Immunol., 2003, 24(8), 444–448 CrossRef CAS PubMed.
- S. Z. Hasnain, S. Tauro, I. Das, H. Tong, A. C. H. Chen, P. L. Jeffery, V. McDonald, T. H. Florin and M. A. McGuckin, Gastroenterology, 2013, 144(2), 357–368 CrossRef CAS PubMed.
- M. Awada, A. Meynier, C. O. Soulage and L. Hadji, Nutr. Metab., 2013, 10, 23 CrossRef CAS PubMed.
- N. F. Vigerust, B. Bjorndal, P. Bohov and T. Brattelid, Eur. J. Nutr., 2013, 52, 1315–1325 CrossRef CAS PubMed.
- M. Rossmeisl, Z. M. Jilkova, O. Kuda and T. Jelenik, PLoS One, 2012, 7, e38834 CrossRef CAS PubMed.
- M. Cansell, F. Nacka and N. Combe, Lipids, 2003, 38, 551–559 CrossRef CAS.
- L. Burri, K. Berge, K. Wibrand, R. K. Berge and J. L. Barger, Front. Genet., 2011, 2, 45 Search PubMed.
Footnotes |
| † Electronic supplementary information (ESI) available. See DOI: 10.1039/c8fo01404c |
| ‡ These authors contributed equally to this work. |
| This journal is © The Royal Society of Chemistry 2019 |


