Simultaneous extraction and enrichment of polyphenol and lutein from marigold (Tagetes erecta L.) flower by an enzyme-assisted ethanol/ammonium sulfate system
Xiao-Qian
Fu
,
Gen-Lin
Zhang
,
Long
Deng
and
Yan-Yan
Dang
 *
*
Key Laboratory for Green Processing of Chemical Engineering of Xinjiang Bingtuan, School of Chemistry and Chemical Engineering, Shihezi University, Shihezi 832003, P. R. China. E-mail: dyyshz@126.com; Tel: +86-13899503393
First published on 4th December 2018
Abstract
Enzyme-assisted aqueous two-phase extraction (EA-ATPE) using ethanol/ammonium sulfate system was investigated for total polyphenol (TP) and lutein from marigold flowers. The important factors were investigated by single factor experiment and response surface methodology combined with Box–Behnken design to optimize the operating parameters of EA-ATPE. The maximum yields of TP and lutein were 83.56 ± 0.69 mg g−1 and 5.59 ± 0.13 mg g−1, respectively. Compared with aqueous two-phase extraction and Soxhlet extraction (SE), the extraction yield of TP by EA-ATPE is 64.91% higher and the extract of EA-ATPE has better antioxidant activity. The pretreatment effect was also researched by scanning electron microscopy. Thus, EA-ATPE is an efficient method for extracting bioactive components from plants.
1. Introduction
Marigold (Tagetes erecta L.) is an annual herbaceous plant native to Mexico, where it is used in folk medicine.1 Marigold meal and extracts are the most widely accepted products among the natural pigments.2 The marigold flower is one of the richest natural sources of total polyphenol (TP) and lutein, whose health-benefiting functions are increasingly being recognized.3 They have been applied as excellent antioxidants in nutritional, cosmetic and pharmaceutical industries.4 TP exerts antioxidative, antibacterial, antidiabetic, anti-obesity, anti-inflammatory,5 cardioprotective, cancer chemopreventive and neuroprotective properties.6 Lutein is used as a feed additive to brighten the colors of poultry feathers and deepen the yellow color of egg yolk and also to add flavor and color to foods.7 It is reported in the literature that the risk of chronic disease, such as heart disease, cancer and age-related eye diseases, might be significantly reduced by diets rich in lutein.4 There have been previous studies on TP and lutein reporting their beneficial effects on human health.8–10In previous studies, various methods have been used to extract polyphenol or lutein from natural products, such as conventional solid–liquid extraction, ultrasound-assisted extraction, liquid pressurization, and use of supercritical fluids.11–13 However, these extraction methods show some limitations and disadvantages, such as lower extraction efficiency. It is well known that polyphenols extracted from plants have strong physiological activity. However, much work has not been focused on the simultaneous extraction of lutein and TP from marigold flowers.
Enzyme-assisted extraction (EAE) technology has been commonly used in the extraction of effective ingredients from natural products in recent years owing to a number of advantages, such as high efficiency, environmentally friendly nature and ease of operation.14 Lin et al.15 extracted 96.6% of the total lipids by EAE from a culture of the oleaginous yeast Rhodosporidium toruloides. Camargo et al.16 increased the ratio of soluble to insoluble-bound phenolics using pronase and viscozyme from winemaking by-products in EAE. In recent years, aqueous two-phase extraction (ATPE) has been employed as a new type of extraction and separation technology, which has aroused increasing attention from majority of scholars due to its biphasic extraction capacity and selectivity.17,18 ATPE is a very promising approach for the separation, pretreatment, and purification of mixtures of biomolecules and hydrophilic substances.17,19 There are many literature reports where ethanol/ammonium sulfate system was chosen for the aqueous two-phase system (ATPS) due to its fine partitioning and recycling behaviors.13,20,21 In our study, ethanol/ammonium was chosen as the aqueous two-phase system. Enzyme-assisted aqueous two-phase extraction (EA-ATPE) was used to simultaneously extract and enrich lutein and polyphenols from marigold flowers based on the high efficiency and wall-breaking effects of EAE and the advantages of ATPE, which allow target constituents to be extracted into the top phase and impurities into the bottom phase. It is also a more efficient and environmentally friendly extraction method, which may be a prospective alternative to extract TP and lutein from marigold flowers and an effective and promising method for extracting bioactive components from plants.
2. Materials and methods
2.1 Materials and reagents
Fresh marigold flowers were picked in September 2017 from Corps Fifth Division 58 Regiment in Xinjiang Province and dried at room temperature in the dark (moisture content of marigold flower was 6.39%). Subsequently, a universal high speed pulverizer was used to grind them into powder and a 120 mesh-grid was used to obtain particles of similar size, which were then stored in a freezer at −20 °C. Cellulase (50 U mg−1) and Folin–Ciocalteu's phenol reagent were procured from Xiya Chemical Industry Co., Ltd (Shandong, China). Pectinase (30 U mg−1) was purchased from Macklin Biochemical Co., Ltd (Shanghai, China). Standard lutein was procured from ChromaDex Co., Ltd (USA). Gallic acid standard, 1,1′-diphenyl-2-picrylhydrazyl (DPPH) free radical, and 2,2′-azinobis (3-ethylbenzothiazoline-6-sulfonic acid ammonium salt) (ABTS) radical were bought from Aladdin Co., Ltd (Shanghai, China).2.2 EA-ATPE procedures
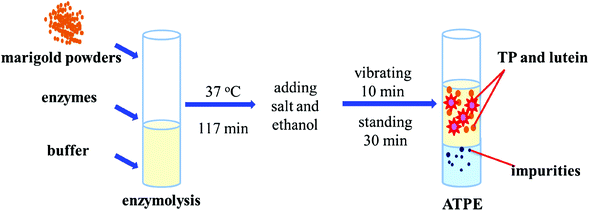
A total of 0.22 g marigold flower powder, 4.0 g disodium hydrogen phosphate-citric acid buffer solution and 1.40% (w/w) enzyme were first added to a 10 mL graduated test tube, mixed evenly by a vortex mixer and placed in a water bath at 40 °C for 120 min. Then, ammonium sulfate and ethanol were added into the enzymatic slurry and vibrated for 10 min using a vortex mixer to dissolve the salt completely. Then, the solution was left undisturbed at room temperature for 30 min to form ATPS. Finally, the mixture was centrifuged at 8000 rpm for 5 min to facilitate phase separation and the volumes of the upper and bottom phases of system were recorded after phase separation completed; then, the yields of TP and lutein were determined. The yield (Y) and recovery (R) of TP and lutein are regarded as the indices of extraction abilities. The parameters were defined according to eqn (1) and (2).20,22 A schematic of the apparatus of EA-ATPE is shown in Fig. 1. | (1) |
 | (2) |
2.3 Determination of TP and lutein contents
The contents of TP and lutein in the extracts of marigold flower were determined by Folin–Ciocalteu method and HPLC analysis,23 respectively.2.4 Experimental design
According to the results of single-factor experiments, a three-factor and three-level orthogonal test (Table 1) was designed by response surface methodology, which was performed using Design-Expert Software (V8.0.6) to optimize the methods of extraction of TP and lutein from marigold flowers by EA-ATPE; three replications at the cent point were applied.| Factor | Name | Units | Coded factors | ||
|---|---|---|---|---|---|
| −1 | 0 | 1 | |||
| A | Concentration of enzymes | U g−1 | 3.0 | 4.5 | 6.0 |
| B | Enzymolysis temperature | °C | 35 | 40 | 45 |
| C | Enzymolysis time | min | 90 | 120 | 150 |
2.5 Surface morphology of marigold flower powder
The surface morphologies of marigold flower powders (before and after extraction) were observed using a scanning electron microscope (SEM, Sigma 300, Carl Zeiss Jena, Germany) at different magnifications.2.6 Antioxidant properties of marigold flower extracts
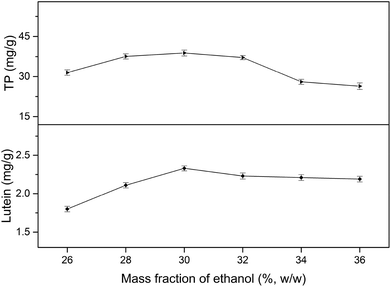
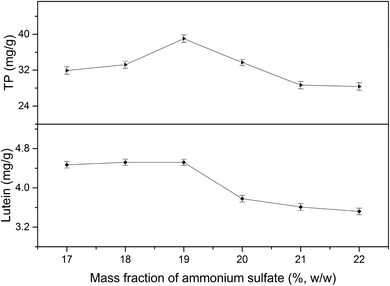
The antioxidant property of extracts by EA-ATPE from marigold flowers was compared with that of extracts from ATPE and SE. All conditions used for extraction of TP and lutein by EA-ATPE were their corresponding optimal conditions. The conditions for ATPE were 30% (w/w) ethanol/19% (w/w) ammonium sulfate, 0.22 g marigold flower powders added to ATPS, and then standing at room temperature for 30 min. The conditions for SE processes were as follows: 1.00 g marigold flower powders and 80 mL ethanol added to the Soxhlet extractor and placed in water bath for 8 h at a constant temperature of 95 °C.2.7 Statistical analysis
All experiments were performed in triplicate and the results were expressed as the mean ± standard deviation (SD) of three determinations.3. Results and discussion
3.1 Effect of phase composition on the yields of TP and lutein in EA-ATPE
3.2 Single-factor experiments analysis
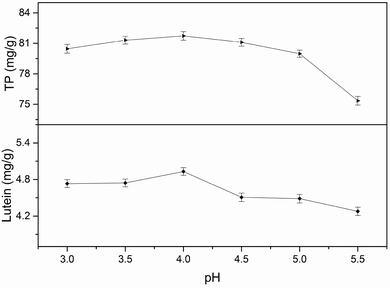
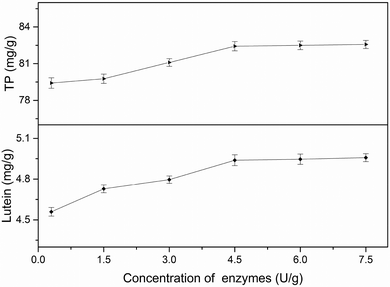
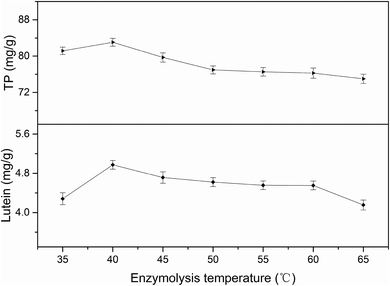
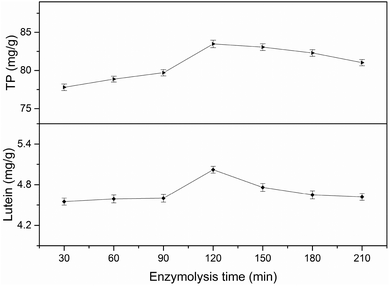
All factors affecting the process must be carefully detected and examined. Thus, it is necessary to conduct single factor experiments. In this study, five major influencing factors were investigated for the subsequent experiments and the results are discussed in the following sections.3.3 Model fitting and response surface analyzing
The important parameters of EA-ATPE were optimized by single-factor experiments, and the Box–Behnken Design combined with response surface methodology was used to analyze the interaction between parameters. The single-factor experiments results indicated that concentration of enzymes, enzymolysis temperature and enzymolysis time have greater impacts on the yields of TP and lutein, so we chose these three single factors to do the response surface experiments that can further examine the interactions between these factors. In this study, a total of 17 experimental runs were employed in a randomized order. The Box–Behnken design (BBD) and response surface methodology results are presented in Table 2.| Run | A | B | C | R1-Y-TP (mg g−1) | R2-Y-Lutein (mg g−1) |
|---|---|---|---|---|---|
| a Mean of triplicate determination. b Standard deviation (SD) of three determinations. | |||||
| 1 | 1.00 | −1.00 | 0.00 | 77.28a ± 0.15b | 5.26a ± 0.05b |
| 2 | −1.00 | 0.00 | 1.00 | 72.21a ± 0.19b | 4.40a ± 0.02b |
| 3 | −1.00 | 1.00 | 0.00 | 72.51a ± 0.09b | 4.31a ± 0.01b |
| 4 | 0.00 | −1.00 | 1.00 | 72.53a ± 0.23b | 4.42a ± 0.03b |
| 5 | −1.00 | −1.00 | 0.00 | 77.34a ± 0.08b | 5.02a ± 0.09b |
| 6 | 1.00 | 0.00 | 1.00 | 81.26a ± 0.31b | 5.41a ± 0.12b |
| 7 | 0.00 | 0.00 | 0.00 | 82.71a ± 0.25b | 5.45a ± 0.04b |
| 8 | 1.00 | 1.00 | 0.00 | 79.09a ± 0.23b | 5.35a ± 0.06b |
| 9 | 0.00 | 0.00 | 0.00 | 83.71a ± 0.16b | 5.66a ± 0.03b |
| 10 | 0.00 | 0.00 | 0.00 | 83.50a ± 0.16b | 5.66a ± 0.15b |
| 11 | 0.00 | 0.00 | 0.00 | 83.06a ± 0.20b | 5.70a ± 0.08b |
| 12 | 0.00 | 1.00 | 1.00 | 77.94a ± 0.05b | 5.02a ± 0.01b |
| 13 | 0.00 | 0.00 | 0.00 | 81.81a ± 0.12b | 5.67a ± 0.04b |
| 14 | 1.00 | 0.00 | −1.00 | 74.57a ± 0.04b | 4.89a ± 0.07b |
| 15 | 0.00 | 1.00 | −1.00 | 75.32a ± 0.07b | 4.55a ± 0.11b |
| 16 | −1.00 | 0.00 | −1.00 | 82.04a ± 0.07b | 5.41a ± 0.03b |
| 17 | 0.00 | −1.00 | −1.00 | 83.02a ± 0.13b | 5.69a ± 0.01b |
where Y is the yield of TP, A is concentration of enzymes (U g−1), B is enzymolysis temperature (°C) and C is enzymolysis time (min).
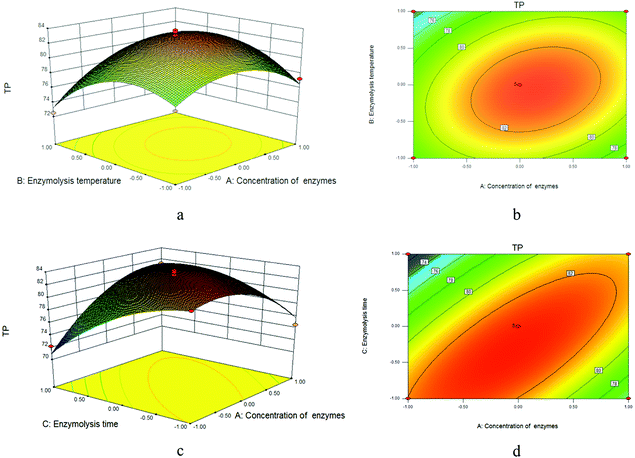
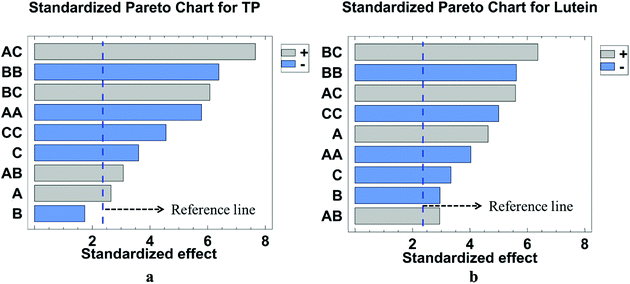
Regression coefficient P values for each investigated response and analysis of variance (ANOVA) results are presented in Table 3. It can be observed that the value of R2 was 0.9710, which indicated that the response and independent variables are well correlated. The lack-of-fit for TP with high p-value of 0.1295 (P > 0.05) was not significant and further confirmed that the model was suitable to use to predict the responses. The corresponding three-dimensional response surfaces and contour plots are shown in Fig. 9. Response surface 3D plots can illustrate the effects of independent variables and their interactions. The shape of the contour plots describes whether the mutual interactions between independent variables are significant. An elliptical contour plot illustrates that the interactions between independent variables are significant.14 Therefore, among the contour plots, it can be easily seen that C, AC, BC, A2, B2, and C2 have highly significant effects with all the factors, A and AB showed significant effect, and the effect of B was not significant.
| Source | Sum of squares | df | Mean square | F-Value | p-Value Prob > F |
|---|---|---|---|---|---|
| *p < 0.05 significant; **p < 0.01 highly significant; df, degree of freedom. | |||||
| Model | 272.38 | 9 | 30.26 | 26.00 | 0.0001** |
| A-Concentration of enzymes | 8.16 | 1 | 8.16 | 7.01 | 0.0330* |
| B-Enzymolysis temperature | 3.52 | 1 | 3.52 | 3.02 | 0.1256 |
| C-Enzymolysis time | 15.13 | 1 | 15.13 | 13.00 | 0.0087** |
| AB | 11.02 | 1 | 11.02 | 9.47 | 0.0179* |
| AC | 68.19 | 1 | 68.19 | 58.59 | 0.0001** |
| BC | 43.00 | 1 | 43.00 | 36.94 | 0.0005** |
| A 2 | 38.99 | 1 | 38.99 | 33.50 | 0.0007** |
| B 2 | 47.51 | 1 | 47.51 | 40.82 | 0.0004** |
| C 2 | 24.16 | 1 | 24.16 | 20.76 | 0.0026** |
| Residual | 8.15 | 7 | 1.16 | ||
| Lack of fit | 5.89 | 3 | 1.96 | 3.49 | 0.1295 |
| Pure error | 2.25 | 4 | 0.56 | ||
| Cor total | 280.52 | 16 | |||
where Y is the yield of lutein, A is concentration of enzymes (U g−1), B is enzymolysis temperature (°C) and C is enzymolysis time (min).
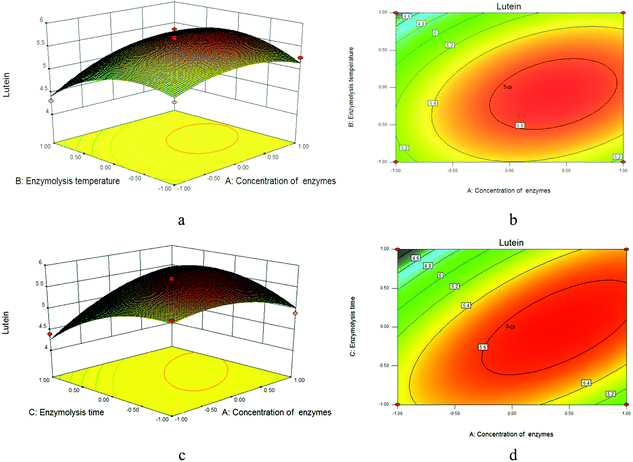
A summary of the analysis of variance (ANOVA) for the response surface quadratic model is shown in Table 4. The high model F-value and low P-value indicate the level of confidence of the selected model.28 The results of ANOVA show the model F-values of 22.58 and lower P-values (P < 0.0001), implying that the model is highly significant. In order to evaluate the effectiveness and adaptability of the model, the determination coefficient (R2) was calculated,27 and the value of R2 was 0.9667, which indicated that the response model could explain 96.67% of the total variation. At the same time, the lack-of-fit statistic, which was used to test the precision of the model, indicated that the p-value for yield of lutein (0.1582) was not significant relative to the pure error. No abnormality was obtained from the analysis of the residue. Thus, it could be concluded that the model is statistically sound.29 The corresponding three-dimensional response surfaces and contour plots are shown in Fig. 10. Each figure shows the effects of two factors at a time on the lutein yield while all other factors were kept at zero level.28 The shapes of response surface and contour plot indicated the nature and extent of interaction between different variables.29 Amongst all the factors, A, AC, BC, A2, B2, and C2 showed highly significant effects, while B, C and AB showed significant effects.
| Source | Sum of squares | df | Mean square | F-Value | p-Value Prob > F |
|---|---|---|---|---|---|
| *p < 0.05 significant; **p < 0.01 highly significant; df, degree of freedom. | |||||
| Model | 3.78 | 9 | 0.42 | 22.58 | 0.0002** |
| A-Concentration of enzymes | 0.40 | 1 | 0.40 | 21.50 | 0.0024** |
| B-Enzymolysis temperature | 0.16 | 1 | 0.16 | 8.75 | 0.0212* |
| C-Enzymolysis time | 0.21 | 1 | 0.21 | 11.17 | 0.0124* |
| AB | 0.16 | 1 | 0.16 | 8.69 | 0.0215* |
| AC | 0.58 | 1 | 0.58 | 31.25 | 0.0008** |
| BC | 0.75 | 1 | 0.75 | 40.56 | 0.0004** |
| A 2 | 0.30 | 1 | 0.30 | 16.28 | 0.0050** |
| B 2 | 0.59 | 1 | 0.59 | 31.60 | 0.0008** |
| C 2 | 0.47 | 1 | 0.47 | 25.03 | 0.0016** |
| Residual | 0.13 | 7 | 0.019 | ||
| Lack of fit | 0.090 | 3 | 0.030 | 3.00 | 0.1582 |
| Pure error | 0.040 | 4 | 0.010 | ||
| Cor total | 3.91 | 16 | |||
3.4 SEM analysis
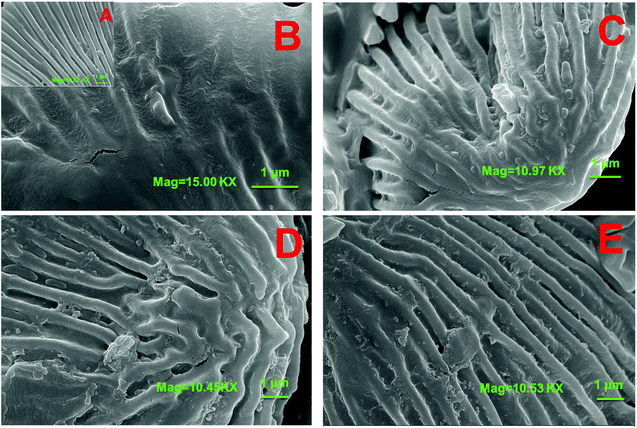
The surface morphologies of marigold flower powders before and after extraction were observed using SEM. As shown in Fig. 12A, the surface of marigold flower powders is relatively smooth and some starch granules have been broken and are present on the tissue of marigold flower powders. Drying, grinding, and extraction caused fractures in the parenchyma cell wall, thus scattering starch granules all over the tissue.30 After being extracted by SE, the surface of the marigold flower powders is still relatively smooth and a few cracks are observed in the tissues (Fig. 12B). A few cracks are also observed in the powder shown in Fig. 12C, and a considerable amount of starch granules are present on the tissue of marigold flower powders, some of which have been broken. The effects of ammonium sulfate salt in the aqueous phase may aid the rupture of raw material cells. Thus, the fracture of raw materials after ATPE treatment was more evident than that after SE treatment. In addition, the surface of raw materials from SE was relatively smooth and furrows were relatively shallow due to water scarcity in the tissue.23 Cellulose, hemicellulose and pectin are the three major polysaccharides that make up the primary, secondary and middle lamella of the cell walls of plant parts.31 From the SEM micrographs (Fig. 12D and E), it is very evident that the enzyme treatment resulted in rupture of the starch granules, and relatively deep gullies in cell walls were observed due to the loss of tissue water. Thus, the destruction of cell wall components by the enzymes could have facilitated higher extraction efficiency.32 However, the powder shown in Fig. 12E shows more starch granule ruptures and deeper gully than that shown in Fig. 12D, which proves that pectinase has better enzymatic treatment effect on marigold flower than cellulase. Thus, EA-ATPE may be a promising technique for extracting bioactive components from plants.The whole procedure consists of two parts. The first part is the enzymolysis procedure in which the marigold flower powders were hydrolyzed using pectinase, whose action mode is to hydrolytically cleave the polygalacturonic acid chain, resulting in the rupture of the cell walls of marigold flower. Therefore, intracellular components can be released into the hydrolysate. Additionally, the salt in the two aqueous phase systems has good phase separation ability, which enriches polyphenol and lutein in the ethanol-rich upper phase.
3.5 Antioxidant properties of marigold flower extracts
The antioxidant properties of marigold flower extracts were determined using the DPPH and ABTS methods (Table 5). Lower IC50 value signified better free radical scavenging activity, and the IC50 of DPPH and ABTS of EA-ATPE were determined to be 49.16 μg mL−1 and 45.97 μg mL−1, respectively, which were the lowest among the aforementioned methods. Phrutivorapongkul et al.33 used ethanol to extract phenolics from marigold flower and the yield was 17.78 mg g−1. Its antioxidant activity was determined by DPPH method and the IC50 value was 71.09 μg mL−1. It can be seen that EA-ATPE not only improves the yield of the targets, but also maintains the high antioxidant activity of the targets. Although the extraction yield of lutein by SE (8.02 ± 0.34 mg g−1) was the highest among the aforementioned methods, SE resulted in the lowest antioxidant activity. SE has such a high yield of lutein because of the high extraction temperature, but the high temperature easily caused lutein to rapidly degrade.34 Therefore, EA-ATPE represents a promising alternative for the further investigation of extraction and enrichment of bioactive components.| Extraction technology | Y-TP, mg g−1 | Y-lutein, mg g–1 | DPPH (IC50), μg mL−1 | ABTS (IC50), μg mL−1 |
|---|---|---|---|---|
| a Mean of triplicate determination. b Standard deviation (SD) of three determinations. | ||||
| EA-ATPE | 83.56a ± 0.69b | 5.59a ± 0.13b | 49.16a ± 3.19b | 45.97a ± 1.13b |
| ATPE | 67.64a ± 0.43b | 4.30a± 0.25b | 75.31a ± 4.25b | 50.03a ± 1.08b |
| SE | 27.37a ± 0.25b | 8.02a± 0.34b | 89.74a ± 4.72b | 53.99a ± 1.49b |
4. Conclusions
A novel method of simultaneous extraction and enrichment of TP and lutein from marigold flower was developed using EA-ATPE, which was efficient and ecofriendly. The optimal conditions were the use of 30% (w/w) ethanol/19% (w/w) ammonium sulfate, 4.2 U g−1 pectinase, pH 4.00, 37 °C enzymolysis temperature, and 117 min enzymolysis time. Under the optimum conditions, the actual yields of TP and lutein were 83.56 ± 0.69 mg g−1 and 5.59 ± 0.13 mg g−1 and the corresponding recovery rates were 95.45% and 99.81%, respectively. Antioxidant properties and SEM results further indicated that EA-ATPE is a new and highly efficient technique for extraction and separation.Conflicts of interest
There are no conflicts to declare.Acknowledgements
This study was supported by the National Natural Science Foundation of China (grant no. 21266028) and Scientific Research Foundation for Changjiang Scholars of Shihezi University (grant no. CJXZ201501) and Technology Innovation Program of Xinjiang Bingtuan (grant no. 2015AB007).References
- F. DelgadoVargas and O. ParedesLopez, Effects of enzymatic treatments of marigold flowers on lutein isomeric profiles, J. Agric. Food Chem., 1997, 45, 1097–1102 CrossRef CAS.
- S. Wang, L. Zhang, J. Li, J. Cong, F. Gao and G. Zhou, Effects of dietary marigold extract supplementation on growth performance, pigmentation, antioxidant capacity and meat quality in broiler chickens, Asian-Australas. J. Anim. Sci., 2017, 30, 71–77 CrossRef CAS PubMed.
- W. Li, Y. Gao, J. Zhao and Q. Wang, Phenolic, flavonoid, and lutein ester content and antioxidant activity of 11 cultivars of chinese marigold, J. Agric. Food Chem., 2007, 55, 8478–8484 CrossRef CAS PubMed.
- S. Tekwani and P. M. D'Mello, Enzyme assisted extraction of lutein from marigold flowers and its evaluation by HPLC, Int. J. Adv. Pharm. Sci., 2010, 1, 381–386 CAS.
- V. Borutinskaitė, A. Virkšaitė, G. Gudelytė and R. Navakauskienė, Green tea polyphenol EGCG causes anti-cancerous epigenetic modulations in acute promyelocytic leukemia cells, Leuk. Lymphoma, 2017, 1–10 Search PubMed.
- D. K. Gessner, M. Bonarius, E. Most, A. Fiesel and K. Eder, Effects of polyphenol-rich plant products from grape or hop as feed supplements on the expression of inflammatory, antioxidative, cytoprotective and endoplasmic reticulum stress-related genes and the antioxidative status in the liver of piglets, J. Anim. Physiol. Anim. Nutr., 2016, 101, 1–10 Search PubMed.
- J. H. Lin, D. J. Lee and J. S. Chang, Lutein production from biomass: marigold flowers versus microalgae, Bioresour. Technol., 2015, 184, 421–428 CrossRef CAS PubMed.
- C. Castro-Lopez, J. M. Ventura-Sobrevilla, M. D. Gonzalez-Hernandez, R. Rojas, J. A. Ascacio-Valdes, C. N. Aguilar and G. C. G. Martinez-Avila, Impact of extraction techniques on antioxidant capacities and phytochemical composition of polyphenol-rich extracts, Food Chem., 2017, 237, 1139–1148 CrossRef CAS PubMed.
- J. Otaka, S. Seo and M. Nishimura, Lutein, a Natural Carotenoid, Induces α-1,3-Glucan Accumulation on the Cell Wall Surface of Fungal Plant Pathogens, Molecules, 2016, 21, 980–990 CrossRef.
- I. D. Nwachukwu, C. C. Udenigwe and R. E. Aluko, Lutein and zeaxanthin: Production technology, bioavailability, mechanisms of action, visual function, and health claim status, Trends Food Sci. Technol., 2016, 49, 74–84 CrossRef CAS.
- S. Bhattacharyya, S. Datta, B. Mallick, P. Dhar and S. Ghosh, Lutein content and in vitro antioxidant activity of different cultivars of Indian marigold flower (Tagetes patula L.) extracts, J. Agric. Food Chem., 2010, 58, 8259–8264 CrossRef CAS PubMed.
- M. M. Poojary, F. J. Barba, B. Aliakbarian, F. Donsi, G. Pataro, D. A. Dias and P. Juliano, Innovative Alternative Technologies to Extract Carotenoids from Microalgae and Seaweeds, Mar. Drugs, 2016, 14, 214–247 CrossRef PubMed.
- X. J. Xie, D. Zhu, W. Zhang, W. B. Huai, K. Wang, X. W. Huang, L. Zhou and H. J. Fan, Microwave-assisted aqueous two-phase extraction coupled with high performance liquid chromatography for simultaneous extraction and determination of four flavonoids in Crotalaria sessiliflora L., Ind. Crops Prod., 2017, 95, 632–642 CrossRef CAS.
- Y. M. Zhao, J. H. Song, J. Wang, J. M. Yang, Z. B. Wang and Y. H. Liu, Optimization of cellulase-assisted extraction process and antioxidant activities of polysaccharides from Tricholoma mongolicum Imai, J. Sci. Food Agric., 2016, 96, 4484–4491 CrossRef CAS PubMed.
- J. A. Lin, C. H. Kuo, B. Y. Chen, Y. Li, Y. C. Liu, J. H. Chen and C. J. Shieh, A novel enzyme-assisted ultrasonic approach for highly efficient extraction of resveratrol from Polygonum cuspidatum, Ultrason. Sonochem., 2016, 32, 258–264 CrossRef CAS.
- A. C. de Camargo, M. A. Regitano-d'Arce, A. C. Biasoto and F. Shahidi, Enzyme-assisted extraction of phenolics from winemaking by-products: Antioxidant potential and inhibition of alpha-glucosidase and lipase activities, Food Chem., 2016, 212, 395–402 CrossRef.
- Y. K. Yau, C. W. Ooi, E. P. Ng, C. W. Lan, T. C. Ling and P. L. Show, Current applications of different type of aqueous two-phase systems, Bioresour Bioprocess, 2015, 2, 49–61 CrossRef.
- R. R. G. Soares, A. M. Azevedo, J. M. Van Alstine and M. R. Aires-Barros, Partitioning in aqueous two-phase systems: Analysis of strengths, weaknesses, opportunities and threats, Biotechnol. J., 2015, 10, 1158–1169 CrossRef CAS.
- I. A. O. Reis, S. B. Santos, F. D. S. Pereira, C. R. S. Sobral, M. G. Freire, L. S. Freitas, C. M. F. Soares and A. S. Lima, Extraction and Recovery of Rutin from Acerola Waste using Alcohol-Salt-Based Aqueous Two-Phase Systems, Sep. Sci. Technol., 2014, 49, 656–663 CrossRef CAS.
- B. Qin, X. Liu, H. Cui, Y. Ma, Z. Wang and J. Han, Aqueous two-phase assisted by ultrasound for the extraction of anthocyanins from Lycium ruthenicum Murr, Prep. Biochem. Biotechnol., 2017, 47, 881–888 CrossRef CAS.
- Z. Zhang, F. Liu, C. He, Y. Yu and M. Wang, Optimization of Ultrasonic-Assisted Aqueous Two-Phase Extraction of Phloridzin from Malus Micromalus Makino with Ethanol/Ammonia Sulfate System, J. Food Sci., 2017, 82, 2944–2953 CrossRef CAS.
- Y. Y. Dang, H. Zhang and Z. L. Xiu, Microwave-assisted aqueous two-phase extraction of phenolics from grape (Vitis vinifera) seed, J. Chem. Technol. Biotechnol., 2015, 89, 1576–1581 CrossRef.
- X.-Q. Fu, N. Ma, W.-P. Sun and Y.-Y. Dang, Microwave and enzyme co-assisted aqueous two-phase extraction of polyphenol and lutein from marigold (Tagetes erecta L.) flower, Ind. Crops Prod., 2018, 123, 296–302 CrossRef CAS.
- S. Siriamornpun, O. Kaisoon and N. Meeso, Changes in colour, antioxidant activities and carotenoids (lycopene, β-carotene, lutein) of marigold flower (Tagetes erecta L.) resulting from different drying processes, J. Funct. Foods, 2012, 4, 757–766 CrossRef CAS.
- R. Re, N. Pellegrini, A. Proteggente, A. Pannala, M. Yang and C. Rice-Evans, Antioxidant activity applying an improved ABTS radical cation decolorization assay, Free Radicals Biol. Med., 1999, 26, 1231–1237 CrossRef CAS.
- Z. J. Tan, Z. Z. Yang, Y. J. Yi, H. Y. Wang, W. L. Zhou, F. F. Li and C. Y. Wang, Extraction of Oil from Flaxseed (Linum usitatissimum L.) Using Enzyme-Assisted Three-Phase Partitioning, Appl. Biochem. Biotechnol., 2016, 179, 1325–1335 CrossRef CAS.
- B. Wang, T. Meng, H. Ma, Y. Zhang, Y. Li, J. Jin and X. Ye, Mechanism study of dual-frequency ultrasound assisted enzymolysis on rapeseed protein by immobilized Alcalase, Ultrason. Sonochem., 2016, 32, 307–313 CrossRef CAS.
- J. B. Pu, B. H. Xia, Y. J. Hu, H. J. Zhang, J. Chen, J. Zhou, W. Q. Liang and P. Xu, Multi-Optimization of Ultrasonic-Assisted Enzymatic Extraction of Atratylodes macrocephala Polysaccharides and Antioxidants Using Response Surface Methodology and Desirability Function Approach, Molecules, 2015, 20, 22220–22235 CrossRef CAS PubMed.
- L. Q. Ke and H. Y. Chen, Enzymatic-Assisted Microwave Extraction of Total Flavonoids from Bud of Chrysanthemum indicum L. and Evaluation of Biological Activities, Int. J. Food Eng., 2016, 12, 607–613 CAS.
- K. An, D. Zhao, Z. Wang, J. Wu, Y. Xu and G. Xiao, Comparison of different drying methods on Chinese ginger (Zingiber officinale Roscoe): Changes in volatiles, chemical profile, antioxidant properties, and microstructure, Food Chem., 2016, 197(Pt B), 1292–1300 CrossRef CAS PubMed.
- K. H. Caffall and D. Mohnen, The structure, function, and biosynthesis of plant cell wall pectic polysaccharides, Carbohydr. Res., 2009, 344, 1879–1900 CrossRef CAS.
- Z. Y. Cheng, H. Y. Song, X. L. Cao, Q. H. Shen, D. D. Han, F. L. Zhong, H. B. Hu and Y. J. Yang, Simultaneous extraction and purification of polysaccharides from Gentiana scabra Bunge by microwave-assisted ethanol-salt aqueous two-phase system, Ind. Crops Prod., 2017, 102, 75–87 CrossRef CAS.
- A. Phrutivorapongkul, K. Kiattisin, P. Jantrawut, S. Chansakaow, S. Vejabhikul and P. Leelapornpisid, Appraisal of biological activities and identification of phenolic compound of African marigold (Tagetes erecta) flower extract, Pak. J. Pharm. Sci., 2013, 26, 1071–1076 CAS.
- K. Mitri, R. Shegokar, S. Gohla, C. Anselmi and R. H. Muller, Lipid nanocarriers for dermal delivery of lutein: preparation, characterization, stability and performance, Int. J. Pharm., 2011, 414, 267–275 CrossRef CAS PubMed.
| This journal is © The Royal Society of Chemistry 2019 |

![[thin space (1/6-em)]](https://www.rsc.org/images/entities/char_2009.gif) :
: