 Open Access Article
Creative Commons Attribution 3.0 Unported Licence
Insight into catalyst speciation and hydrogen co-evolution during enantioselective formic acid-driven transfer hydrogenation with bifunctional ruthenium complexes from multi-technique operando reaction monitoring†
Daniel B. G.
Berry
 a,
Anna
Codina
b,
Ian
Clegg
b,
Catherine L.
Lyall
 ac,
John P.
Lowe
 ac and
Ulrich
Hintermair
 *acd
*acd
aDepartment of Chemistry, University of Bath, Claverton Down, BA2 7AY Bath, UK
bBruker UK Ltd, Banner Lane, CV4 9GH Coventry, UK. E-mail: u.hintermair@bath.ac.uk
cDynamic Reaction Monitoring Facility, University of Bath, Claverton Down, BA2 7AY Bath, UK
dCentre for Sustainable Chemical Technologies, University of Bath, Claverton Down, BA2 7AY Bath, UK
First published on 11th June 2019
Abstract
Transfer hydrogenation of acetophenone from formic acid/triethylamine mixtures catalysed by the Ikariya–Noyori complex [(mesitylene)RuCl(R,R)-(TsDPEN)] has been investigated using simultaneous high-resolution FlowNMR and FlowUV-Vis spectroscopies coupled with on-line sampling head-space mass spectrometry and chiral high-performance liquid chromatography using an integrated, fully automated recirculating flow setup. In line with previous observations, the combined results show a gradual switch from formic acid dehydrogenation to hydrogen transfer mediated by the same Ru-hydride complex, and point to a Ru-formate species as the major catalyst intermediate. Hydrogen bonding in the formic acid/triethylamine mixture emerges as a sensitive 1H NMR probe for the transfer hydrogenation activity of the system and can be used to locate optimum reaction conditions.
Introduction
Real-time reaction monitoring under realistic conditions is a powerful approach to deciphering the workings of complex and dynamic catalytic systems in solution. Only when the various interactions between the different ingredients of a catalytic mixture can be kinetically correlated with catalyst speciation and product formation do we have a chance to move from empirical optimisation and post-rationalisation to knowledge-based design.1 Amongst the various techniques available for operando reaction monitoring, on-line high resolution FlowNMR spectroscopy has emerged as particularly powerful due to its non-invasive and inherently quantitative nature, wide detection range and high information content.2 Nevertheless, all techniques have their own limitations, so in many cases a combination of complementary techniques allows deeper insights into the reaction than separate use of any one of them.3Selective transfer hydrogenation of prochiral ketones and imines from liquid reductants such as propan-2-ol or formic acid catalysed by bifunctional ruthenium complexes has emerged as a powerful tool for synthesising chiral alcohols and amines under mild conditions.4 The Ikariya–Noyori complexes [(arene)RuCl(TsDPEN)] have proven particularly effective and versatile in this chemistry.5 We have recently revisited the kinetics of hydrogen transfer catalysis of aryl ketones from propan-2-ol using [(mesitylene)RuCl(R,R)-(TsDPEN)] using real-time high resolution 1H FlowNMR, where selective excitation pulse sequences allowed tracking of the key [Ru–H] intermediate during the reaction.6 Correlation of catalyst speciation with product formation kinetics thus showed catalyst deactivation caused by arene decoordination to be independent of competitive base inhibition.6 Here we investigate the same reaction using formic acid/triethylamine mixtures as the reductant, conditions which are sometimes preferred for application due to their tolerating higher substrate loadings and giving higher conversions.7 To gain insight into the multiple interactions occurring in this system we have complemented the solution phase analysis via1H and 13C FlowNMR and UV-vis with on-line HPLC and head-space MS.
Results and discussion
Asymmetric transfer hydrogenation from formic acid has been shown to proceed via a mechanism similar to the original propan-2-ol system,8 except that in this case, the formate complex 3 represents an additional reaction intermediate‡ in the catalytic cycle (Fig. 1).9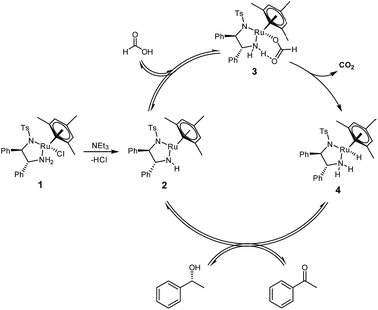 | ||
| Fig. 1 Catalytic cycle for the asymmetric transfer hydrogenation of acetophenone to (R)-1-phenylethanol with [(mesitylene)RuCl(R,R)-(TsDPEN)] 1 using formic acid/triethylamine mixtures. | ||
The oxygen-bound formate moiety in complex 3 is stabilised by an intramolecular hydrogen bond10 with one of the TsDPEN amine protons, as evidenced by characteristic IR and 1H NMR signatures.9 The terminal hydride complex 4 formed from the decarboxylation of 3 is the same as that formed from the reaction of 2 with propan-2-ol, so that virtually identical chemo- and enantioselectivities are obtained with either reductant.4 The elimination of CO2 is thought to make the overall cycle irreversible and thereby allow for higher conversions than the equilibrium-limited propan-2-ol cycle producing acetone as the by-product.7 Reaction rates with formic acid tend to be lower than those with propan-2-ol however, and induction periods are often observed when using FA/NEt3 mixtures.11 Both the length of the induction period and the initial rate of transfer hydrogenation have been found to be a function of pH,12,13 and the FA/base ratio,14 as well as the nature of the base.15 Similar observations have been made for catalytic imine reduction with related [(Cp)Rh(TsDPEN)] complexes in FA/NEt3 mixtures.16,17
In situ spectroscopy of systems evolving gases during the reaction are often bedevilled by bubble formation degrading spectral quality. Quantitative NMR analysis of multiphase mixtures is particularly challenging, although methods for focussing selected peaks in inhomogeneous fields have recently been demonstrated.18 To circumvent the problem in this case, we fitted a back-pressure regulator to the outlet of the circulating flow loop (Fig. 2). This way the pump would maintain a set pressure of 7 bar within the sample volume inside the FlowNMR and FlowUV-vis cells to give a homogeneous liquid phase for the analysis, but continuously release the pressurised aliquots into the reactor at ambient pressure.
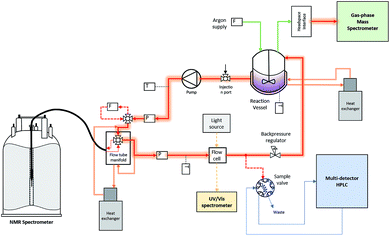 | ||
| Fig. 2 Schematic of the operando analytical recirculating flow setup (for details see the ESI†). | ||
The reactor vessel as well as all transfer lines within the closed flow loop were temperature-controlled, and only the 50 μL aliquots periodically sampled into the HPLC were subjected to different conditions. An argon flow meter coupled with a head-space interface carried gases from the headspace of the reactor into a calibrated gas-phase mass spectrometer. With this setup, high-quality FlowNMR spectra could be acquired during the reaction and quantitative reaction profiles generated after correction for flow effects2 (Fig. 3).
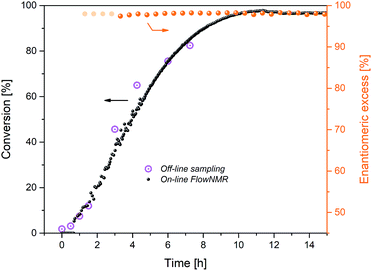 | ||
Fig. 3 Reaction progress and enantioselectivity of the hydrogenation of acetophenone (0.4 M) catalysed by 1 (2 mM = 0.5 mol%) from formic acid/triethylamine (5![[thin space (1/6-em)]](https://www.rsc.org/images/entities/char_2009.gif) : :![[thin space (1/6-em)]](https://www.rsc.org/images/entities/char_2009.gif) 2, 4 M) in THF at 40 °C. 2, 4 M) in THF at 40 °C. | ||
The reaction progress measured in flow matched that from off-line sampling, but with more detailed information. Although not cleanly first order (see below), the shape of the profile showed the reaction rate to be dependent on substrate concentration, as expected for the relatively low substrate concentration of 0.4 M used here.19 The maximum rate observed after 2 h at 40 °C of kobs = 1.1 mM min−1 was significantly lower than that found for the same reaction in propan-2-ol (kobs = 9.2 mM min−1 at 20 °C), but conversions of >95% were reached after 10 h with FA/TEA, whereas a maximum of 82% equilibrium conversion could be obtained in propan-2-ol under otherwise identical conditions.6 Enantioselectivity to (R)-1-phenylethanol was constant at 97 ± 1% over more than 18 h in FA/NEt3, whereas a gradual erosion of ∼2% ee per hour from the initial level of 98% has been observed in propan-2-ol.6
Closer inspection of the reaction profile revealed an induction period of about 2 h during which product formation gradually sped up until it reached its maximum rate. When formic acid consumption was analysed using the integration of its formyl proton at 8.3 ppm in the 1H NMR spectra, it became apparent that a large amount of reductant had been consumed during the 2 hour induction period (Fig. 4).
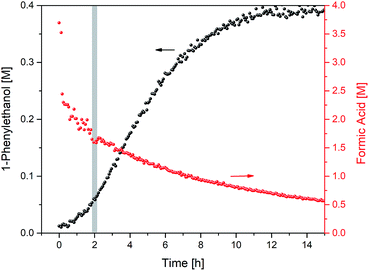 | ||
Fig. 4 Product formation and formic acid consumption during the hydrogenation of acetophenone (0.4 M) catalysed by 1 (2 mM = 0.5 mol%) from formic acid/triethylamine (5![[thin space (1/6-em)]](https://www.rsc.org/images/entities/char_2009.gif) : :![[thin space (1/6-em)]](https://www.rsc.org/images/entities/char_2009.gif) 2, 4 M) in THF at 40 °C. 2, 4 M) in THF at 40 °C. | ||
The total consumption of formic acid over the course of the reaction exceeded the amount of 1-phenylethanol product by a factor of 9, >50% of which had been consumed during the first 2 h (where less than 10% product had formed). Inspection of the 1H NMR data revealed a significant amount of H2 appearing at 4.56 ppm in the early stages of the reaction (Fig. 5; the concentration of dissolved H2 is in agreement with previous 1H FlowNMR studies20).
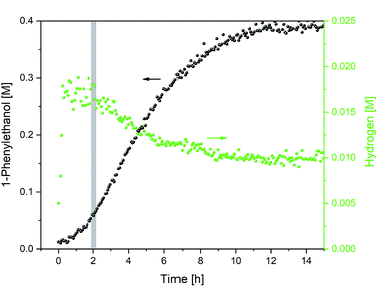 | ||
Fig. 5 Hydrogen formation during the hydrogenation of acetophenone (0.4 M) catalysed by 1 (2 mM = 0.5 mol%) from formic acid/triethylamine (5![[thin space (1/6-em)]](https://www.rsc.org/images/entities/char_2009.gif) : :![[thin space (1/6-em)]](https://www.rsc.org/images/entities/char_2009.gif) 2, 4 M) in THF at 40 °C. 2, 4 M) in THF at 40 °C. | ||
The dehydrogenation of formic acid is known to be easily accomplished with a variety of catalysts,21,22 and H2 co-production during transfer hydrogenation from formic acid with these catalysts had been observed early on by Ikariya and Noyori.7 In line with the low efficiency of [(arene)Ru(TsDPEN)] complexes in H2 hydrogenation,4,23 isotope labelling experiments have shown no deuterium incorporation from D2 during ketone reduction with HCO2H.7 Thus, the large amount of formic acid dehydrogenation occurring in the early stages of transfer hydrogenation with the Ikariya–Noyori catalyst (Fig. 5) must originate from a parasitic side reaction.
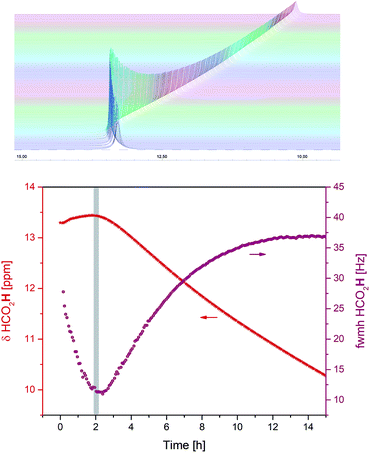
Alongside the appearance of H2 in solution it was observed that the 1H chemical shift value and peak width of the formic acid O–H noticeably changed throughout the reaction (Fig. 6).
The highest chemical shift values and narrowest peak widths of the carboxylic acid proton were observed around the 2 h time point when the system switched from predominantly hydrogen evolution to more hydrogen transfer (Fig. 4 and 5). At this point, the FA/TEA ratio had dropped from the initial 2.5![[thin space (1/6-em)]](https://www.rsc.org/images/entities/char_2009.gif) :
:![[thin space (1/6-em)]](https://www.rsc.org/images/entities/char_2009.gif) 1 to 1.5
1 to 1.5![[thin space (1/6-em)]](https://www.rsc.org/images/entities/char_2009.gif) :
:![[thin space (1/6-em)]](https://www.rsc.org/images/entities/char_2009.gif) 1. This value falls between the stable 3
1. This value falls between the stable 3![[thin space (1/6-em)]](https://www.rsc.org/images/entities/char_2009.gif) :
:![[thin space (1/6-em)]](https://www.rsc.org/images/entities/char_2009.gif) 1, 5
1, 5![[thin space (1/6-em)]](https://www.rsc.org/images/entities/char_2009.gif) :
:![[thin space (1/6-em)]](https://www.rsc.org/images/entities/char_2009.gif) 2 and 1
2 and 1![[thin space (1/6-em)]](https://www.rsc.org/images/entities/char_2009.gif) :
:![[thin space (1/6-em)]](https://www.rsc.org/images/entities/char_2009.gif) 1 H-bonded complexes commonly observed for mixtures of carboxylic acids and tertiary amines,24 and the 1H chemical shift evolution indicates the weakest H-bond interaction25 with maximum acidity26 at this point. The triethylamine peaks were also shifting throughout the reaction, however, this was less pronounced and without an obvious maximum. Thus, although the exact distribution of H-bonding interactions in the mixture is not clear at present, the observation that the carboxylic acid proton chemical shift and peak width act as sensitive reporters of the hydrogen transfer activity might be of practical utility in optimising the performance of these systems (see below).
1 H-bonded complexes commonly observed for mixtures of carboxylic acids and tertiary amines,24 and the 1H chemical shift evolution indicates the weakest H-bond interaction25 with maximum acidity26 at this point. The triethylamine peaks were also shifting throughout the reaction, however, this was less pronounced and without an obvious maximum. Thus, although the exact distribution of H-bonding interactions in the mixture is not clear at present, the observation that the carboxylic acid proton chemical shift and peak width act as sensitive reporters of the hydrogen transfer activity might be of practical utility in optimising the performance of these systems (see below).
Interleaved 13C NMR spectra acquired during the reaction showed the presence of CO2 at 124.8 ppm. This chemical shift value is indicative of physisorbed CO2, which together with the observation of unchanged 13C NMR shifts for 1-phenylethanol and triethylamine ruled out chemisorption of CO2 by way of in situ ammonium carbonate formation that is sometimes seen in alcohol/amine/CO2 mixtures.27 Due to the low intensity of the quaternary 13C signal of CO2, quantification during the reaction by 13C FlowNMR was not possible. However, coupling the head space of the reactor to a gas-phase mass spectrometer allowed quantitative tracking of both CO2 and H2 over time (Fig. 7).
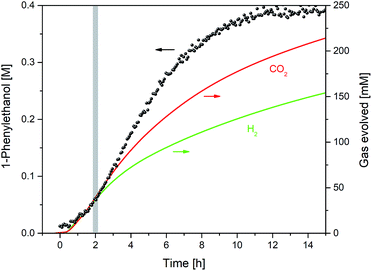 | ||
Fig. 7 Product formation and gas evolution profiles during the hydrogenation of acetophenone (0.4 M) catalysed by 1 (2 mM = 0.5 mol%) from formic acid/triethylamine (5![[thin space (1/6-em)]](https://www.rsc.org/images/entities/char_2009.gif) : :![[thin space (1/6-em)]](https://www.rsc.org/images/entities/char_2009.gif) 2, 4 M) in THF at 40 °C. 2, 4 M) in THF at 40 °C. | ||
From the relative gas intensities detected in the head space§ it can be seen that H2 and CO2 were evolved in a 1![[thin space (1/6-em)]](https://www.rsc.org/images/entities/char_2009.gif) :
:![[thin space (1/6-em)]](https://www.rsc.org/images/entities/char_2009.gif) 1 ratio in the first two hours, with H2 evolution slowing down as hydrogen transfer took over later on. The sustained co-evolution of H2 until the end of the reaction showed formic acid dehydrogenation to continue in parallel to transfer hydrogenation, and explains the approximately ten-fold excess of formic acid required for quantitative reduction of the ketone substrate. No CO was detected during the reaction (see ESI†), showing dehydration of formic acid to be insignificant under the conditions applied.
1 ratio in the first two hours, with H2 evolution slowing down as hydrogen transfer took over later on. The sustained co-evolution of H2 until the end of the reaction showed formic acid dehydrogenation to continue in parallel to transfer hydrogenation, and explains the approximately ten-fold excess of formic acid required for quantitative reduction of the ketone substrate. No CO was detected during the reaction (see ESI†), showing dehydration of formic acid to be insignificant under the conditions applied.
In order to gain insight into the catalyst speciation during these two inter-connected catalytic reactions we tried to detect ruthenium intermediates 2–4 (Fig. 1) during the reaction. As in our previous studies on transfer hydrogenation from propan-2-ol with the same catalyst system,6 selective excitation of the negative shift region in the 1H FlowNMR allowed detection and quantitative tracking of the hydride intermediate 4 at −5.94 ppm during the reaction (Fig. 8).
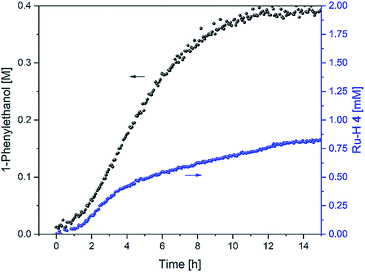 | ||
Fig. 8 Product formation and amount of 4 during the hydrogenation of acetophenone (0.4 M) catalysed by 1 (2 mM = 0.5 mol%) from formic acid/triethylamine (5![[thin space (1/6-em)]](https://www.rsc.org/images/entities/char_2009.gif) : :![[thin space (1/6-em)]](https://www.rsc.org/images/entities/char_2009.gif) 2, 4 M) in THF at 40 °C. 2, 4 M) in THF at 40 °C. | ||
Like in basic propan-2-ol, activation of the chloride complex 1 is rapid and quantitative with an excess of triethylamine.8 However, while in IPA precursor 1 formed the hydride complex 4quantitatively in the absence of ketone substrate and dropped to ∼50% upon initiation of catalysis,6 in formic acid less than 2% of the catalyst existed as 4 before and after acetophenone was added (Fig. 8). The amount of 4 slowly grew to ∼5% of the overall Ru loading over the first 2 h as H2 evolution slowed down, and rose to ∼20% between 2 and 4 h when the rate of hydrogen transfer was highest. It then continued to slowly build up to about 40% over the following 10 hours as both H2 evolution and hydrogen transfer slowed down and formic acid concentration fell below 1 M (Fig. 4). This behaviour is similar to previous observations with tethered versions of the Ikariya–Noyori catalyst,19 and suggests that a ruthenium intermediate other than the hydride complex 4 dominates the catalyst speciation in formic acid/triethylamine.
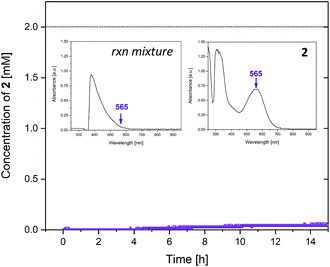
The formate complex 3 could be detected in both the 1H and 13C NMR spectra of the reaction (see ESI†) but was difficult to quantify due to peak overlap from the large formic acid signals. However, UV-vis spectroscopy allowed tracking of the unsaturated intermediate 2 during the reaction based on its characteristic absorbance at 565 nm (Fig. 9).
The UV-vis data showed that less than 2% of the catalyst resided in the unsaturated intermediate 2 throughout the reaction.¶ This would imply an almost quantitative transformation of any 2 formed during the reaction, and the known stability of 3 is likely the key difference to the simpler IPA system that operates between 2 and 4 only. Our formulation of 3 as the major intermediate in the formic acid-driven cycle is consistent with previous (stoichiometric) test reactions that showed fast and quantitative formation of 3 from 2 and formic acid, but a kinetic barrier of 87 kJ mol−1 for the decarboxylation of 3 to 4.9
As we did not observe any changes in enantioselectivity over the course of the reaction (as sometimes seen for low pH values/high FA loadings14,28) we can interpret the variation in transfer hydrogenation rate as a shift of catalyst distribution within the same cycle. Indeed, the variation in FA/TEA ratio throughout the reaction mirrored the profile of ruthenium hydride 4 observed (Fig. 10).
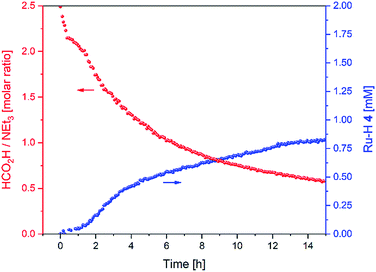 | ||
Fig. 10 FA/TEA ratio and amount of 4 during the hydrogenation of acetophenone (0.4 M) catalysed by 1 (2 mM = 0.5 mol%) from formic acid/triethylamine (5![[thin space (1/6-em)]](https://www.rsc.org/images/entities/char_2009.gif) : :![[thin space (1/6-em)]](https://www.rsc.org/images/entities/char_2009.gif) 2, 4 M) in THF at 40 °C. 2, 4 M) in THF at 40 °C. | ||
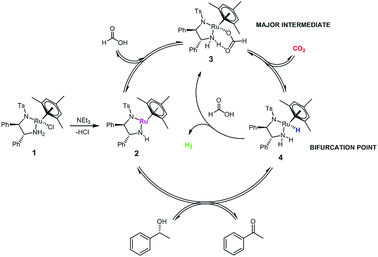
We can thus formulate an expanded mechanism for this reaction that includes the parasitic dehydrogenation loop, and accounts for the shift in catalyst distribution caused by the competition of substrate, formic acid and CO2 for reaction with the hydride complex 4 (Fig. 11).||
While the spontaneous, intramolecular elimination of H2 from complex 4 has a high kinetic barrier29 and is thus not observed in basic propan-2-ol, exogeneous protonation of the Ru–H by excess formic acid is likely the major pathway for H2 evolution at high FA concentrations. Indeed, treating an isolated sample of hydride complex 4 with formic acid lead to the immediate formation of formate complex 3 accompanied by the production of H2 (Fig. 12 and ESI†).
The Ru–H complex 4 is also known to be able to react with CO2 to reform 3,9 as reflected in the inhibitory effect of CO2 on product formation reported earlier.28 Thus, hydride complex 4 presents itself as the bifurcation point for three competing reactions: re-insertion of CO2, protonation to H2, or hydrogen transfer to the ketone. The relative concentrations of CO2, formic acid and ketone (and their evolution with time) therefore determine product formation and catalyst distribution between 3 and 4 over time. The fact that most of the catalyst resides in the relatively stable formate complex 3 during the reaction may also explain the lower levels of catalyst deactivation seen in FA/NEt3 mixtures (no signs of Ru black formation were observed, see ESI†) as opposed to using basic propan-2-ol.6
As a demonstration of the utility of our findings for applied catalysis, a reaction started at the optimum FA concentration of 1.5 M under the conditions applied showed an immediate onset of transfer hydrogenation without any lag phase, and a steady 20–22% catalyst distribution of hydride complex 4 throughout the reaction (Fig. 13). Some H2 co-production still occurred as seen by the FA concentration falling from 1.5 to 0.4 M during the production of 0.4 M 1-phenylethanol, but to a much lower extent as compared to when using the commercial 5![[thin space (1/6-em)]](https://www.rsc.org/images/entities/char_2009.gif) :
:![[thin space (1/6-em)]](https://www.rsc.org/images/entities/char_2009.gif) 2 azeotropic FA/TEA mixture where eight times more dehydrogenation than transfer hydrogenation occurred (Fig. 4).
2 azeotropic FA/TEA mixture where eight times more dehydrogenation than transfer hydrogenation occurred (Fig. 4).
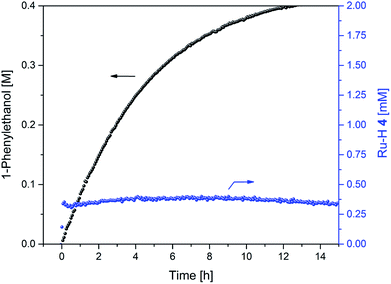 | ||
| Fig. 13 Product formation and amount of 4 during the hydrogenation of acetophenone (0.4 M) catalysed by 1 (2 mM = 0.5 mol%) from formic acid / triethylamine (3 : 2, 2.5 M) in THF at 40 °C. | ||
Conclusions
Using a combination of high resolution FlowNMR techniques, UV-vis spectroscopy, chiral HPLC and head-space MS we have been able to follow multiple aspects of hydrogen transfer catalysis from formic acid with the Ikariya–Noyori catalyst [(mesitylene)RuCl(R,R)-(TsDPEN)]. Tracking consumption of reductant during product formation and correlation with gas evolution traces showed a significant amount of formic acid dehydrogenation to occur before (and during) transfer hydrogenation of acetophenone. Understanding and minimising unproductive formic acid dehydrogenation is important for efficient and safe application of these catalysts, especially on an industrial scale. The formic acid O–H chemical shift and peak width emerged as a sensitive reporter for H-bonding in the mixture that correlated with the catalyst switching from predominantly H2 evolution to hydrogen transfer. This point is likely to be a function not only of relative concentrations but also of substrate pKA. Indeed, H2 co-evolution is less pronounced with more basic imine substrates that require activation by protonation (and thus are less efficiently reduced with the same catalysts in basic propan-2-ol).30 Using a combination of selectively excited 1H FlowNMR and FlowUV-vis spectroscopies we were able to show that the dominant catalyst intermediates with formic acid are the formate complex 3 and hydride complex 4. As previously suggested, the supposed irreversibility of CO2 elimination from 3 only applies if the gas is effectively removed from the reaction solution.31 The fact that no appreciable amounts of 2 are present in FA/TEA mixtures appears to be the true reason why no erosion of enantioselectivity over time is seen with these systems, as otherwise 2 could still oxidise the product back to the starting material like in the fully reversible cycle with propan-2-ol.Conflicts of interest
A. C. and I. C. are employees of Bruker UK Ltd., manufacturer and supplier of NMR hard- and software solutions that have been used in this research. The other authors declare no competing interests.Acknowledgements
This work was supported by the Royal Society (UF160458 to U. H.), the EPSRC Dynamic Reaction Monitoring Facility at the University of Bath (EP/P001475/1), and Bruker UK Ltd. (CASE studentship to D. B.). The authors would like to thank Dr Andrew Hall (University of Southampton), Prof. Martin Wills (University of Warwick), and Dr Antonio Zanotti-Gerosa (Johnson Matthey) for their support and assistance with this project.Notes and references
- Nat. Catal., 2018, 1, 165–166, http://https://www.nature.com/articles/s41929-018-0050-4 Search PubMed.
- A. M. R. Hall, J. C. Chouler, A. Codina, P. T. Gierth, J. P. Lowe and U. Hintermair, Catal. Sci. Technol., 2016, 6, 8406–8417 RSC.
- R. Chung and J. E. Hein, Top. Catal., 2017, 60, 594–608 CrossRef CAS.
- R. Noyori and T. Ohkuma, Angew. Chem., Int. Ed., 2001, 40, 40–73 CrossRef CAS PubMed.
- R. Noyori, M. Yamakawa and S. Hashiguchi, J. Org. Chem., 2001, 66, 7931–7944 CrossRef CAS PubMed.
- A. M. R. Hall, P. Dong, A. Codina, J. P. Lowe and U. Hintermair, ACS Catal., 2019, 9, 2079–2090 CrossRef CAS.
- A. Fujii, S. Hashiguchi, N. Uematsu, T. Ikariya and R. Noyori, J. Am. Chem. Soc., 1996, 118, 2521–2522 CrossRef CAS.
- K.-J. Haack, S. Hashiguchi, A. Fujii, T. Ikariya and R. Noyori, Angew. Chem., Int. Ed. Engl., 1997, 36, 285–288 CrossRef CAS.
- T. Koike and T. Ikariya, Adv. Synth. Catal., 2004, 346, 37–41 CrossRef CAS.
- K. Abdur-Rashid, S. E. Clapham, A. Hadzovic, J. N. Harvey, A. J. Lough and R. H. Morris, J. Am. Chem. Soc., 2002, 124, 15104–15118 CrossRef CAS PubMed.
- X. Li, X. Wu, W. Chen, F. E. Hancock, F. King and J. Xiao, Org. Lett., 2004, 6, 3321–3324 CrossRef CAS PubMed.
- X. Wu, X. Li, F. King and J. Xiao, Angew. Chem., Int. Ed., 2005, 44, 3407–3411 CrossRef CAS PubMed.
- J. Canivet and G. Süss-Fink, Green Chem., 2007, 9, 391–397 RSC.
- X. Zhou, X. Wu, B. Yang and J. Xiao, J. Mol. Catal. A: Chem., 2012, 357, 133–140 CrossRef CAS.
- M. Kuzma, J. Václavík, P. Novák, J. Přech, J. Januščák, J. Červený, J. Pecháček, P. Šot, B. Vilhanová, V. Matoušek, I. I. Goncharova, M. Urbanová and P. Kačer, Dalton Trans., 2013, 42, 5174–5182 RSC.
- D. G. Blackmond, M. Ropic and M. Stefinovic, Org. Process Res. Dev., 2006, 10, 457–463 CrossRef CAS.
- V. S. Shende, S. H. Deshpande, S. K. Shingote, A. Joseph and A. A. Kelkar, Org. Lett., 2015, 17, 2878–2881 CrossRef CAS PubMed.
- A. B. Jones, G. C. Lloyd-Jones and D. Uhrín, Anal. Chem., 2017, 89, 10013–10021 CrossRef CAS PubMed.
- F. K. Cheung, A. J. Clarke, G. J. Clarkson, D. J. Fox, M. A. Graham, C. Lin, A. L. Crivillé and M. Wills, Dalton Trans., 2010, 39, 1395–1402 RSC.
- J. Y. Buser and A. D. McFarland, Chem. Commun., 2014, 50, 4234–4237 RSC.
- T. C. Johnson, D. J. Morris and M. Wills, Chem. Soc. Rev., 2010, 39, 81–88 RSC.
- P. Mars, J. J. F. Scholten and P. Zwietering, in Advances in Catalysis, ed. D. D. Eley, H. Pines and P. B. Weisz, Academic Press, 1963, vol. 14, pp. 35–113 Search PubMed.
- S. E. Clapham, A. Hadzovic and R. H. Morris, Coord. Chem. Rev., 2004, 248, 2201–2237 CrossRef CAS.
- F. Kohler, R. Gopal, G. Goetze, H. Atrops, M. A. Demeriz, E. Liebermann, E. Wilhelm, F. Ratkovics and B. Palagyi, J. Phys. Chem., 1981, 85, 2524–2529 CrossRef CAS.
- J. E. Del Bene, S. A. Perera and R. J. Bartlett, J. Phys. Chem. A, 1999, 103, 8121–8124 CrossRef CAS.
- M. H. Abraham, R. J. Abraham, J. Byrne and L. Griffiths, J. Org. Chem., 2006, 71, 3389–3394 CrossRef CAS PubMed.
- P. G. Jessop, S. M. Mercer and D. J. Heldebrant, Energy Environ. Sci., 2012, 5, 7240–7253 RSC.
- X. Wu, J. Liu, D. Di Tommaso, J. A. Iggo, C. R. A. Catlow, J. Bacsa and J. Xiao, Chem.–Eur. J., 2008, 14, 7699–7715 CrossRef CAS PubMed.
- F. Hasanayn and R. H. Morris, Inorg. Chem., 2012, 51, 10808–10818 CrossRef CAS PubMed.
- N. Uematsu, A. Fujii, S. Hashiguchi, T. Ikariya and R. Noyori, J. Am. Chem. Soc., 1996, 118, 4916–4917 CrossRef CAS.
- N. A. Strotman, C. A. Baxter, K. M. J. Brands, E. Cleator, S. W. Krska, R. A. Reamer, D. J. Wallace and T. J. Wright, J. Am. Chem. Soc., 2011, 133, 8362–8371 CrossRef CAS PubMed.
- P. A. Dub and T. Ikariya, J. Am. Chem. Soc., 2013, 135, 2604–2619 CrossRef CAS PubMed.
Footnotes |
| † Electronic supplementary information (ESI) available. See DOI: 10.1039/c9fd00060g |
| ‡ The analogous alkoxide intermediates have not yet been identified for the propan-2-ol system, although computational work has suggested their existence as off-cycle resting states.32 |
| § The initial burst phase of H2 and CO2 evolution (Fig. 5) would first saturate the liquid phase and is thus not seen as dramatically in the headspace MS data. |
| ¶ Inspection of the data shows even this 2% to be mostly tailing from other signals (see ESI†). |
| || Although a case for omitting intermediate 2 from the formic acid cycle could be made based on the UV-vis data (Fig. 9) it is still included here to illustrate the product formation step. |
| This journal is © The Royal Society of Chemistry 2019 |

