
 Open Access Article
 This Open Access Article is licensed under a Creative Commons Attribution-Non Commercial 3.0 Unported Licence
Plant-to-planet analysis of CO2-based methanol processes†
Andrés
González-Garay
 a,
Matthias S.
Frei
b,
Amjad
Al-Qahtani
a,
Cecilia
Mondelli
*b,
Gonzalo
Guillén-Gosálbez
*b and
Javier
Pérez-Ramírez
*b
a,
Matthias S.
Frei
b,
Amjad
Al-Qahtani
a,
Cecilia
Mondelli
*b,
Gonzalo
Guillén-Gosálbez
*b and
Javier
Pérez-Ramírez
*b
aCentre for Process Systems Engineering, Imperial College London, SW7 2AZ London, UK
bDepartment of Chemistry and Applied Biosciences, Institute for Chemical and Bioengineering, ETH Zurich, Vladimir-Prelog-Weg 1, 8093 Zurich, Switzerland. E-mail: cecilia.mondelli@chem.ethz.ch; gonzalo.guillen.gosalbez@chem.ethz.ch; jpr@chem.ethz.ch
First published on 27th September 2019
Abstract
A critical assessment of methanol production from carbon dioxide and renewable hydrogen is here presented, gathering an insightful picture of its wide sustainability and establishing a hierarchy of factors dictating its performance. Process simulation and life-cycle analysis indicate that green methanol is at present economically unattractive, i.e., it has a 1.3–2.6-fold higher cost compared to the current fossil-based analogue, even when considering indirect environmental costs via monetisation of impacts and a potential CO2 tax of at least 430.5 USD tCO2-eq−1. This is mainly due to the high price of hydrogen (water electrolysis powered with solar, wind, and nuclear energy, or biomass gasification, up to 73% of the total cost), which shall drop significantly due to reductions in electricity costs and technological advances. The scenario radically changes when quantifying for the first time the absolute sustainability of this carbon capture and utilisation route through eight planetary boundaries, revealing that CO2-based methanol would contribute to operating safely within critical ecological limits of the Earth linked to carbon emissions, currently transgressed by the conventional process. Our plant-to-planet assessment embraces the full potential role of emerging processes in sustainable development, which should prevail over purely economic arguments, subject to market fluctuations and technological advances.
Broader contextEnvironmental assessments are extensively used to evaluate carbon capture and utilisation routes and other emerging technologies to guide research and policymaking. Still, their current narrow scope focused at the plant or supply-chain levels fails to address worldwide constraints essential to define a safe operation space for humanity. A systems engineering approach that bridges the molecular and planet levels is here applied to quantify the absolute sustainability of converting CO2 and renewable H2 into the platform chemical and energy carrier methanol, coupling the concept of planetary boundaries with state-of-the-art process modelling and evaluation tools. This investigation uncovers the potential role of green methanol production in avoiding the transgression of key ecological limits, providing insights that are out of the reach of traditional assessment methods. Anticipating the increasing importance of sustainable development in science and engineering, alongside the growing need to mitigate multiple environmental impacts simultaneously, we advocate for the integration of absolute sustainability criteria across scales to drive the establishment of next-generation processes. Our analysis lays the foundations of a paradigm shift in the environmental assessment of fuels and chemicals, opening up new avenues for a more sensible evaluation of technologies for CO2 valorisation and beyond, which should become a prerequisite to inform efforts towards a carbon-neutral society. |
Introduction
At present, a myriad of disruptive technologies are being investigated in academia and in the chemical industry and energy sector to meet the growing demand for products and energy more sustainably.1–4 Innovative electrochemical routes to generate cleaner hydrogen and ammonia,5–7 and thermal and electrocatalytic strategies to utilise captured CO2 as a feedstock for chemical and fuel production comprise prominent examples of this growing trend.8–14 In relation to renewable H2 production, alkaline electrolysis cells (AEC), proton-exchange electrolysis cells (PEMEC) and solid-oxide electrolysis cells (SOEC) stand as the most appealing technologies.15 In the area of CO2 valorisation, methanol is receiving broad attention in view of its essential role as a platform molecule and its potential as an outstanding fuel16 as well as a vector to synthetic fuels through established and upcoming methanol-to-olefins/hydrocarbons/kerosene technologies.17 At present, thermally-driven pathways are more developed than electrocatalytic routes and thus hold prospects to reach commercialisation more rapidly.18 The traditional Cu–ZnO–Al2O3 catalyst used for the current methanol production from syngas was initially investigated in the processing of CO2-based streams, showing high activity, moderate selectivity, and condition-dependent stability. Among other systems investigated, In2O3/ZrO2 and ZnO/ZrO2 comprise exceptionally selective and robust catalytic systems, and the activity of the former could be effectively promoted by palladium.11,12,19 Further catalysts showing promising performance are K–CeO2–MoP/SiO2 and a CuZnGa material.20,21The widespread adoption of these and other emerging processes designed to underpin sustainable development critically hinges on our ability to build strong cases, rooted in quantitative analyses, to replace (fossil-based) business-as-usual (BAU) practices. In this context, process modelling and techno-economic and environmental evaluation are pivotal to screen alternative solutions, identify technical barriers and, ultimately, enable the efficient allocation of resources and fast deployment of the best performing options. Despite their key role, current assessments focused at the plant22,23 or life-cycle24–26 levels provide limited insight into the global influence of technologies on sustainable development and, consequently, cannot support research and policy making effectively. Indeed, conventional life cycle assessment (LCA) methods are useful to rank technologies, but cannot determine whether they are environmentally sustainable. Notably, investigations on CO2-to-methanol via chemocatalytic routes have been accompanied by fragmented analyses that often overlooked impacts others than global warming and are quite hard to interpret from a world-wide sustainability viewpoint.23,27–35
We argue here that full understanding of novel technologies considering sustainability from the molecular to the planet levels (Fig. 1)2,36 is vital to address practical hurdles, set performance targets, and better inform policy, governance and business bodies. Hence, this critical analysis integrates scientific disciplines across scales under the umbrella of absolute sustainability to study the potential role of green methanol in sustainable development and establish a hierarchy of priorities to guide future efforts. To this end, the concept of planetary boundaries (PBs) is for the first time coupled to process modelling and LCA to pinpoint critical feedstock and reaction parameters and quantify the extent to which green methanol can contribute to operating safely within the Earth's capacity. This assessment reveals that green methanol can avoid the transgression of critical ecological thresholds currently surpassed by the fossil-based process, and that lowering the hydrogen cost would significantly improve the economic appeal of the CO2-based route. Our results also highlight the need for cross-sectoral cooperation to maximise the gap to a range of key ecological limits. More broadly, our PB analysis aims to lay the foundations for a new generation of environmental assessments of fuels and chemicals, where absolute sustainability, often evaluated ex post through metrics that hardly access this information, should drive process development already from the early stages.
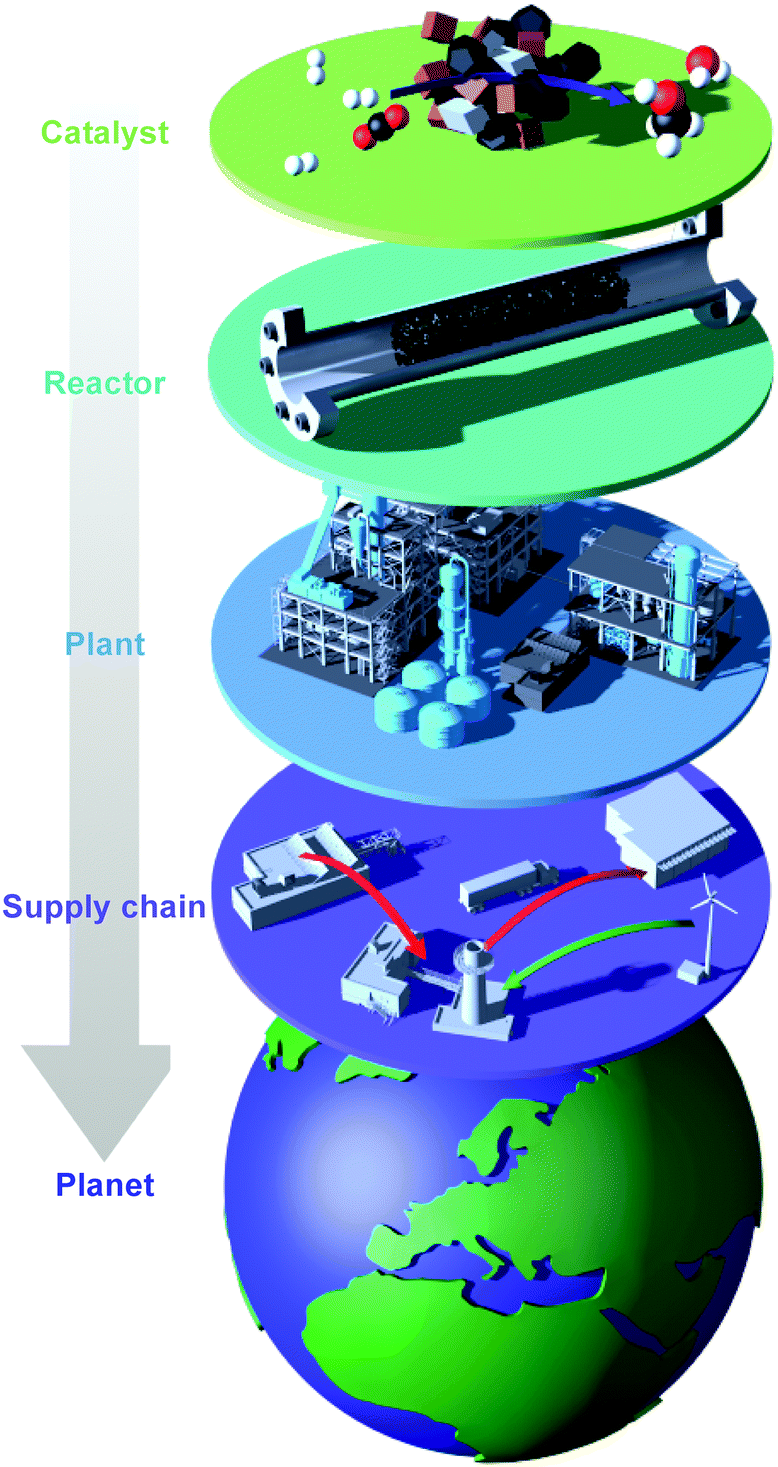 | ||
| Fig. 1 Representation of the scales considered in this analysis of technologies to valorise CO2 into methanol, from the molecular to the planet level. | ||
Materials and methods
The role of CO2-based methanol synthesis in sustainable development was evaluated in this study taking five levels into account: (i) the catalyst level, providing the microkinetics of the reaction; (ii) the reactor level, focused on the type and size of reactor used for the transformation; (iii) the plant level, based on the design and simulation of the process flowsheet; (iv) the supply-chain level, covering the product's life cycle and (v) the planet level, pivoting on the concept of planetary boundaries. Hence, our methodology uniquely combines several tools never integrated before into a single framework, i.e., process modelling and optimisation, LCA, monetisation and PBs. A brief description of these stages is outlined herein, while their detailed treatment is provided in the ESI.†Catalyst level: kinetics of methanol synthesis at the molecular scale
The catalyst level focuses on the chemical route and the solid mediating the reactions involved. Both the traditional and the emerging methanol synthesis processes are based on the same set of transformations (eqn (1)–(3)). CO and CO2 hydrogenation, i.e., eqn (1) and (3), are the main reactions when starting from syngas (CO–H2) and from a CO2–H2 mixture, respectively, and are linked through the water gas-shift reaction, i.e., eqn (2).| CO + 2H2 ↔ CH3OH | (1) |
| CO + H2O ↔ CO2 + H2 | (2) |
| CO2 + 3H2 ↔ CH3OH + H2O | (3) |
Reactor level: type and size of vessel
Based on the literature,23,38 an ideal fixed-bed plug-flow reactor (PFR) was selected for both process scenarios. For the fossil-based process, the volume and operating conditions were fixed to the values available in the original source,38 comprising 100 m3 and a H2/CO/CO2 ratio of 9.8/3.3/1, a temperature of 267 °C and a pressure of 110 bar. We underline that a small amount of CO2 added to syngas exerts a promotional effect on Cu–ZnO–Al2O3, a strategy that is also industrially exploited to boost methanol production. For CO2-based methanol synthesis, the reactor volume and operating conditions were established by optimising the flowsheet, as discussed in the next level.Plant level: process modelling
At this stage, rigorous process flowsheets encompassing all of the tasks required to convert the reactants into methanol and accomplish its separation from by-products were developed based on the reaction system, catalyst and kinetic model described (Fig. 2). Rather than performing a grass roots design following design principles, the traditional process was modelled according to Luyben,38 while the green methanol flowsheet was based on the work by Pérez-Fortes et al.23 Essentially, in both cases methanol is produced in a PFR and purified to a 99.9% (molar basis) pure product using two flash separators and one distillation column. In the CO2-based process scenario, the operating conditions of the Cu–ZnO–Al2O3 catalyst were optimised using a genetic algorithm coupled with the process simulation model, as some of us did in previous work,39 to minimise the total production cost as well as the monetary value of the environmental impact.40 For comparison purposes, an additional theoretical scenario was defined, in which an ideal catalyst permits one to reach the thermodynamic limits for CO2 conversion and full methanol selectivity. The latter is used to study the role of catalyst development in methanol production. Previous studies on green methanol synthesis highlighted the need for cheaper, clean hydrogen to make this process economically competitive.23,30,39 For this reason, our analysis covered four different non-fossil hydrogen sources, namely, biomass gasification41 and water electrolysis powered with nuclear,42 solar,43 or wind44 energy. Furthermore, three CO2 sources were considered, namely CO2 captured from coal and natural gas (NG) power plants, as well as direct air capture (DAC). All details on the simulation models, optimisation runs and cost parameters employed in the OPEX and CAPEX calculations can be found in the ESI.†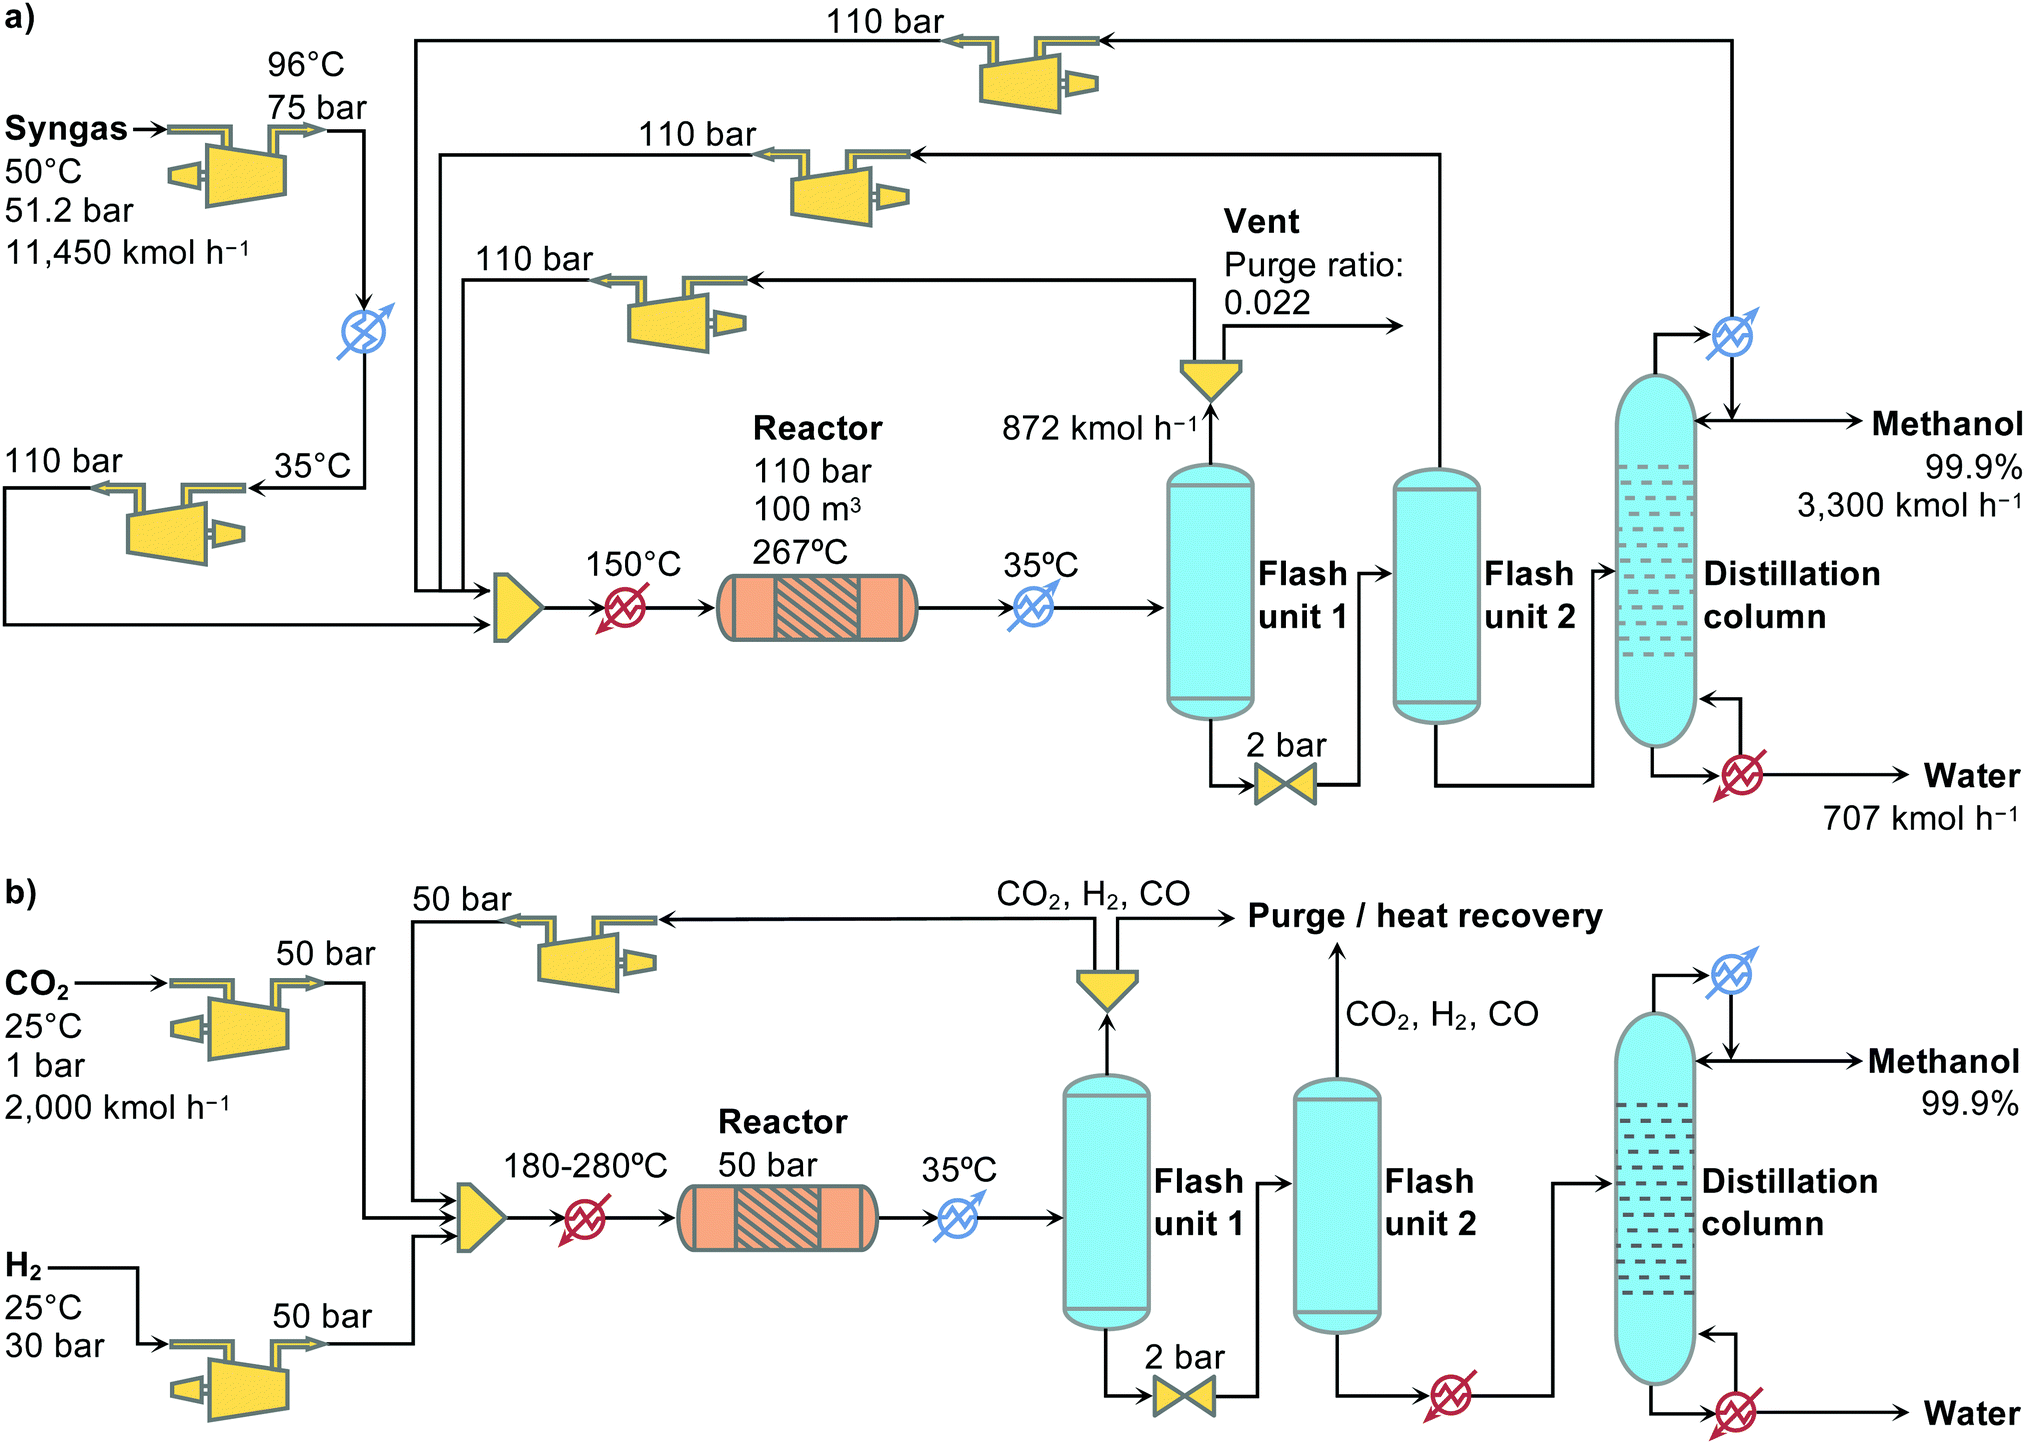 | ||
| Fig. 2 Flowsheets for (a) the conventional methanol synthesis from fossil-based syngas and (b) the emerging CO2-based process consuming renewable hydrogen from various sources. | ||
Supply chain level: life-cycle assessment and monetisation
Here, life-cycle assessment (LCA)45 was applied to evaluate the environmental impact from cradle to grave, covering raw material extraction, production, storage and transportation to final customers. The chemical plant was treated as the foreground system, over which we have a certain level of control, e.g., by changing the temperature, pressure, purge ratio, etc. The surrounding processes supplying raw materials and utilities constitute the background system, which can be modified by varying the hydrogen and CO2 sources. The LCA results for the BAU process, methanol from syngas derived from methane steam reforming, were directly taken from the Ecoinvent database v3.4,46 while a full LCA was carried out to assess the CO2-based methanol process considering the various hydrogen and CO2 sources.With regards to the goal and scope definition (LCA phase 1), an attributional LCA was performed, where the functional unit corresponds to one kilogram of methanol product. Since methanol is the only relevant product of the process, no allocation method was needed. The purge gas of the process is burned to generate high-pressure steam, which was in the first place used to satisfy the heating requirements of the plant, with any surplus being accounted as a positive credit. A cradle-to-gate scope was adopted that covers direct emissions and waste at the plant level, together with those burdens embodied in the inputs to the methanol process, i.e., hydrogen, CO2, electricity, heat and steel. Hence, the end-use phase and any alternative use of renewable energy and carbon capture were omitted. This and other LCA assumptions and limitations are discussed in the ESI.†
In the inventory analysis (LCA phase 2), the life-cycle inventory (LCI) entries were quantified from the mass and energy flows retrieved from Aspen-HYSYS and data from Ecoinvent (Tables S2–S5, ESI†). The LCIs of hydrogen were determined by combining data from the literature (mass and energy flows in hydrogen production, Table S2, ESI†) with data available in Ecoinvent accessed via SimaPro.47 In the damage assessment phase (LCA phase 3), the LCA was underpinned by a monetisation method that expresses LCA impacts on a common monetary basis to enable a more straightforward comparison of scenarios. Following the approach reported by Weidema,40 the endpoint categories of human health, ecosystem quality and resource scarcity in the ReCiPe 201648 LCIA method were monetised using specific economic penalties. Finally, in the interpretation phase (LCA phase 4), the various processes were compared in terms of total cost with externalities.
Planet level: planetary boundaries
Standard LCAs are useful to compare and rank alternatives, but as such cannot determine whether they are truly sustainable because there are no reference values available to interpret the results. Therefore, they fail to evaluate the global implications of technologies on the environment. This limitation is particularly critical when assessing chemicals produced at very large volumes, as is the case of methanol. While facilitating the analysis, monetisation methods, often controversial, also fail to assess absolute sustainability precisely because they do not provide thresholds above which a product is deemed unsustainable. Furthermore, due to lack of consensus and some methodological issues, it is highly unlikely that such thresholds will ever become available.To go beyond standard assessments, and in line with the sustainable development goals,3 the planetary boundaries (PBs) concept by Rockström et al.1 was applied here for the first time to evaluate a chemical process. The PB framework provides the current and background levels in nine Earth systems critical for the planet. These are key processes occurring on the Earth, for which thresholds were defined for ensuring safe worldwide operation, i.e., planetary boundaries. They include climate change, ocean acidification, land use, biogeochemical flows of nitrogen and phosphorus, biodiversity loss, stratospheric ozone depletion, freshwater use, aerosol loading and chemical pollution. Hence, the PB framework offers limits that, if exceeded, could trigger abrupt environmental changes. These global limits can be downscaled at the country and sectoral levels by applying sharing principles. These establish shares of Earth systems that should be respected by a sector or an activity within the sector, such as methanol production, for it to remain within the safe operating space.36
Following this approach, the absolute sustainability level of methanol synthesis in terms of PBs was quantified based on the work by Ryberg et al.36,49 Accordingly, environmental flows with respect to a functional unit, i.e., LCI entries obtained in LCA phase 2, are translated into a set of control variables defined for the nine Earth systems.
Due to methodological limitations and data gaps in the PB framework, the same selection criteria as in a previous study50 were applied to focus on eight (out of fourteen) PBs linked to six (out of nine) Earth systems: (i) energy imbalance and (ii) atmospheric CO2 concentration (climate change); (iii) global industrial and intentional biological fixation of nitrogen and (iv) global phosphorus flows from freshwater systems into the ocean (bio-/geochemical flows); (v) stratospheric ozone concentration (stratospheric ozone depletion); (vi) carbonate ion concentration, average global surface ocean saturation state with respect to aragonite (ocean acidification); (vii) area of forested land as a percentage of original forest cover (land-system change) and (viii) maximum amount of consumptive blue water use (freshwater use). Following work by some of us,50 we accounted for the effect of dinitrogen oxides in stratospheric ozone depletion, which was omitted in the original method used to convert the LCI entries into PBs.36,49 Furthermore, to be consistent with the work by Steffen et al.2 providing updated values for the PBs, we omitted NOx emissions in the calculations relative to the N flow. To establish the environmental limits defined on PBs that should not be surpassed by methanol production, we applied the status quo sharing principle. This is a non-egalitarian principle in which the share of the safe operating space assigned to a process is proportional to its current contribution towards the total level of impact.51
Based on the work by Ryberg et al.,36 the PB calculations were carried out in two steps. Firstly, the percentwise share of the safe operating space assigned to methanol production was established, i.e., the percentwise share of the maximum allowable impact that is allocated to methanol. According to the status quo principle, the percentage share of the safe operating space corresponding to methanol production was determined as follows:
 | (4) |
| SHAREi = PSHAREi · SOSi ∀i | (5) |
| SOSi = |BOUNDi − NBi| ∀i | (6) |
 | (7) |
To properly evaluate absolute sustainability, three pieces of information need to be assessed: (i) the value of the ratio IMPTOTi/SOSi, indicating whether a PB is currently being globally transgressed; (ii) the value of PSHAREi, which quantifies the global role of a technology in meeting a given PB; and (iii) the value of TTi, indicating whether the PB quota assigned to the technology is exceeded. Specifically, if TTi < 1 for all PBs, a technology is deemed environmentally appealing, as it will ensure safe operation provided that the same condition is met in all the remaining sectors of the global economy. Conversely, if TTi > 1 for all PBs, the technology should be phased out, as it could potentially hamper our sustainable development if other sectors fail to offset its excess of the PB quota. When the technology shows values of TTi above one in some PBs and below one in others, the analysis needs to consider also the IMPTOTi/SOSi ratio and the values of PSHAREi to gain deeper insight into the implications. Accordingly, a technology will be deemed environmentally appealing if TTi < 1, particularly in PBs already transgressed and/or in PBs where its contribution towards the total impact level is large. A technology can still be appealing if TTi > 1 in PBs in the safe operating space and/or in PBs where its contribution to the total impact is low. Performance is poor when TTi > 1 in PBs already transgressed and having a large share of the total impact level. Our assessment, therefore, favours technologies with good performance in the most critical Earth systems and/or in those in which methanol plays a more significant role.
Overall, PBs provide a very powerful framework to evaluate processes and deal with the occurrence of burden shifting, i.e., one impact improves while worsening others, which is quite common in science and engineering.52 We note that while the concept of PBs is not new, to our knowledge this is the first time that they are applied to the assessment of chemical processes to quantify their absolute sustainability perfomance. Due to its novelty, the PB approach shows some limitations, mainly associated with uncertainties, which are discussed in detail in the ESI.†
Results and discussion
Green methanol as an alternative to fossil methanol based on traditional plant assessment
The first part of our investigation was centred on assessing the emerging methanol synthesis from CO2 captured from a coal power plant and renewable hydrogen using established tools to compare it with methanol production from syngas derived from methane. The optimisation of the flowsheet for the CO2-based process (Table S6, ESI†), which was run for every hydrogen source considering its corresponding cost and impact embodied, provided the best operating conditions for the Cu–ZnO–Al2O3 catalyst. These entail methanol yields higher than 91.5%, conversions per pass in the range of 12.4–15.8% and methanol selectivities per pass above 99.0%. These values are quite close to those obtained with an ideal catalyst reaching the thermodynamic limit for the reaction system, which leads to methanol yields above 96.0%, conversions per pass between 20 and 35%, and methanol selectivities per pass of 100%. Furthermore, regardless of the provenance of renewable hydrogen, the optimal H2/CO2 ratio in the feed lies slightly below the stoichiometric value of three for both the real and ideal catalyst, which reduces the consumption of expensive hydrogen. Temperatures of 221–228 °C were found to be optimal for green methanol synthesis at 50 bar (a pressure consistent with the kinetic model) for any type of hydrogen feedstock (Table S2, ESI†). These are sufficiently high for supplying heat via heat integration to other unit operations, mainly the reboiler of the distillation column, leading to a virtually zero energy demand. In the ideal case, the optimal temperatures are in the range 101–131 °C, which still enable heat integration, while the optimal pressures fall in the interval of 24–32 bar. Optimisation does not decrease the pressure any further because there is a trade-off between lower compression duties (at lower pressures) and higher conversions due to equilibrium limitations of CO2 hydrogenation to methanol (at higher pressures).Analysing the economic performance (Fig. 3), fossil methanol has the lowest production cost (excluding externalities), with a value of 0.63 USD per kg of methanol. This process is followed by green methanol produced using hydrogen from biomass (0.81 USD kgMeOH−1), and hydrogen from water electrolysis with nuclear (1.27 USD kgMeOH−1), wind (1.38 USD kgMeOH−1) and solar (2.09 USD kgMeOH−1) electricity, respectively. Even after accounting for externalities, fossil methanol remains the cheapest option with a value of 1.08 USD kgMeOH−1. It is followed by CO2-based methanol relying on nuclear (1.38 USD kgMeOH−1), wind (1.51 USD kgMeOH−1), biomass (1.54 USD kgMeOH−1) and solar (2.43 USD kgMeOH−1) hydrogen sources. Methanol based on hydrogen from biomass leads to the largest externalities implying a cost of 0.74 USD kgMeOH−1 (47.7% over the total cost), followed by fossil methanol (0.45 USD kgMeOH−1, 41.5%), and green methanol based on solar (0.35 USD kgMeOH−1, 14.2%), wind (0.13 USD kgMeOH−1, 8.5%) and nuclear (0.11 USD kgMeOH−1, 8.1%) hydrogen.
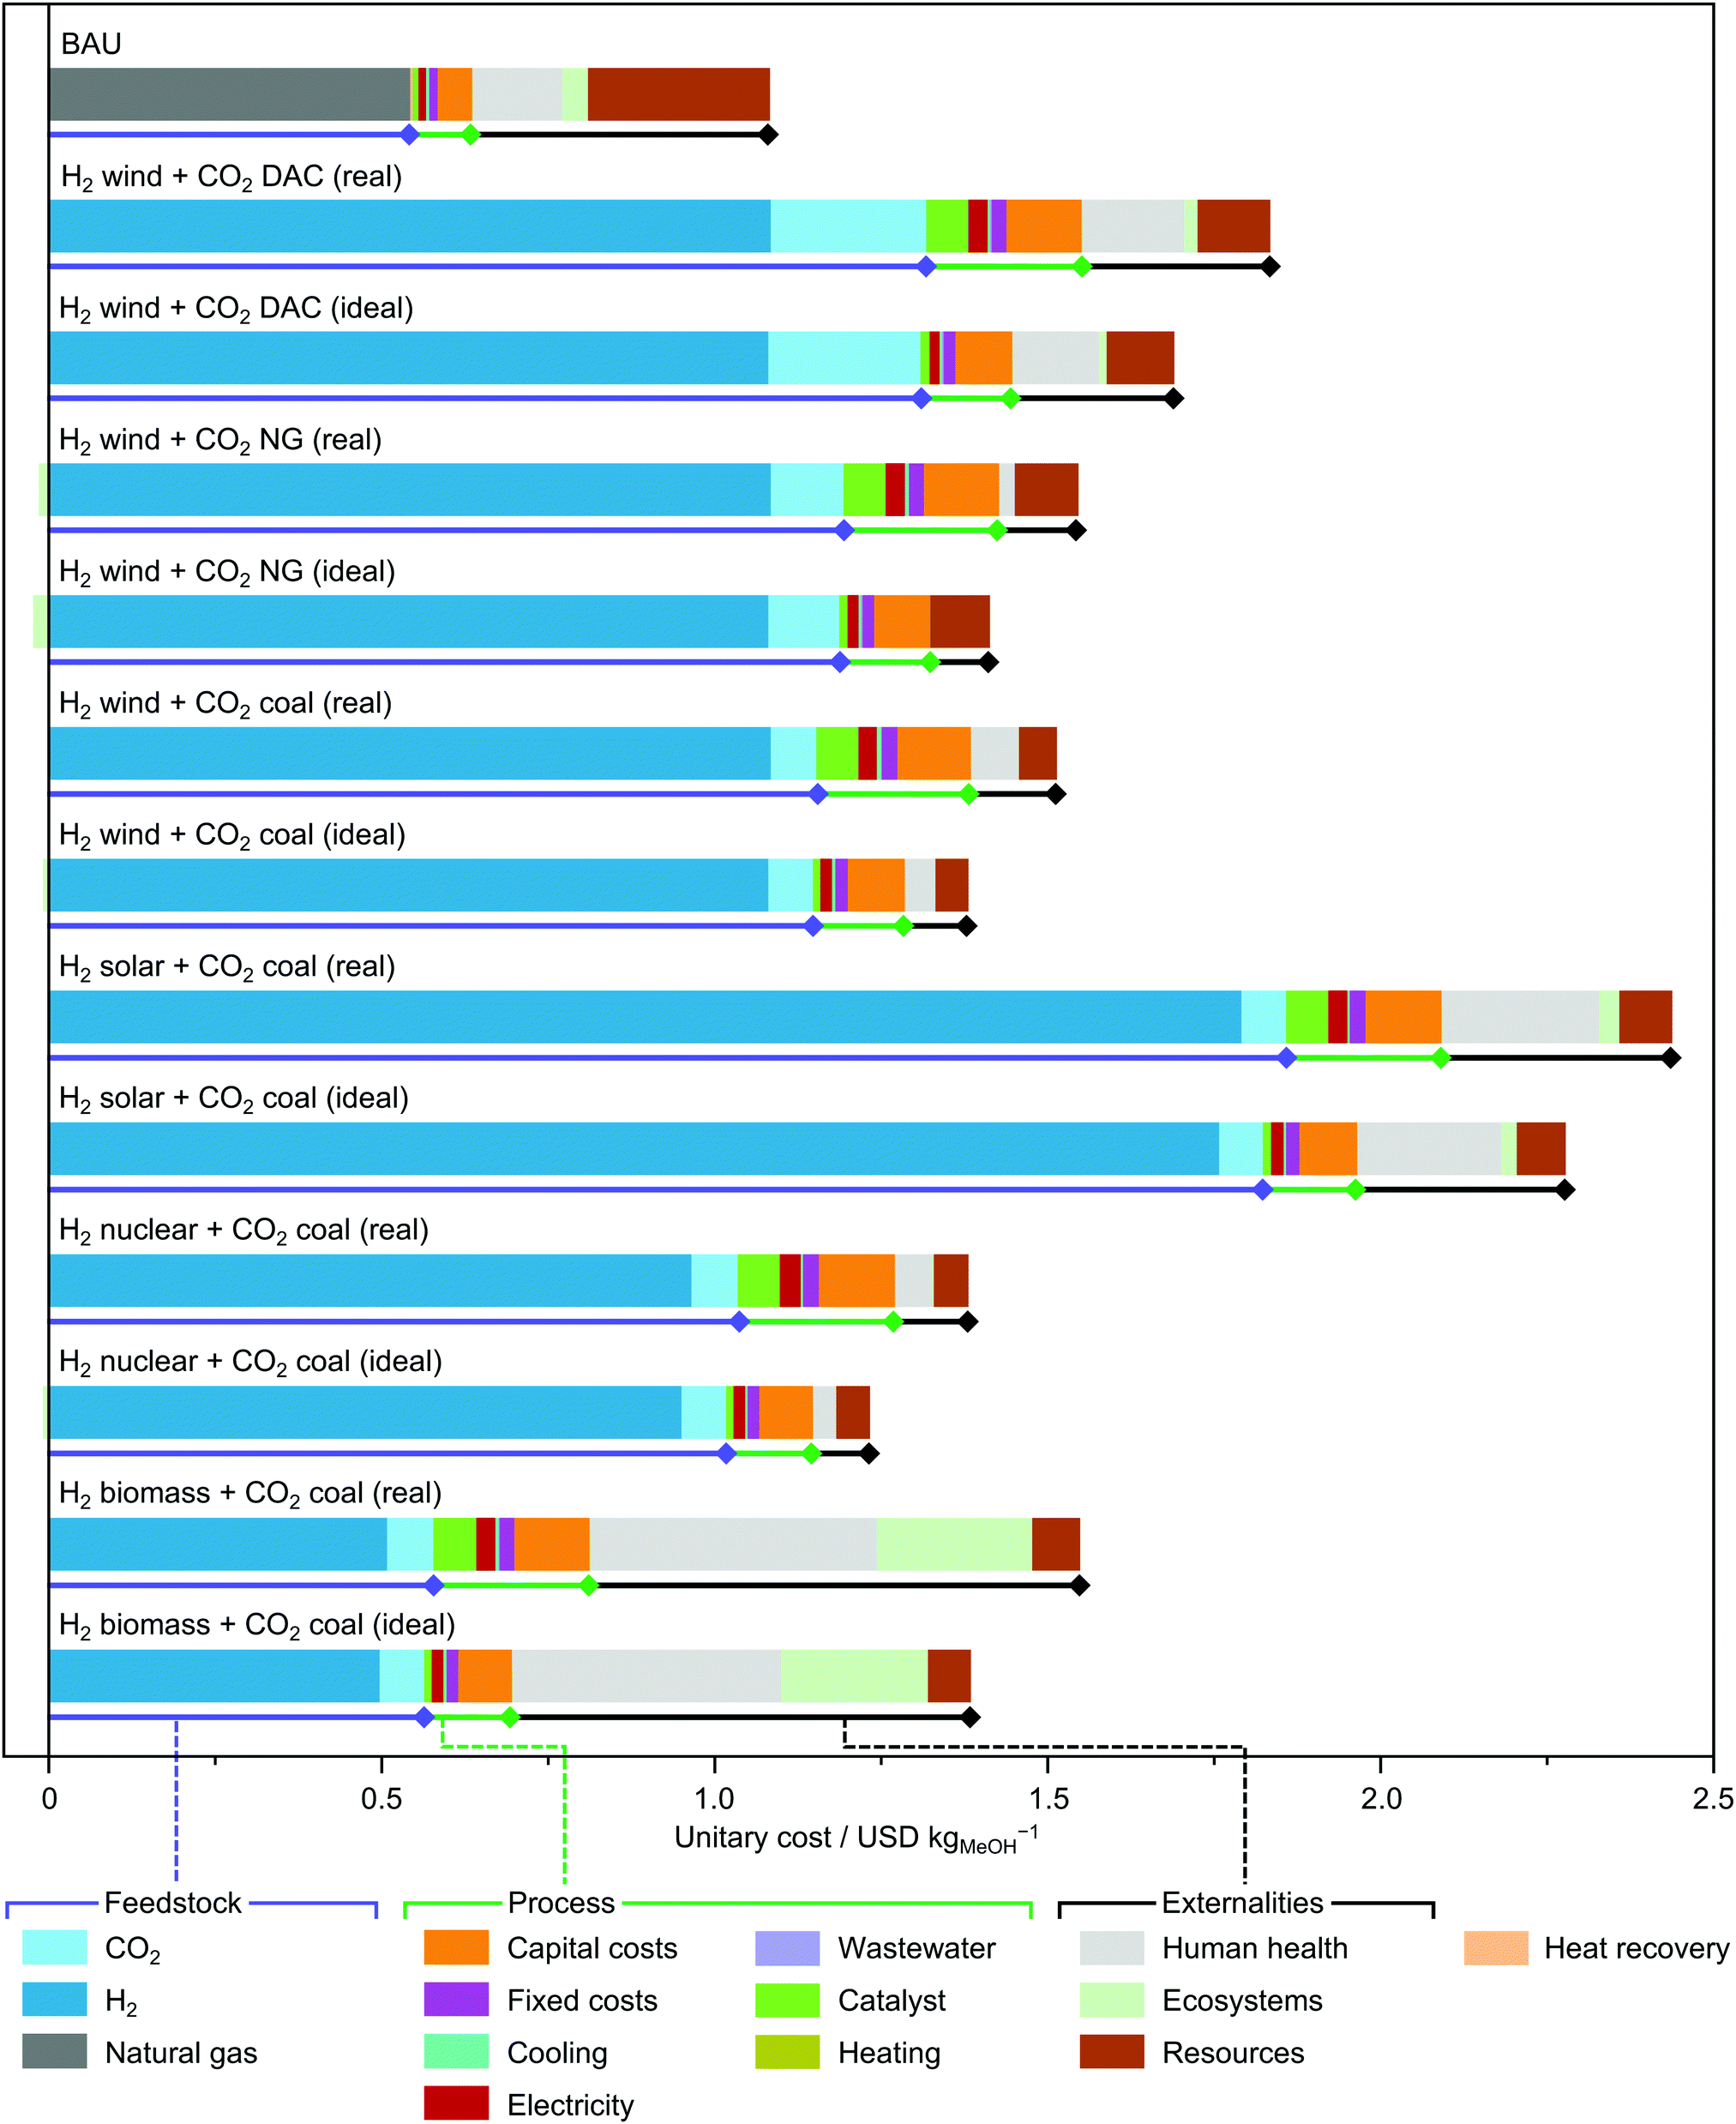 | ||
| Fig. 3 Total cost, including externalities, of fossil-based methanol from syngas and CO2-based methanol produced using renewable hydrogen from various sources, and an ideal catalyst reaching the thermodynamically allowed conversion and selectivity levels and the commercial Cu–ZnO–Al2O3 catalyst, together with the cost and externalities breakdowns. | ||
The cost breakdown shows that hydrogen and, to a lesser extent, CO2 are the main contributors towards the total methanol production cost for the CO2-based process, with shares ranging between 51.6 and 89.4% for hydrogen (without externalities, and 26.9 and 78.6% with externalities), and between 3.2 and 26.7% for CO2 (without externalities, and 2.8 and 4.7% with externalities). The performance attained by the Cu–ZnO–Al2O3 catalyst is already quite close to the best possible performance that could be achieved by an ideal catalyst. The latter would operate at the thermodynamic limit (highest possible yield), feature zero cost and reduce the compression needs to an optimal level according to the trade-off of compression duties vs. conversion discussed above. Keeping the input sources constant, the implementation of an ideal catalyst would save 6.0–16.7% or 6.2–12.6% of the calculated costs with or without externalities, respectively, where these percentages represent the differences between the processes labelled with real and ideal in each scenario in Fig. 3.
Consistently with other work, it is clear that producing cheap hydrogen as well as improving the efficiency in CO2 capture should become a priority for CO2-based methanol to become economically appealing.23 The contribution of catalyst and gaseous feedstock compression is of secondary importance at this stage, underlining the limited insights that could be gained by comparing Cu–ZnO–Al2O3 with other emerging catalytic materials at present. To make green methanol more attractive, taxes on CO2 emissions could be also envisaged, which are considered a crucial tool for economic analysis of climate policies.53 To compensate for the cost of hydrogen from the various sources, i.e., nuclear, solar and wind electricity, minimum taxes of 430.5, 527.8 and 1293.4 USD tCO2-eq−1 would be required, respectively. These values are substantially higher than the average estimated social cost of carbon,54i.e., 62.35 USD tCO2-eq−1. With the assumptions and limitations made, discussed in detail in the ESI(†), the process based on biomass-derived hydrogen releases a larger amount of CO2 than BAU, ruling out the application of a carbon tax.
To understand the prospects for CO2-based methanol, we estimated future hydrogen costs for different electricity costs and electrolysis technologies, i.e., AEC, PEMEC and SOEC. According to the values determined, the cost of methanol could drop to 0.72/0.85 USD kgMeOH−1 (wind), 0.74/1.09 USD kgMeOH−1 (solar) and 0.76/0.87 USD kgMeOH−1 (nuclear), without and with externalities, respectively (Fig. 4). Hence, methanol from hydrogen from electrolysis would outperform fossil methanol in the case of wind and nuclear electricity being applied, when considering externalities. Future trends will, therefore, make the role of the catalyst more predominant, increasing its share in the total cost up to 24.2%, which indicates the relevance of identifying catalysts based on cheap metals operating efficiently at lower pressures. It is worth noting that these results omit future fluctuations in the natural gas price due to geopolitical factors and/or resource scarcity, which would favour green methanol over the fossil one.
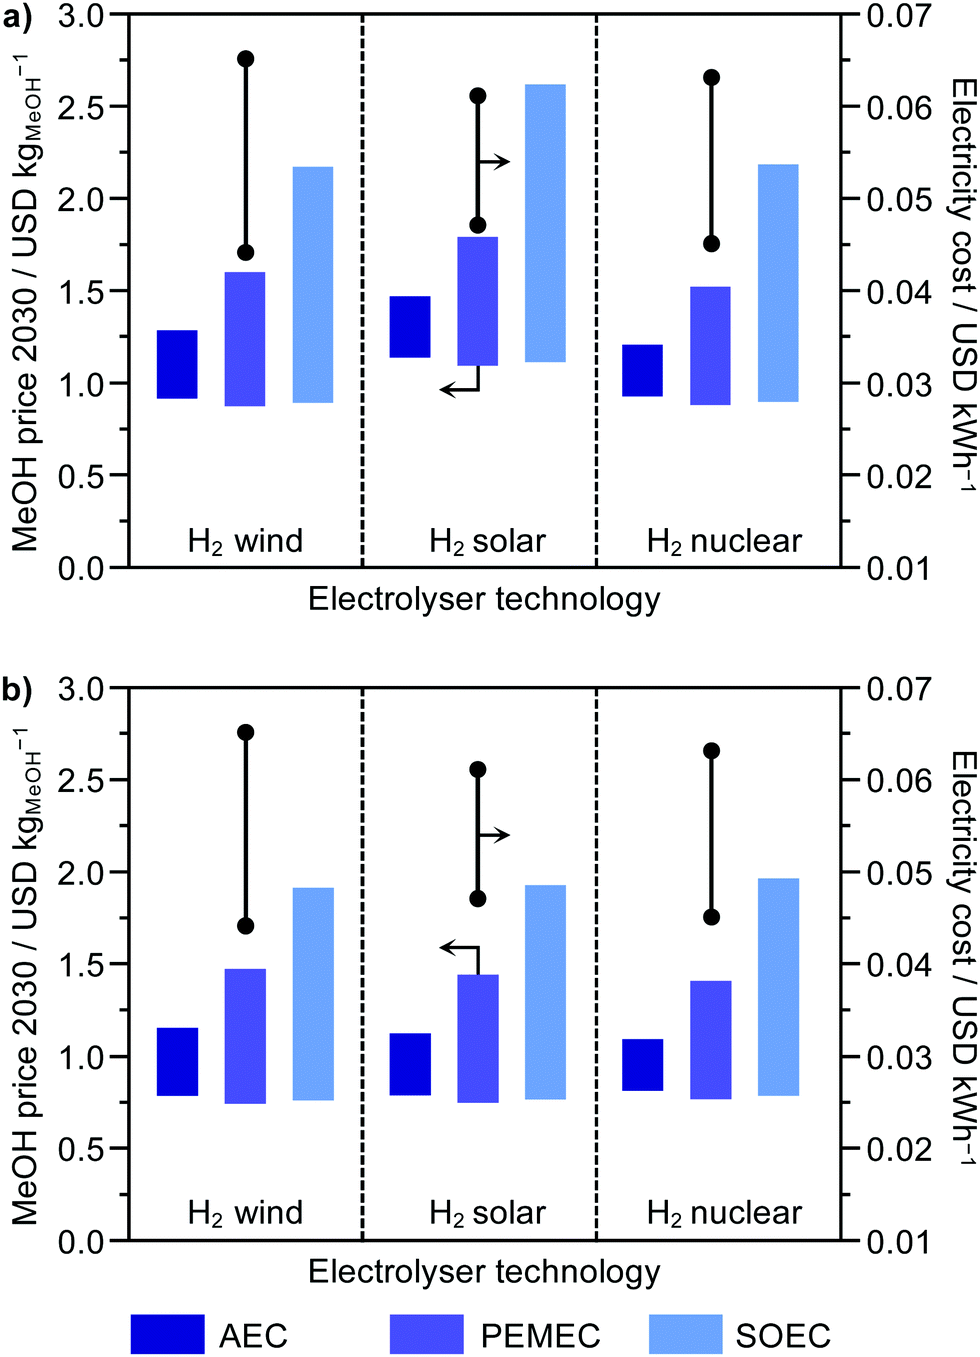 | ||
| Fig. 4 Projected methanol price in 2030 depending on the electrolyser technology and the electricity cost associated with the energy source applied in water splitting. The contribution of externalities is included in (a) and excluded in (b). | ||
Finally, new scenarios were defined to get insight into changes in CO2 procurement, the second most important methanol cost contributor, considering CO2 captured from NG power plants and through DAC (Fig. 3 and Fig. S3, ESI†). The use of NG point sources slightly increases the methanol cost (differences across technologies below 1.35% and 5.2% with and without externalities, respectively). In contrast, DAC, regarded as an essential future carbon mitigation strategy,55 worsens significantly the economic performance, i.e., 7.87–20.99% without externalities and 12.27–21.82% with externalities. This is because DAC consumes large amounts of electricity from the electricity mix, i.e., 366 kW h kgCO2−1, which is yet to be decarbonised (current carbon intensity of 0.71 kgCO2-eq kW h−1).
A detailed analysis of the LCA indicators (Fig. S1 and S2, ESI†) evidences the occurrence of burden shifting across alternatives, i.e., one impact becomes milder at the expense of worsening others. This happens at both the endpoint and midpoint levels. With regards to the breakdown of LCA impacts, hydrogen and CO2 emerge as the main contributors towards the endpoint indicators, in line with the analysis of externalities. Notably, the large externalities of methanol using hydrogen from biomass are explained by the LCA results, which show how the global warming potential of hydrogen from biomass is significantly higher than that from water electrolysis (Fig. S2b, ESI†). The biomass results are further discussed in the ESI† and should be taken with caution as they are highly dependent on the type of biomass and assumptions considered in the LCA analysis.
Green methanol as a potential sustainability enabler from a planetary boundary perspective
Acknowledging the limitations of standard LCAs and monetisation tools to assess absolute sustainability accurately, we investigated methanol production in the frame of PBs (Fig. 5 and Fig. S4, ESI†). The base picture was produced analysing the present impact of global natural and anthropogenic activities on the Earth systems considered. In this regard, previous studies2 showed that only three PBs (out of the eight considered here) are currently met, i.e., stratospheric ozone depletion, ocean acidification and fresh water use. Three others lie in the zone of uncertainty, i.e., atmospheric CO2 concentration, phosphorus flow and land-system change, and two are transgressed, i.e., energy imbalance and nitrogen flow. Focusing on the role of current methanol synthesis (Fig. 6), it is manifest that its shares in the total impact vary substantially across PBs. Values as high as 0.53–0.79% are observed in PBs strongly linked to CO2 emissions, namely, energy imbalance, atmospheric CO2 concentration and ocean acidification, while values as low as 6.22 × 10⁻⁶–6.81 × 10⁻³% are found in the others.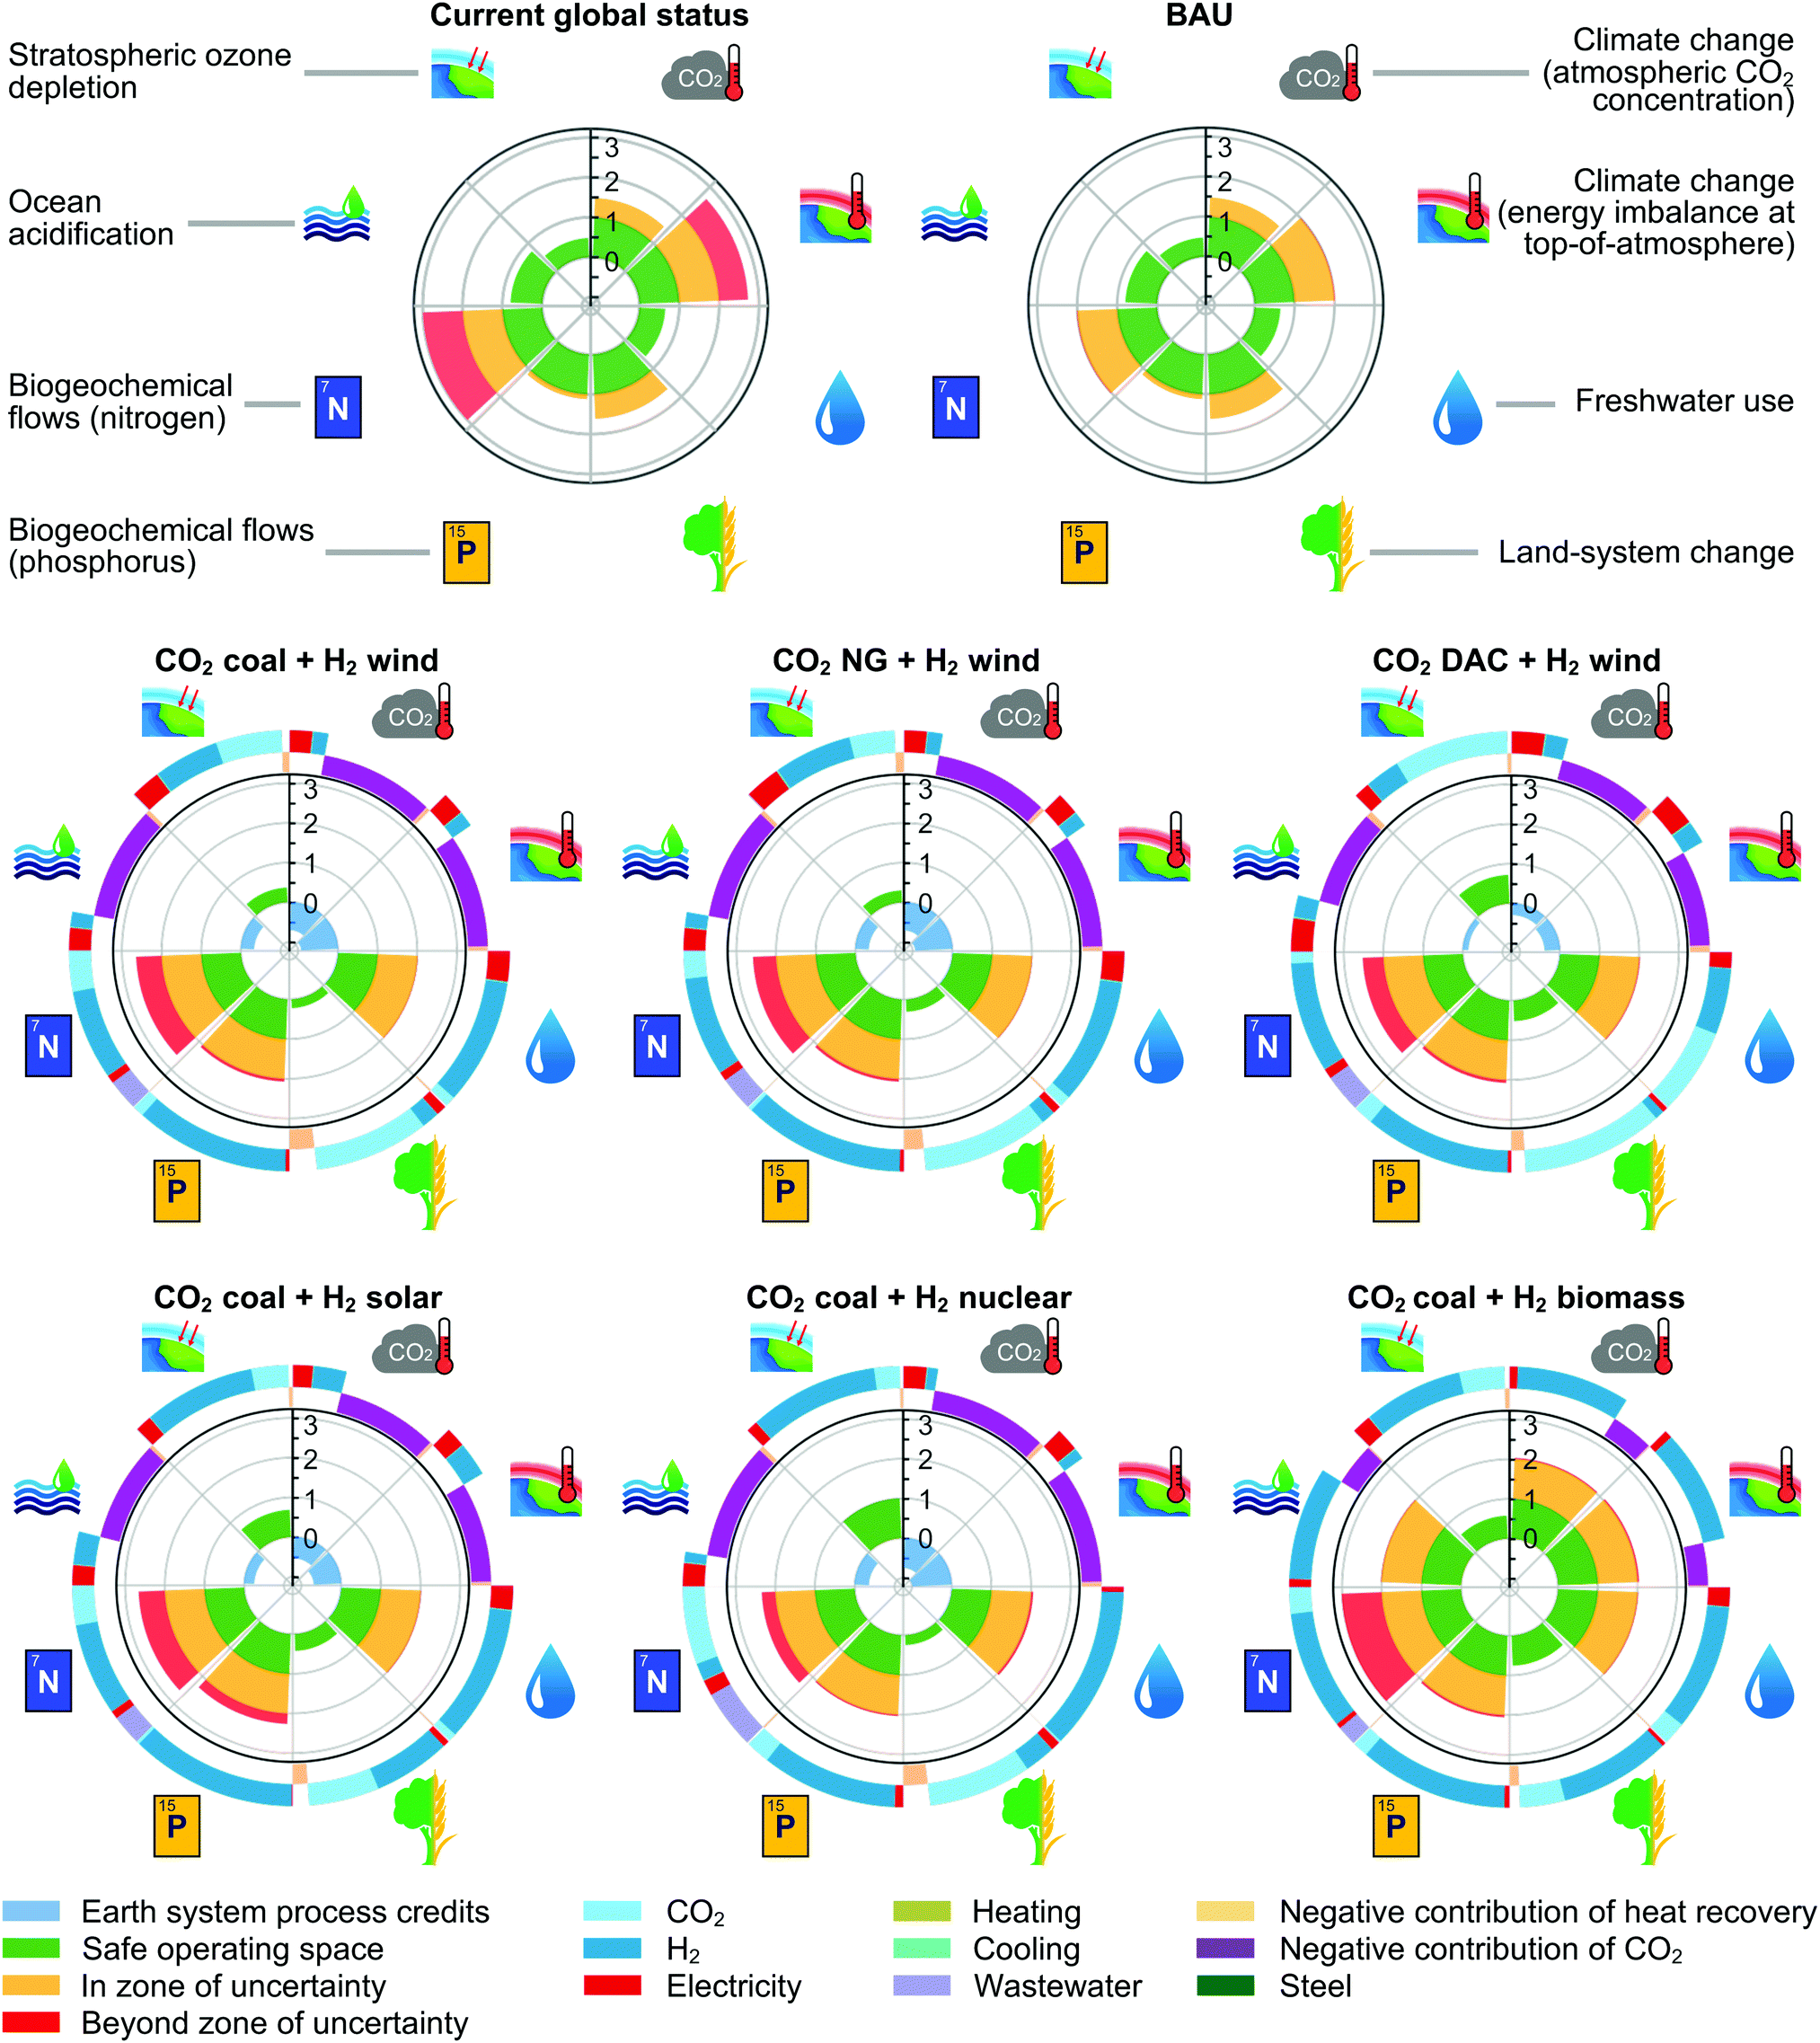 | ||
| Fig. 5 Current impact of global natural and anthropogenic activities and of fossil-based methanol production over the commercial Cu–ZnO–Al2O3 catalyst on the PBs, along with the performance of methanol processes using CO2 captured from coal power plants and renewable hydrogen from various sources and the same catalyst. For methanol using H2 from water electrolysis powered by wind, impacts are additionally presented with respect to the alternative use of CO2 captured from NG power plants and through DAC. For each technology, TTi values below zero are shown in violet, values between zero and one are depicted in green, and values above one are depicted either in yellow or red depending on whether the process lies in the zone of uncertainty or beyond it, respectively. The normalisation scheme applied, explained in the ESI,† scales TTi values above one considering the maximum level of transgression across technologies and Earth systems. Negative contributions, i.e., environmental credits, towards climate change and ocean acidification are associated with technologies that are carbon negative on a cradle-to-gate basis due to the use of captured CO2. The outer rings of the radar plots represent individual contributions of feedstocks and energy forms to the TTi values in each PB. | ||
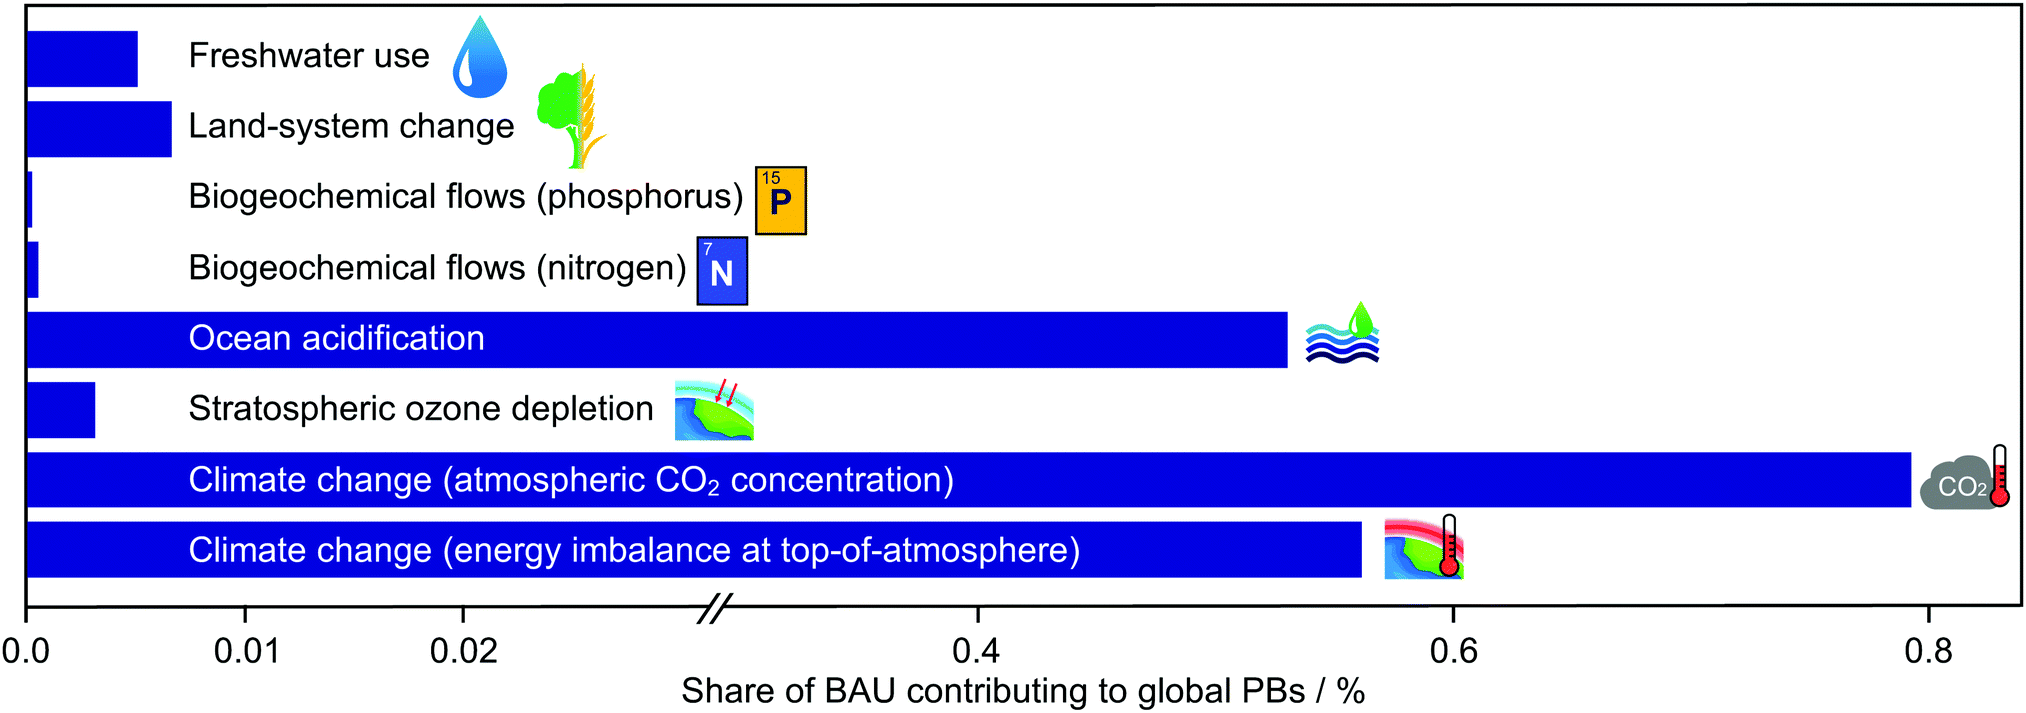 | ||
| Fig. 6 Share of the safe operating space allocated to methanol production in the different Earth-system processes. | ||
The level of transgression values TTi calculated for fossil-based methanol synthesis reveal that its absolute sustainability level mimics that of the planet, with only three PBs met, i.e., ocean acidification, stratospheric ozone depletion and freshwater use, in this case. This performance, explained by the status quo sharing principle applied, clearly highlights the need for more sustainable methanol production. CO2-based methanol technologies consuming hydrogen from water electrolysis increase the number of PBs met (Fig. 5) from three to five, i.e., energy imbalance, CO2 concentration, ocean acidification, land-system change and stratospheric ozone depletion. In contrast, methanol attained using hydrogen from biomass only meets two PBs, i.e., stratospheric ozone depletion and land-system change. Still, due to burden shifting there is some collateral damage when moving from fossil to green methanol. Indeed, CO2-based processes using hydrogen from water electrolysis improve energy imbalance, CO2 concentration, land-system change and ocean acidification, the former three now trespassing the safe zone. Still, this is accomplished at the expense of worsening the global nitrogen flow, already at high risk, fresh water use, in the safe zone, phosphorus flow, in the risk zone, and stratospheric ozone concentration (except in the case of methanol from hydrogen generated using wind, for which it improves), in the safe zone.
It could be argued that worsening water consumption and stratospheric ozone concentration, both in the safe space, should be of less concern. In contrast, negative side effects in the nitrogen flow and, to a lesser degree, the phosphorus flow might deserve further attention. However, the marginal role of methanol synthesis in the four Earth systems that can worsen upon implementing CO2-based technologies, i.e., 6.22 × 10⁻⁶–6.81 × 10⁻³%, suggests that the collateral damage of CO2-based methanol might be negligible in all four cases. Certainly, other sectors with larger shares of the safe operating space in those PBs could counterbalance the poor performance of green methanol, mitigating its unwanted side effects. Particularly, agricultural regions strongly utilising nitrogen- and phosphorus-based compounds, the main contributors towards the total anthropogenic impact in the global nitrogen and phosphorus flows,2 could trade quotas in these Earth systems in exchange for quotas in energy imbalance, CO2 concentration, and ocean acidification, where CO2-based methanol processes show much larger shares, i.e., 0.53–0.79%, and better performance. This would allow the agriculture industry to operate under less stringent CO2 limits, thereby benefiting from cost savings that would act as a strong incentive to spur cross-sectoral cooperation.
The PB breakdown (outer rings of the radar plots in Fig. 5) reveals that CO2 and hydrogen are the main contributors towards the total impact in all Earth-system processes (31.6–99.3%). Particularly, CO2 mostly affects climate change (18.0–76.1% in energy imbalance and 18.1–76.5% in CO2 concentration) and ocean acidification (18.1–76.6%), both PBs being strongly connected to CO2 emissions. The largest share of hydrogen generation is found in freshwater use (38.8–97.9%), linked mostly to biomass growth in biomass-based hydrogen, and to the use of water in both the operation of electrolysis technologies and the construction and operation of power generation systems for renewable energy.
The PB performance varies very little when considering CO2 from natural gas, but it worsens substantially when using DAC. Again, this is due to the high electricity demand of DAC, which is powered with the current electricity mix, yet to be decarbonised.
Overall, quantifying absolute sustainability through PBs uncovers the potential environmental benefits of CO2-based methanol. This approach goes beyond conventional LCA, mainly used for comparison purposes, by establishing unambiguously whether a technology is environmentally sustainable.
Conclusions
This study introduced a critical analysis of green methanol synthesis intertwining state-of-the-art methods and the first-time application of planetary boundaries to assess a chemical process, identifying and categorising the main technical barriers towards its wide implementation and discussing future plausible scenarios.Based on the conventional evaluation and omitting future prospects favouring CO2-based methanol, green methanol is economically unappealing due to the high price of renewable hydrogen. This holds even when externalities, i.e., indirect environmental costs, are considered. At present, green methanol could become economically competitive with respect to its fossil analogue by imposing a tax on CO2 of at least 430.50 USD tCO2-eq−1, ca. 5-fold higher than the average social cost of carbon.
Hence, future efforts should consider a hierarchy of priorities, where the most pressing target is rendering hydrogen production economically and environmentally more efficient via improvements in renewable energy generation and electrolysis technologies, calling for better catalysts for H2O splitting. A second need is the development of better processes, solvents and adsorbents to lower the cost of CO2 capture. Identifying catalytic technologies for methanol synthesis closer to the thermodynamic limit, although relevant, could be considered comparatively less urgent in the nearest term.
Future costs of hydrogen from water electrolysis will reduce the gap with fossil methanol, making CO2-based methanol economically appealing when externalities are considered. In contrast, replacing CO2 captured from coal plants or natural gas plants, which lead to similar performances, with CO2 from DAC will worsen the economic and environmental footprint of methanol substantially, unless DAC is powered by electricity with low-carbon intensity. Furthermore, the use of waste biomass for hydrogen production could also help make green methanol appealing, especially coupling gasification technologies with carbon capture and storage, which could render hydrogen from this source carbon negative. Limited biomass availability, however, will result in tough competition with electricity generation, particularly in view of the future role of biomass energy with carbon capture and storage (BECCS) in combatting climate change.
Extending the assessment from the plant to the planet level provided insight out of the reach of conventional tools. LCA failed to determine whether methanol is environmentally sustainable, while monetisation wrongly showed that fossil-based methanol is superior even when considering monetised impacts. PBs, on the contrary, led to a radically different picture by uncovering the potential role of CO2-based methanol in avoiding the transgression of climate change. This core planetary boundary, currently surpassed by fossil-based methanol, could by itself lead to a new state of the Earth system. Due to inherent trade-offs between Earth systems, replacing traditional methanol by the green alternative based on water electrolysis would mostly negatively influence the global nitrogen and phosphorus flows, and freshwater use. This collateral damage is negligible considering the more pronounced positive effects on energy imbalance, atmospheric CO2 concentration and ocean acidification.
In view of our results, cross-sectoral cooperation emerges as a necessary strategy to counterbalance side detrimental impacts. This could help to more effectively handle multiple ecological limits simultaneously by exploiting the asymmetric shares of technologies in Earth systems. The type and extent of the optimal cross-sectoral cooperation needed will depend upon how economic sectors, including the chemical industry, will transition towards a more sustainable economy. Green methanol, in particular, will very likely become an essential chemical, and might be ultimately fully produced from CO2 obtained via direct air capture (once the electricity mix is decarbonised) or biogenic point sources to close the carbon loop. In this context, the temporal evolution of electricity mixes, CO2 sources available, and natural gas and hydrogen prices will dictate the best plan, considering global ecological limits and economic and social criteria.
Overall, this work highlights the need to improve current environmental assessments to embrace absolute sustainability criteria, and drive decisions in technology development across scales and more effectively. By underpinning systems evaluation with the concept of PBs, the potential role of emerging technologies can be appreciated in its full world-wide scope. Furthermore, technical barriers and improvement opportunities can be identified more easily, minimising the risk of overshadowing local scenarios. This will ultimately guide future research and policy making in a much more sensible manner than possible at the present stage.
Conflicts of interest
There are no conflicts of interest to declare.Note added after first publication
This article replaces the version published on 27th September 2019. Fig. 5 and 6 and some of the text associated with these figures have been amended.Acknowledgements
The authors thank Dr V. Tulus for his help in the preparation of some of the figures of the manuscript. Gonzalez-Garay acknowledges the financial support granted by the Mexican ‘Consejo Nacional de Ciencia y Tecnologia (CONACyT)’ through the scholarship 411906.Notes and references
- J. Rockström, W. Steffen, K. Noone, Å. Persson, F. S. Chapin, E. F. Lambin, T. M. Lenton, M. Scheffer, C. Folke, H. J. Schellnhuber, B. Nykvist, C. A. de Wit, T. Hughes, S. van der Leeuw, H. Rodhe, S. Sörlin, P. K. Snyder, R. Costanza, U. Svedin, M. Falkenmark, L. Karlberg, R. W. Corell, V. J. Fabry, J. Hansen, B. Walker, D. Liverman, K. Richardson, P. Crutzen and J. A. Foley, Nature, 2009, 461, 472–475 CrossRef PubMed
.
- W. Steffen, K. Richardson, J. Rockström, S. E. Cornell, I. Fetzer, E. M. Bennett, R. Biggs, S. R. Carpenter, W. de Vries, C. A. de Wit, C. Folke, D. Gerten, J. Heinke, G. M. Mace, L. M. Persson, V. Ramanathan, B. Reyers and S. Sorlin, Science, 2015, 347, 1–11 CrossRef
- UNSD, The sustainable development goals report 2017, 2017.
- K. Chin, D. Schuster, D. Tanzil, B. Beloff and C. Cobb, Chem. Eng. Prog., 2015, 36–40 Search PubMed
- M. Carmo, D. L. Fritz, J. Mergel and D. Stolten, Int. J. Hydrogen Energy, 2013, 38, 4901–4934 CrossRef CAS
- M. R. Shaner, H. A. Atwater, N. S. Lewis and E. W. McFarland, Energy Environ. Sci., 2016, 9, 2354–2371 RSC
- A. J. Martín, T. Shinagawa and J. Pérez-Ramírez, Chem, 2019, 5, 263–283 Search PubMed
- E. V. Kondratenko, G. Mul, J. Baltrusaitis, G. O. Larrazábal and J. Pérez-Ramírez, Energy Environ. Sci., 2013, 6, 3112–3135 RSC
- A. Otto, T. Grube, S. Schiebahn and D. Stolten, Energy Environ. Sci., 2015, 8, 3283–3297 RSC
- A. Álvarez, A. Bansode, A. Urakawa, A. V. Bavykina, T. A. Wezendonk, M. Makkee, J. Gascon and F. Kapteijn, Chem. Rev., 2017, 117, 9804–9838 CrossRef PubMed
- O. Martin, A. J. Martín, C. Mondelli, S. Mitchell, T. F. Segawa, R. Hauert, C. Drouilly, D. Curulla-Ferré and J. Pérez-Ramírez, Angew. Chem., Int. Ed., 2016, 55, 6261–6265 CrossRef CAS PubMed
- J. Wang, G. Li, Z. Li, C. Tang, Z. Feng, H. An, H. Liu, T. Liu and C. Li, Sci. Adv., 2017, 3, e1701290 CrossRef PubMed
- C. Vogt, E. Groeneveld, G. Kamsma, M. Nachtegaal, L. Lu, C. J. Kiely, P. H. Berben, F. Meirer and B. M. Weckhuysen, Nat. Catal., 2018, 1, 127–134 CrossRef CAS
- G. Prieto, ChemSusChem, 2017, 10, 1056–1070 CrossRef CAS PubMed
- O. Schmidt, A. Gambhir, I. Staffell, A. Hawkes, J. Nelson and S. Few, Int. J. Hydrogen Energy, 2017, 42, 30470–30492 CrossRef CAS
- A. Behr, Angew. Chem., Int. Ed., 2014, 53, 12674 CrossRef CAS
- I. Yarulina, A. D. Chowdhury, F. Meirer, B. M. Weckhuysen and J. Gascon, Nat. Catal., 2018, 1, 398–411 CrossRef CAS
- M. Behrens, Angew. Chem., Int. Ed., 2016, 55, 14906–14908 CrossRef CAS PubMed
- M. S. Frei, C. Mondelli, R. García-Muelas, K. S. Kley, B. Puértolas, N. López, O. V. Safonova, J. A. Stewart, D. Curulla Ferré and J. Pérez-Ramírez, Nat. Commun., 2019, 10, 3377 CrossRef PubMed
- M. S. Duyar, C. Tsai, J. L. Snider, J. A. Singh, A. Gallo, J. S. Yoo, A. J. Medford, F. Abild-Pedersen, F. Studt, J. Kibsgaard, S. F. Bent, J. K. Nørskov and T. F. Jaramillo, Angew. Chem., Int. Ed., 2018, 57, 15045–15050 CrossRef CAS PubMed
- M. M.-J. Li, C. Chen, T. Ayvalı, H. Suo, J. Zheng, I. F. Teixeira, L. Ye, H. Zou, D. O’Hare and S. C. E. Tsang, ACS Catal., 2018, 8, 4390–4401 CrossRef CAS
- J. S. Luterbacher, J. M. Rand, D. M. Alonso, J. Han, J. T. Youngquist, C. T. Maravelias, B. F. Pfleger and J. A. Dumesic, Science, 2014, 343, 277–280 CrossRef CAS PubMed
- M. Pérez-Fortes, J. C. Schöneberger, A. Boulamanti and E. Tzimas, Appl. Energy, 2016, 161, 718–732 CrossRef
- N. Von Der Assen, J. Jung and A. Bardow, Energy Environ. Sci., 2013, 6, 2721–2734 RSC
- N. Von Der Assen, P. Voll, M. Peters and A. Bardow, Chem. Soc. Rev., 2014, 43, 7982–7994 RSC
- R. M. Cuéllar-Franca and A. Azapagic, J. CO2 Util., 2015, 9, 82–102 CrossRef
- L. K. Rihko-Struckmann, A. Peschel, R. Hanke-Rauschenbach and K. Sundmacher, Ind. Eng. Chem. Res., 2010, 49, 11073–11078 CrossRef CAS
- F. Pontzen, W. Liebner, V. Gronemann, M. Rothaemel and B. Ahlers, Catal. Today, 2011, 171, 242–250 CrossRef CAS
- J. Kim, C. A. Henao, T. A. Johnson, D. E. Dedrick, J. E. Miller, E. B. Stechel and C. T. Maravelias, Energy Environ. Sci., 2011, 4, 3122–3132 RSC
- É. S. Van-Dal and C. Bouallou, J. Cleaner Prod., 2013, 57, 38–45 CrossRef
- M. T. Luu, D. Milani, A. Bahadori and A. Abbas, J. CO2 Util., 2015, 12, 62–76 CrossRef CAS
- M. Matzen and Y. A. Demirel, J. Cleaner Prod., 2016, 139, 1068–1077 CrossRef CAS
- M. Martín and I. E. Grossmann, AIChE J., 2012, 58, 1538–1549 CrossRef
- H. A. Daggash, C. F. Patzschke, C. F. Heuberger, L. Zhu, K. Hellgardt, P. S. Fennell, A. N. Bhave, A. Bardow and N. Mac Dowell, Sustainable Energy Fuels, 2018, 2, 1153–1169 RSC
- J. D. Medrano, R. Ruiz-Femenia and J. A. Caballero, Comput. -Aided Chem. Eng., 2017, 40, 721–726 CrossRef
- M. W. Ryberg, M. Owsianiak, J. Clavreul, C. Mueller, S. Sim, H. King and M. Z. Hauschild, Sci. Total Environ, 2018, 634, 1406–1416 CrossRef CAS PubMed
- K. M. Vanden Bussche and G. F. Froment, J. Catal., 1996, 161, 1–10 CrossRef CAS
- W. L. Luyben, Ind. Eng. Chem. Res., 2010, 49, 6150–6163 CrossRef CAS
- A. Gonzalez-Garay and G. Guillen-Gosalbez, Chem. Eng. Res. Des., 2018, 137, 1711–1716 CrossRef
- B. P. Weidema, J. Ind. Ecol., 2015, 19, 20–26 CrossRef CAS
- A. Susmozas, D. Iribarren and J. Dufour, Resources, 2015, 4, 398–411 CrossRef
- V. Utgikar and T. Thiesen, Int. J. Hydrogen Energy, 2006, 31, 939–944 CrossRef CAS
- E. Cetinkaya, I. Dincer and G. F. Naterer, Int. J. Hydrogen Energy, 2012, 37, 2071–2080 CrossRef CAS
- P. L. Spath and M. K. Mann, Life Cycle Assessment of Renewable Hydrogen Production via Wind/Electrolysis Milestone Completion Report, 2004.
-
J. Guinée, M. Gorrée and R. Heijungs, Handbook on life cycle assessment, Springer, Netherlands, 2002 Search PubMed
- G. Wernet, C. Bauer, B. Steubing, J. Reinhard, E. Moreno-Ruiz, B. B. Weidema, R. Zah and W. Org, Int. J. Life Cycle Assess., 2016, 21, 1218–1230 CrossRef
- PRé Consultants, SimaPro Database and software, https://simapro.com/, accessed 16 September 2019.
- M. A. J. Huijbregts, Z. J. N. Steinmann, P. M. F. Elshout, G. Stam, F. Verones, M. Vieira, M. Zijp, A. Hollander and R. van Zelm, Int. J. Life Cycle Assess., 2017, 22, 138–147 CrossRef
- M. W. Ryberg, M. Owsianiak, K. Richardson and M. Z. Hauschild, Ecol. Indic., 2018, 88, 250–262 CrossRef
- I. M. Algunaibet, C. Pozo, Á. Galán-Martín, M. A. J. Huijbregts, N. Mac Dowell and G. Guillén-Gosálbez, Energy Environ. Sci., 2019, 12, 1890–1900 RSC
- M. Grasso, Polit. Stud., 2012, 60, 668–686 CrossRef
- I. M. Algunaibet and G. Guillén-Gosálbez, J. Cleaner Prod., 2019, 229, 886–901 CrossRef
- W. Pizer, M. Adler, J. Aldy, D. Anthoff, M. Cropper, K. Gillingham, M. Greenstone, B. Murray, R. Newell, R. Richels, A. Rowell, S. Waldhoff and J. Wiener, Science, 2014, 346, 1189–1190 CrossRef CAS PubMed
- P. Wang, X. Deng, H. Zhou and S. Yu, J. Cleaner Prod., 2019, 209, 1494–1507 CrossRef
- W. A. Smith, T. Burdyny, D. A. Vermaas and H. Geerlings, Joule, 2019, 3, 1822–1834 CrossRef CAS
Footnote |
| † Electronic supplementary information (ESI) available: Details and results of the modelling and life-cycle assessment of fossil- and CO2-based methanol synthesis. See DOI: 10.1039/c9ee01673b |
| This journal is © The Royal Society of Chemistry 2019 |