
The nature of active centers catalyzing oxygen electro-reduction at platinum surfaces in alkaline media†
Yunchang
Liang‡
 a,
David
McLaughlin‡
a,
Christoph
Csoklich
a,
Oliver
Schneider
b and
Aliaksandr S.
Bandarenka
*acd
a,
David
McLaughlin‡
a,
Christoph
Csoklich
a,
Oliver
Schneider
b and
Aliaksandr S.
Bandarenka
*acd
aPhysik-Department ECS, Technische Universität München, James-Franck-Straße 1, D-85748 Garching, Germany
bInstitut für Informatik VI, Technische Universität München, Schleißheimer Straße 90a, 85748 Garching, Germany
cNanosystems Initiative Munich (NIM), Schellingstraße 4, 80799 Munich, Germany
dCatalysis Research Center, TUM, Ernst-Otto-Fischer-Straße 1, 85748 Garching, Germany. E-mail: bandarenka@ph.tum.de
First published on 4th December 2018
Abstract
Energy conversion devices that use OH-conducting electrolytes are becoming more and more attractive with recent substantial progress in the development and commercialization of relevant membrane materials and systems. However, the activities of numerous catalysts towards oxygen electro-reduction taking place at the cathodes of such devices in alkaline media are surprisingly different from those in acidic electrolytes. This is for instance the case for Pt and Pt-alloy electrodes, which demonstrate unexpected and drastic variations in activity depending on the electrolyte pH and surface structure. Here we apply recently introduced electrochemical scanning tunnelling microscopy noise measurements to directly identify active centers at Pt(111)-based surfaces in three alkaline electrolytes (LiOH, KOH and CsOH) under reaction conditions. For all three solutions it was found that the most active sites are located on the Pt(111) terraces, in contrast to the acidic media, where concave defects significantly increase the oxygen reduction activity. These defect-centers are to all practical purposes deactivated in alkaline media. This not only explains the above-mentioned activity differences between acidic and alkaline electrolytes but also suggests strategies to design nanostructured Pt-electrocatalysts for applications at high pH values.
Broader contextAn improved understanding of electrocatalytic reactions is important for energy conversion. Not all surface atoms of a given catalyst show the same activity towards a specific reaction, but there are “active sites” which have a much larger activity than other surface atoms. The identification of these sites guides the design of improved catalysts. Recently, a method for direct visualization of the local catalytic activity based on electrochemical scanning tunnelling microscopy (ECSTM) has been introduced, where the local noise in the tunnelling current is correlated with local reactivity (n-ECSTM). For the oxygen reduction reaction (ORR) in acidic solutions, step edges are especially active. This was directly confirmed with n-ECSTM. Less is known about the ORR activity of Pt in alkaline solutions. Surfaces with defects are less active than Pt(111) and much less active than in acidic electrolyte. The choice of alkali cation affects the catalytic activity as well. In this work, the activity of Pt(111) with steps was studied in three representative alkali hydroxide electrolytes with n-ECSTM. The results showed that in all cases the (111) terraces demonstrate the largest ORR activity, without any enhancement at step edges, thus explaining the superior performance of Pt(111) compared to stepped surfaces. |
Introduction
The oxygen reduction reaction (ORR) overpotential is a major loss mechanism in fuel cells and metal air batteries.1,2 Furthering our understanding of this reaction is an important stepping stone towards developing new and improved catalysts for this reaction.3,4 Unravelling the mystery surrounding the nature of so-called active catalytic centers at the surface of ORR electrocatalysts is key to this objective.5,6 Unfortunately, current procedures for the identification of the relevant catalytic sites in heterogeneous (electro)catalysis are typically indirect and very time consuming. Therefore, the nature of active centers is elucidated only for a limited number of catalytic surfaces and reactions. On the other hand, the recently introduced methodology of electrochemical scanning tunnelling microscopy noise measurements (n-ECSTM) provides a powerful tool to aid in the direct identification of centers of catalytic activity.7The activities of platinum-based catalysts towards oxygen reduction have been shown for some time already to vary depending on the crystal structure and facet of the surface.8,9 For acidic media a full set of congruent results has been produced. Macroscopic evidence pointing towards the heightened activity of specific “higher-coordinated” sites has been presented recently.10,11 This aligns well with theoretical predictions that estimate near optimal binding energy for the ORR-intermediates at the concave Pt defect sites, e.g., near concave sites at steps.12,13 Lastly, microscopic evidence stemming from the above mentioned n-ECSTM measurements has underpinned these findings.7 Thus the nature of the active sites for the oxygen reduction reaction at Pt surfaces is relatively well understood in acidic media.
For alkaline media no such canon has been established yet. In 0.1 M NaOH, Pt(100) and Pt(110) show a much lower activity than Pt(111).14 Pt(111) shows the maximum activity in 0.1 M NaOH, as large as in 0.1 M HClO4.10 Macroscopic activity measurements using stepped Pt(hkl) single crystal electrodes with a maximum density of concave sites in alkaline solutions point towards the conclusion that the activity decreases with increasing the amount of step defects. This is the complete opposite of what is found for acidic media.14 Therefore, the activity of these surfaces is lower than the one of Pt(111), and much lower compared to 0.1 M HClO4.11,14 From these findings, it was concluded that in alkaline solution the activity of steps is negligible, and that adsorbed OH is a key species in the mechanism.14 pH dependent measurements carried out in suitable buffer solutions have been performed, showing a volcano curve for Pt(111) with the extrapolated maximum activity around pH = 9.15 At this pH, the onset potential for the ORR lies in the region of the potential of zero total charge, and thus a disordered water structure may facilitate the reaction.15 Additionally, the surface is covered by weakly adsorbed OH that desorbs when lowering the potential. On Pt(100) and Pt(110), on the other hand, OH is bound stronger, and the activity decreases with pH.15
Furthermore, it has been demonstrated that the activity varies not only with the pH value of the electrolyte but depends also on the cation of the base.16,17 This so-called cation effect is theorized to be related to indirect interaction of the spectator species with the interfacial water layers and adsorbed species.16 For instance, the ORR activity of Pt(111) model electrodes is at least two times higher at 0.9 V (RHE) in KOH and CsOH electrolytes compared to HClO4 solutions.18,19
Alternatives to platinum group metal catalysts have achieved activities in excess of bulk Pt in alkaline media.20 Nevertheless, Pt-based catalysts remain relevant for alkaline oxygen reduction. Recent publications indicate that for Cu-Pt(111) alloys in both 0.1 M NaOH and especially 0.1 M KOH, ORR activities greater than those found for Pt(111) in HClO4 can be achieved.21 It is thus necessary to investigate the electrolyte effect on the active sites of Pt surfaces in alkaline media.
In this work we use n-ECSTM to identify active ORR-centers of Pt(111)-based electrodes in contact with LiOH, KOH and CsOH electrolytes and compare the results with those obtained in HClO4 solutions. We intend to provide the first microscopic result on this matter, thus contributing another piece to the vexing puzzle that is the identification of surface sites responsible for high catalytic activity.
Experimental procedures
All experiments presented in this work were performed using a Pt(111) single crystal (MaTecK, 5 mm diameter). In preparation of the EC-STM studies, the crystal was treated using the procedure described by Kibler et al.22 This assures good uniformity of the Pt(111) terraces while at the same time guaranteeing the presence of some monoatomic step-like defects. All n-ECSTM experiments were carried out using a MultiMode (Veeco Instruments Inc.) scanning probe microscope, in tandem with a NanoScope III controller with potential control provided by a Universal Bipotentiostat (Veeco Instruments Inc.). All tips were prepared by mechanical cutting of a Pt/Ir alloy wire (GoodFellow, Pt80/Ir20, 0.25 mm). The tips were insulated with wax (Apiezon) following the procedure of Nagahara et al.23 The freshly prepared crystal was mounted in the bottom of a Teflon-made EC-STM cell. The alkaline electrolytes used were prepared and stored exclusively in PFA-containers to prevent contaminants from the glassware. Platinum wires (MaTecK, 0.5 mm) were inserted into the electrolyte as both pseudo-reference and counter electrodes for the n-ECSTM experiments. Spatial limitations did not permit the use of a true reference electrode and conversion of the potential scale to RHE. The electrochemical active surface area of the Pt(111) electrode determined in Ar-saturated 0.1 M HClO4 in a large cell using a commercial reference electrode is ∼0.198 cm2, which is similar to the geometric surface area of the electrode. In the EC-STM cell, due to the cell design, part of the electrode surface is covered by the sealing ring to prevent electrolyte leakage. The effective surface area of the electrode is ∼0.127 cm2. No atmospheric control of the electrolytes was implemented, due to the technical limitations of the measurement apparatus. Additionally, no retrofitting was performed in an effort to avoid additional (non-reaction-related) noise. Thus air saturated electrolyte was used, as opposed to oxygen saturated electrolyte. This is in tune with test procedures for fuel cell cathodes and most real world fuel cell applications.24,25Ultrapure water (18.2 MΩ) from an Evoqua Ultra Clear 10 TWF 30 UV (Evoqua, Germany) water purification system, LiOH (99.995%, metals basis, Alfa Aesar), KOH (99.99%, Trace Metal Basis, Sigma Aldrich) and CsOH (99.9%, 50 wt% solution, Sigma Aldrich) were used to prepare the electrolytes.
Further details on the n-ECSTM measurement schemes can be found elsewhere,7 a brief explanation will, however, be provided at this point. In this work, we applied the technique of electrochemical scanning tunnelling noise measurements for the determination of active sites.7 The principle of the method is illustrated in Fig. 1. It is based on the notion that the properties of the tunnelling barrier will be perturbed by reaction activity at the surface. The tunnelling barrier has been shown to be very sensitive to adsorbates in the tunnelling gap,26 molecules diffusing in and out of the gap27 and the local water structure.28 The degree of disturbance should be reflected in the degree of fluctuation of the measured EC-STM signal, as it is schematically shown in Fig. 1A and B. Thus, close to the catalytically active centers one expects higher noise levels in the tunnelling current due to stronger changes in the chemical composition in the tunnelling gap. The analysis of the noise can be quantified by noise histograms (as schematically explained in Fig. 1A and B) or distribution of derivatives of the height traces. By comparing the histograms or distributions, it is possible to assess the magnitude of the perturbations more objectively.
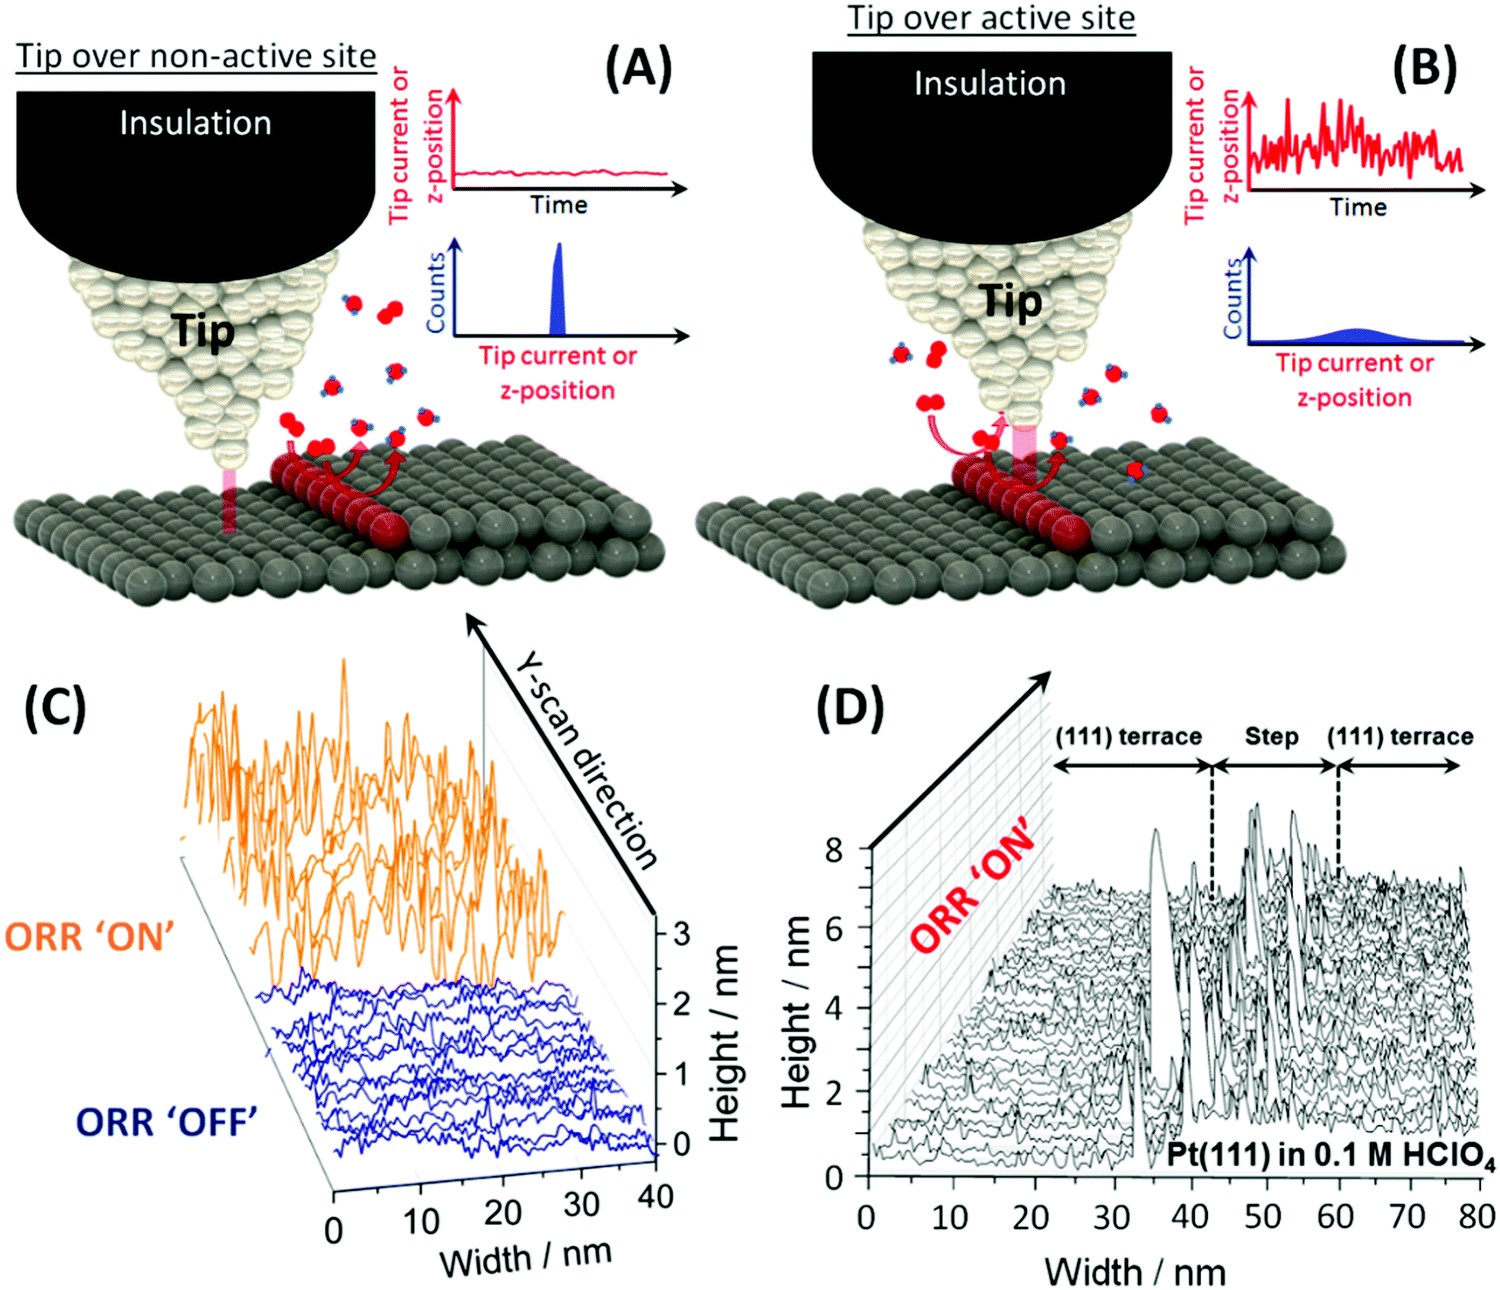 | ||
| Fig. 1 Illustration of the principle of the n-ECSTM measurements. (A) The tip is far from an active center. The tip current or z-position shows weak fluctuation with time with a narrow distribution of current or z values. (B) The tip is over an active center with the tip current or z-position fluctuating strongly with time with a broad distribution of the tip current or z values. (C) The ORR reaction “visualization” via the potential control of an active Pt(111) terrace in an air-saturated 0.1 M HClO4 electrolyte. When the reaction is “OFF”, i.e. the sample potential is too positive to permit the reduction of O2 molecules, the scans reproduce the topography. When the reaction is “ON”, i.e. when the sample potential is negative enough to reduce oxygen, significant tunnelling noise perturbs the topographical scans.7 (D) The result of n-ECSTM measurements in acidic media (air-saturated 0.1 M HClO4) for a step defect between two Pt(111) terraces. The noise level is substantially higher at the step defect7 than over the terraces illustrating the fact that the steps contribute to the Pt ORR activity in acidic media more strongly, compared to the terraces. Adapted from ref. 7. | ||
One simple illustrative example is shown in Fig. 1C, where n-ECSTM measurements were performed over a Pt(111) terrace in an air-saturated 0.1 M HClO4 electrolyte. When the potential of the sample is not negative enough to reduce the dissolved oxygen molecules (“reaction OFF”), the noise level is moderate, and the tip scans reflect surface topography. If the sample potential is shifted towards more negative potentials so that reduction of O2 is possible (“reaction ON”), the level of noise is significantly increased.
One can also obtain details on the relative contribution of different surface imperfections and flat Pt(111) terraces to the overall ORR activity. Fig. 1D shows an example of n-ECSTM measurements on a position with a step in between of two Pt(111) terraces under ORR reaction conditions in air-saturated 0.1 M HClO4: the noise level at the step is significantly higher compared to the terraces suggesting larger contribution of the imperfections at the step to the overall activity. Therefore, from the analysis of Fig. 1C and D, one can conclude that the more steps are present at the surface of platinum electrodes in acidic media, the higher the overall ORR activity. That is exactly what is observed experimentally using space averaging macroscopic measurements at model stepped single crystal electrodes.13,29,30
Results and discussion
In the following, the results for n-ECSTM studies of a Pt(111) catalyst in three electrolytes (0.1 M KOH, 0.1 M LiOH and 0.1 M CsOH) will be presented. The procedure was in all cases as described above; the only difference between the measurements being the electrolyte. The choice of electrolytes follows from the consideration of the activity trends for alkali metal cations: the activity rises monotonically with cation size for Pt(111).16 For stepped single crystals the highest activity is found for KOH, with lower activity for NaOH and CsOH and the lowest activity for LiOH and RbOH.19 In an effort to probe the edges of the spectrum as well as an intermediate value in both of these hierarchies, LiOH, KOH and CsOH were chosen. Thus, if any strong difference can be observed between the electrolytes the differences are likely to be most visible due to the large variation in size and activity.The potentials named “ON” or “OFF” were determined by inspection via cyclic voltammetry measured in the EC-STM cell. The recorded voltammograms can be found in the ESI.† No conversion of the potential values to the RHE scale was made due to the use of a pseudo reference electrode.
Fig. 2 shows the results of n-ECSTM measurements performed using the Pt(111) electrode in the air-saturated 0.1 M KOH electrolytes. Fig. 2A demonstrates a monoatomic step between two flat terraces under the “reaction ON” and “reaction OFF” conditions. The potential of the sample was shifted between these two values during the scan. As can be seen from this figure, noise features reversibly appear and disappear, similar to the situation shown in Fig. 1C. However, one can also notice that in contrast to the situation illustrated in Fig. 1D, the step defect does not demonstrate any enhanced noise features in the alkaline medium. A much more uniform distribution of noise under reaction conditions compared to the acidic media is well visible also in Fig. 2B. The uniform distribution of the noise is even more striking when considering the individual traces at the step edge (Fig. 2C and D). In stark contrast to the measurements presented for acidic media, there is no increase in the tunnelling noise in the vicinity of the step edge.
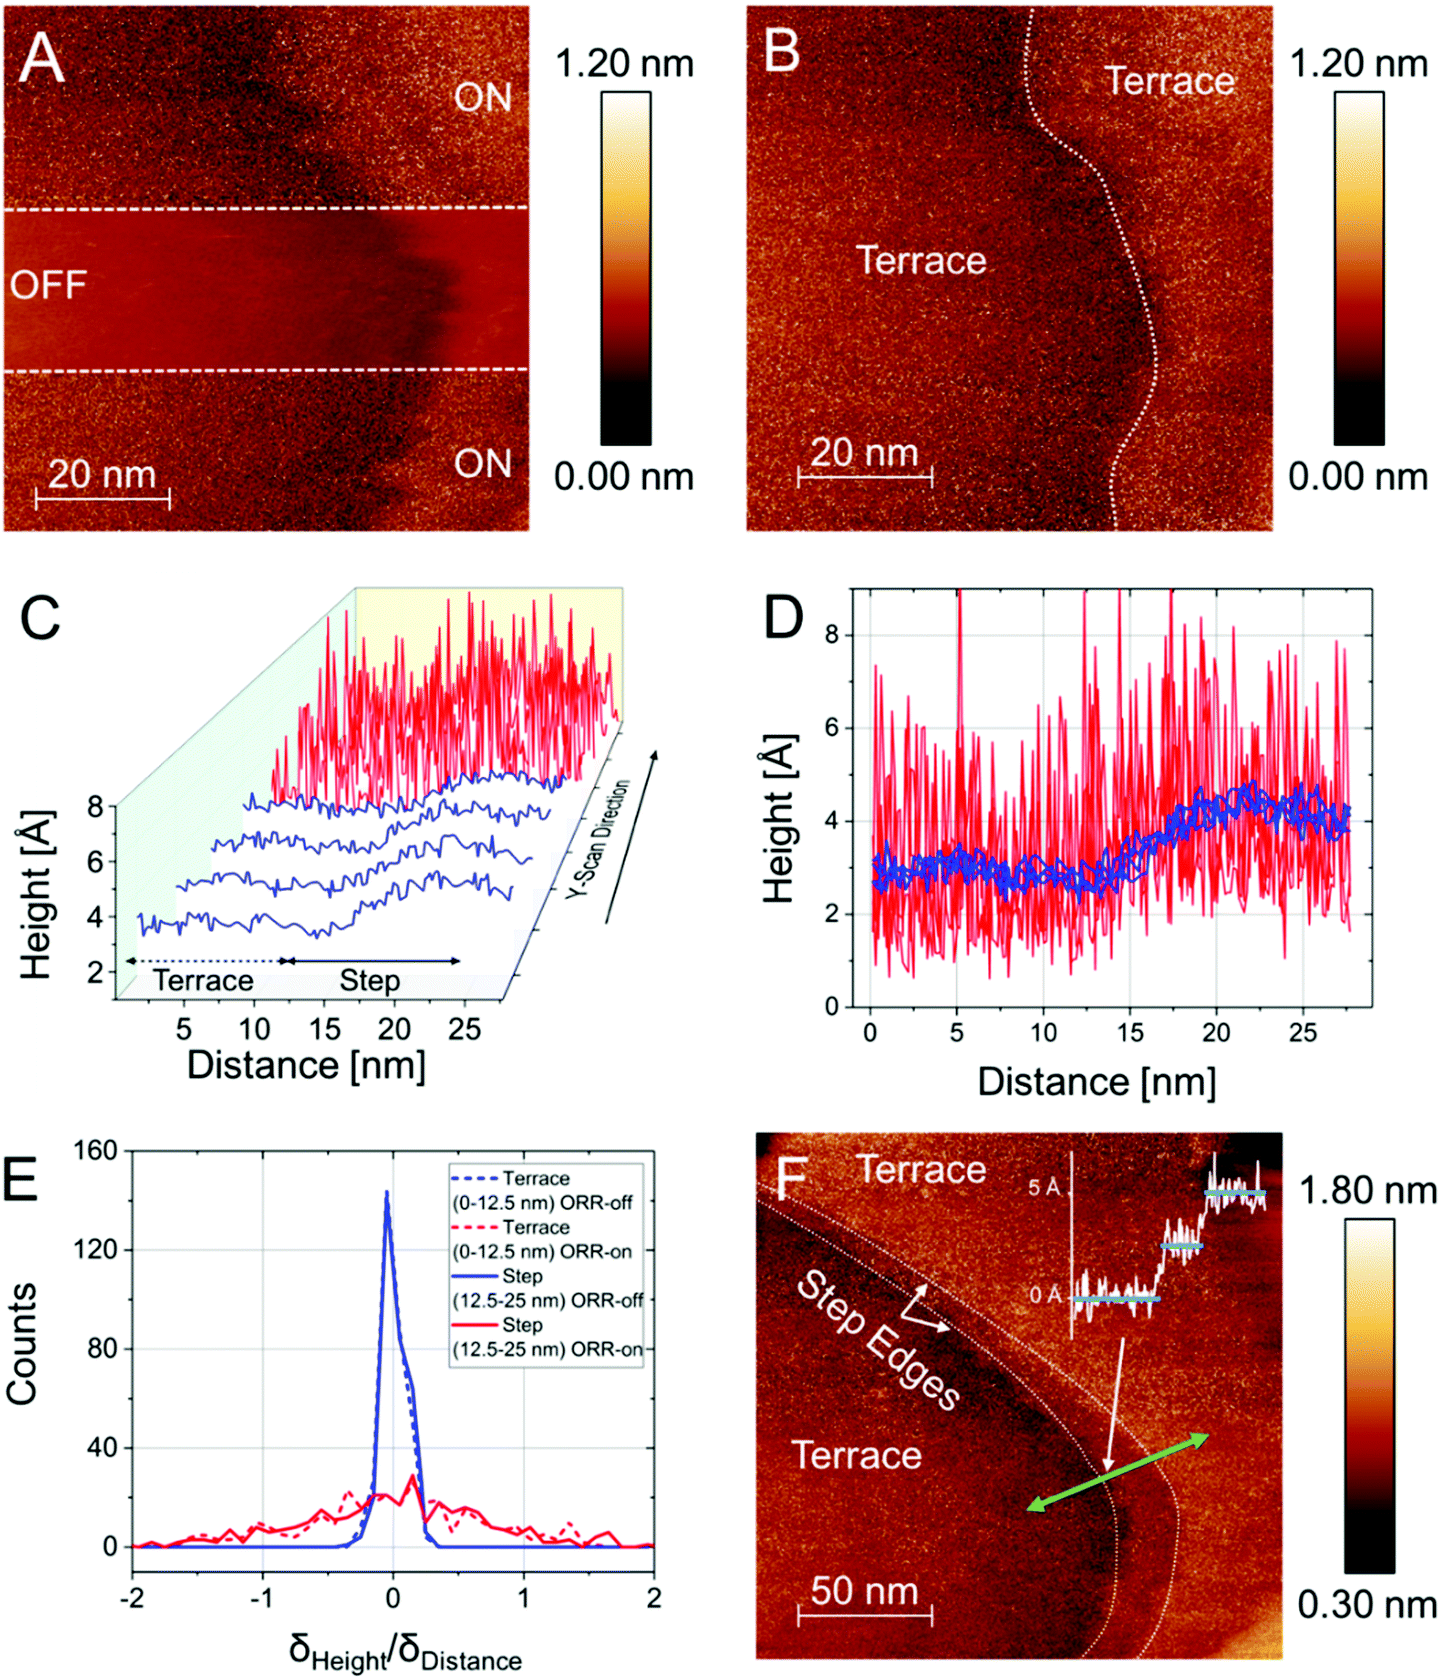 | ||
| Fig. 2 n-ECSTM data analysis for Pt(111) electrodes in air-saturated 0.1 M KOH electrolytes. (A) A STM image contrasting the imaging between the ORR “ON” and “OFF” conditions featuring a step defect and two (111)-terraces. (B) The surface under reaction conditions (“ON”). The step defects do not demonstrate enhanced noise level. (C) The vicinity of the step defect in greater detail shown under “OFF” (blue) and “ON” (red) reaction conditions. (D) The traces from (C) are plotted in a 2D projection (E) Histograms analyzing the distribution of derivatives for two regions as indicated (terrace and step). The distributions are broadened under reaction conditions but show no specific contribution of the defect. (F) Another reaction “ON” n-ECSTM image of the surface, featuring two monoatomic steps, where clearly the terraces are comprised of the most active centers. | ||
To mitigate potential observer bias we also examined the z-value distributions in the two regions of interest statistically using derivative histograms7 (Fig. 2E). A significant broadening of the distributions under reaction conditions is observed, however, one cannot distinguish enhanced contributions of the areas close to the steps. To demonstrate reproducibility, one can consider another independent experiment under similar conditions, the result of which is shown in Fig. 2F. The figure displays flat Pt(111) terraces separated by two monoatomically high steps in the “reaction ON” mode. One can again see that the steps do not exhibit enhanced noise levels. Moreover, individual line scans further reveal that the most active centers are located at the Pt(111) terraces in alkaline media (see an example of the line scans in Fig. 2F) and the “step sites” are inactive.
Fig. 3 presents the results of n-ECSTM measurements performed using the Pt(111) electrode in the air-saturated 0.1 M LiOH electrolytes. The image in Fig. 3A features several monatomic steps separated by broad terraces. Again, the appearance of reaction noise is apparent upon switching of the potential from “reaction OFF” to “reaction ON” conditions. Already in the 2D image there is no enhanced noise visible at the steps. Moreover, this can be seen even better in the detailed plots of individual traces from the image shown in Fig. 3B and C.
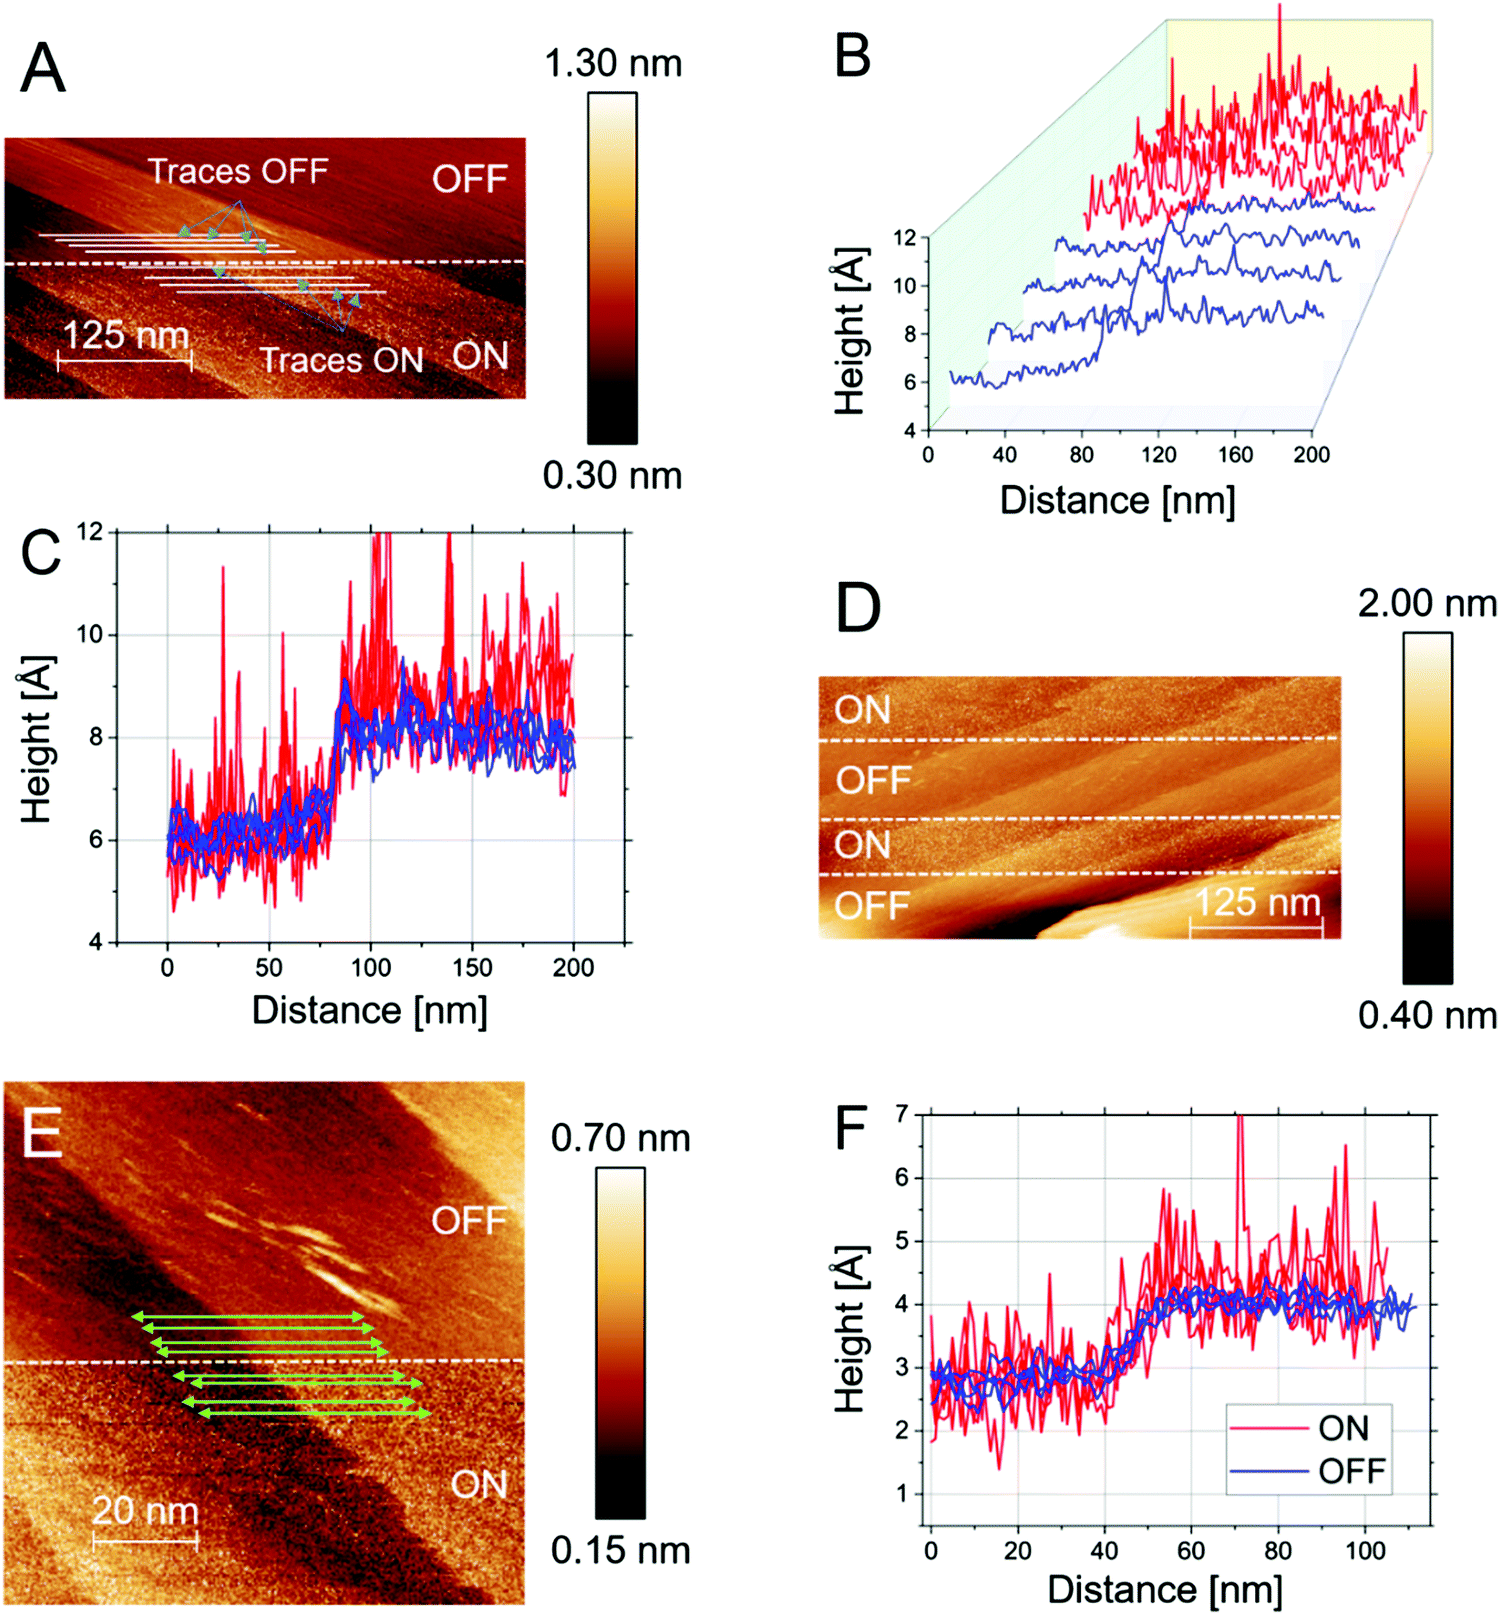 | ||
| Fig. 3 n-ECSTM data analysis for the Pt(111) electrodes in air-saturated LiOH electrolytes. (A) Several step-like defects at the surface. The upper half of the image corresponds to the “reaction OFF”, the lower half to the “reaction ON” conditions. The indicated traces are shown in detail in (B and C) for the “OFF” (blue lines) and “ON” (red) conditions. (D) Series of “ON” and “OFF” measurements at a different specimen position. The ORR is toggled between “ON” and “OFF” potentials three times. The topography is reproduced without major noise in the “OFF” sections, whereas diffuse noise is present in the “ON” sections. (E) Another example of a contrast image with line scans (indicated by the green arrows), which are centered close to a step defect shown in (F). No particular enhancement in the noise level is observed at the step in all cases. | ||
This evenly distributed noise is also evident in other independently performed experiments, as can be seen in Fig. 3D, where it appears (reversibly) upon switching of the potential. This gives further credence to the assertion that the terrace is a hotbed of catalytic activity. Further evidence of the reproducibility of these results is found in Fig. 3E. Here a series of steps is investigated by imaging under the disparate reaction conditions. Under “reaction OFF” conditions the topography is reproduced. Upon switching the potential to “reaction ON” conditions, noise features appear on top of the topographical signal. The “quasi-uniformity” of the noise is further confirmed by considering individual traces from the image (plotted in Fig. 3F). As stated already for KOH, when compared to the sharp spikes found in acidic media at steps, the steps appear lethargically inactive in LiOH.
Results of n-ECSTM measurements performed using the Pt(111) electrode in air-saturated 0.1 M CsOH electrolytes are shown in Fig. 4. Congruent with the previous two bases, Fig. 4A shows the ability to control the reaction noise by means of the potential. The localization of the noise, or rather the lack thereof, is clear when considering the detailed plots of the traces in Fig. 4B–E. In both datasets clear steps are visible under both “reaction ON” and “reaction OFF” conditions. In analogy to its smaller cousins, in CsOH the surface did not exhibit any enhanced activity in the vicinity of the step edge. This adds on to the growing body of evidence pointing to the inactivity of the step edges in catalyzing the oxygen electro-reduction in alkaline media. The terraces are thus the most likely active centres in these electrolytes.
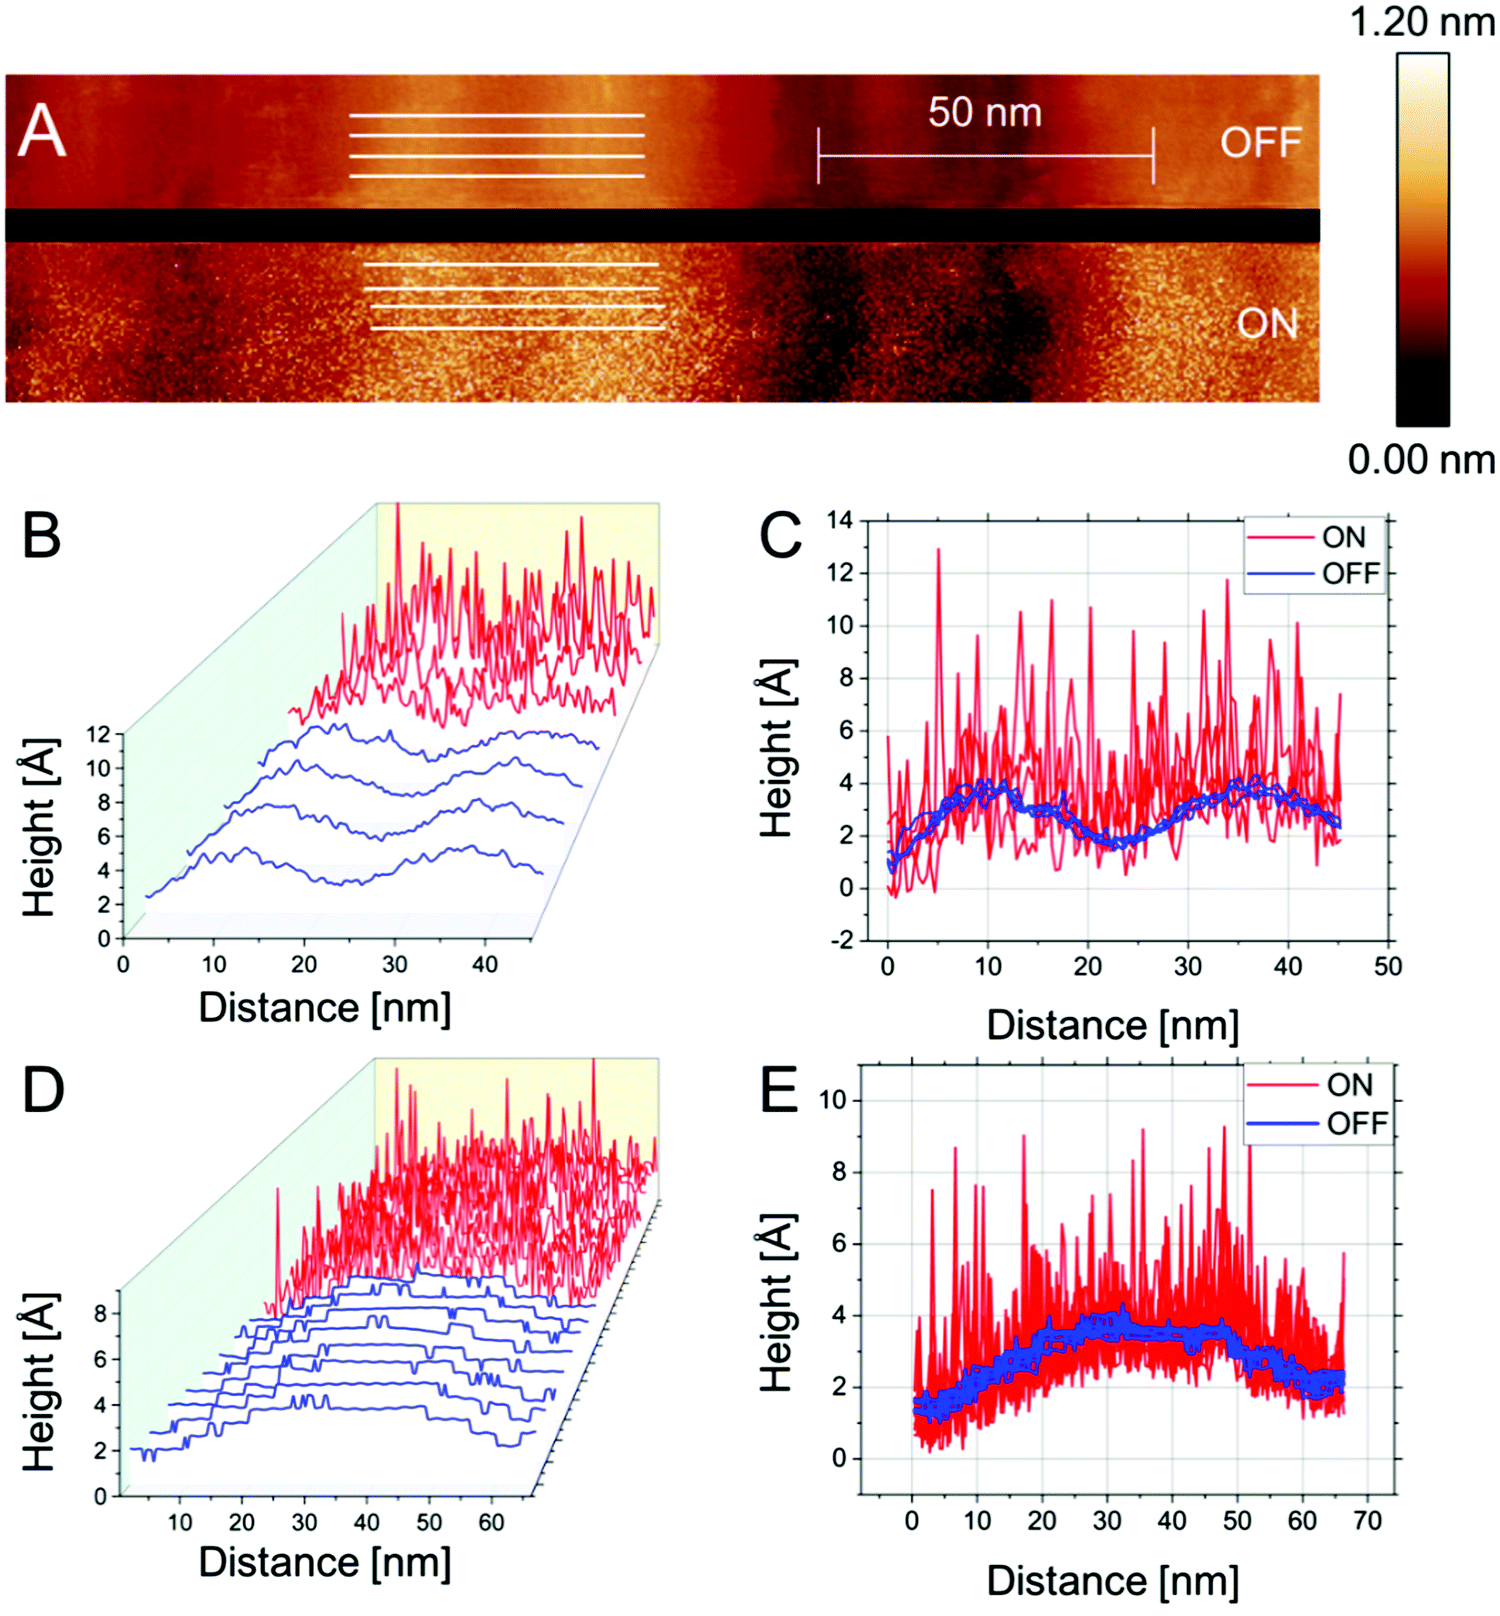 | ||
| Fig. 4 n-ECSTM images and their analysis for Pt(111) electrodes in air-saturated 0.1 M CsOH electrolytes. (A) An example of an image showing the reaction “OFF” and “ON” conditions. (B) and (C) are plots of the traces extracted from (A). (D and E) show further contrasts at a (111) terrace flanked by steps on each side. There is no indication of the enhanced noise at the steps. | ||
The main summary from Fig. 2–4 can be formulated as follows: the concave sites at the steps, which are the most active ORR centers in 0.1 M HClO4 electrolytes are deactivated in the tested alkaline media (LiOH, KOH or CsOH). One can speculate that this is due to the pH difference (introduction of a significant amount of hydroxyl-anions), possibly combined with an additional strong influence of the alkali metal cations.31,32 One can, therefore, conclude that the greater the number of step-like defects introduced at the surface of platinum, the lower the net ORR activity registered in the macroscopic experiments in alkaline media would be (for all alkali metal cations). Indeed, this is what has been clearly observed in macroscopic experiments using stepped single crystals in NaOH.14 Therefore, rational design principles for the nanostructured Pt-electrocatalysts working in alkaline media should be adjusted accordingly, compared to the acidic environment.
Conclusions
Using the recently introduced methodology of EC-STM noise measurements, we have shown that the most likely locations of active centers at platinum surfaces in alkaline media are the densely packed (111) facets. This difference helps to explain why Pt(111) outperforms surfaces with high density of (step) defects in alkaline media. What remains unanswered is the question as to the origin of the influence of the alkali metal cations as well as the variation in activity amongst the cations. These present themselves as possible directions for future investigation. This study showed that the qualitative behavior is similar for all tested alkali cation hydroxide solutions. On the other hand, it did not permit to compare quantitatively the activities at a given potential on the terrace sites for different alkali metals. Furthermore, it would be desirable to develop a theoretical model predicting the location of active sites of platinum also in alkaline media. This could establish a similar Troika as is in place now for acidic media, where macroscopic and microscopic experiments along with theoretical predictions act in concert to identify the active sites of a catalyst.Conflicts of interest
There are no conflicts to declare.Acknowledgements
Financial support from the DFG project BA 5795/3-1, BA 5795/4-1 and the cluster of excellence Nanosystems Initiative Munich (NIM) is gratefully acknowledged.Notes and references
- F. Cheng and J. Chen, Chem. Soc. Rev., 2012, 41, 2172 RSC.
- I. Katsounaros, S. Cherevko, A. R. Zeradjanin and K. J. J. Mayrhofer, Angew. Chem., Int. Ed., 2014, 53, 102–121 CrossRef CAS.
- P. Strasser, M. Gliech, S. Kuehl and T. Moeller, Chem. Soc. Rev., 2018, 47, 715–735 RSC.
- A. S. Bandarenka and M. T. M. Koper, J. Catal., 2013, 308, 11–24 CrossRef CAS.
- I. Chorkendorff and J. W. Niemantsverdriet, Concepts of modern catalysis and kinetics, Wiley-VCH, 2017 Search PubMed.
- J. K. Nørskov, T. Bligaard, B. Hvolbæk, F. Abild-Pedersen, I. Chorkendorff and C. H. Christensen, Chem. Soc. Rev., 2008, 37, 2163–2171 RSC.
- J. H. K. Pfisterer, Y. Liang, O. Schneider and A. S. Bandarenka, Nature, 2017, 549, 74–77 CrossRef CAS PubMed.
- N. M. Markovic, T. J. Schmidt, V. Stamenkovic and P. N. Ross, Fuel Cells, 2001, 1, 105–116 CrossRef CAS.
- N. Hoshi, M. Nakamura and A. Hitotsuyanagi, Electrochim. Acta, 2013, 112, 899–904 CrossRef CAS.
- A. M. Gómez-Marín, R. Rizo and J. M. Feliu, Catal. Sci. Technol., 2014, 4, 1685 RSC.
- A. S. Bandarenka, H. A. Hansen, J. Rossmeisl and I. E. L. Stephens, Phys. Chem. Chem. Phys., 2014, 16, 13625 RSC.
- F. Calle-Vallejo, J. Tymoczko, V. Colic, Q. H. Vu, M. D. Pohl, K. Morgenstern, D. Loffreda, P. Sautet, W. Schuhmann and A. S. Bandarenka, Science, 2015, 350, 185–189 CrossRef CAS PubMed.
- F. Calle-Vallejo, M. D. Pohl, D. Reinisch, D. Loffreda, P. Sautet and A. S. Bandarenka, Chem. Sci., 2017, 8, 2283–2289 RSC.
- R. Rizo, E. Herrero and J. M. Feliu, Phys. Chem. Chem. Phys., 2013, 15, 15416 RSC.
- V. Briega-Martos, E. Herrero and J. M. Feliu, Electrochim. Acta, 2017, 241, 497–509 CrossRef CAS.
- D. Strmcnik, K. Kodama, D. van der Vliet, J. Greeley, V. R. Stamenkovic and N. M. Marković, Nat. Chem., 2009, 1, 466–472 CrossRef CAS.
- K. D. Jensen, J. Tymoczko, J. Rossmeisl, A. S. Bandarenka, I. Chorkendorff, M. Escudero-Escribano and I. E. L. Stephens, Angew. Chem., Int. Ed., 2018, 57, 2800–2805 CrossRef CAS.
- N. M. Markovic, H. A. Gasteiger and P. N. Ross, J. Phys. Chem., 1996, 100, 6715–6721 CrossRef.
- B. Garlyyev, S. Xue, M. D. Pohl, D. Reinisch and A. S. Bandarenka, ACS Omega, 2018, 3, 15325–15331 CrossRef CAS.
- X. Chen, F. He, Y. Shen, Y. Yang, H. Mei, S. Liu, T. Mori and Y. Zhang, Chem. – A Eur. J., 2017, 23, 14597–14603 CrossRef CAS.
- K. D. Jensen, J. Tymoczko, J. Rossmeisl, A. S. Bandarenka, I. Chorkendorff, M. Escudero-Escribano and I. E. L. Stephens, Angew. Chem., Int. Ed., 2018, 57, 2800–2805 CrossRef CAS PubMed.
- L. A. Kibler, Int. Soc. Electrochem., 2003, 1–56 Search PubMed.
- L. A. Nagahara, T. Thundat and S. M. Lindsay, Rev. Sci. Instrum., 1989, 60, 3128–3130 CrossRef CAS.
- P. Zihrul, I. Hartung, S. Kirsch, G. Huebner, F. Hasché and H. A. Gasteiger, J. Electrochem. Soc., 2016, 163, F492–F498 CrossRef CAS.
- A. Dicks and D. A. J. Rand, Fuel cell systems explained, Wiley, 2018 Search PubMed.
- M. Sumetskii, A. A. Kornyshev and U. Stimming, Surf. Sci., 1994, 307–309, 23–27 CrossRef CAS.
- M. Sumetskii and A. A. Kornyshev, Phys. Rev. B: Condens. Matter Mater. Phys., 1993, 48, 17493–17506 CrossRef.
- M. Hugelmann and W. Schindler, Surf. Sci., 2003, 541, L643–L648 CrossRef CAS.
- A. Kuzume, E. Herrero and J. M. Feliu, J. Electroanal. Chem., 2007, 599, 333–343 CrossRef CAS.
- A. Hitotsuyanagi, M. Nakamura and N. Hoshi, Electrochim. Acta, 2012, 82, 512–516 CrossRef CAS.
- X. Chen, I. T. McCrum, K. A. Schwarz, M. J. Janik and M. T. M. Koper, Angew. Chem., Int. Ed., 2017, 56, 15025–15029 CrossRef CAS PubMed.
- B. Garlyyev, S. Xue, S. Watzele, D. Scieszka and A. S. Bandarenka, J. Phys. Chem. Lett., 2018, 9, 1927–1930 CrossRef CAS PubMed.
Footnotes |
| † Electronic supplementary information (ESI) available. See DOI: 10.1039/c8ee03228a |
| ‡ These authors contributed equally to this manuscript. |
| This journal is © The Royal Society of Chemistry 2019 |