Liquid organic hydrogen carriers (LOHCs) – techno-economic analysis of LOHCs in a defined process chain†
M.
Niermann
 a,
S.
Drünert
 *a,
M.
Kaltschmitt
a and
K.
Bonhoff
b
aHamburg University of Technology, Institute of Environmental Technology and Energy Economics, Eißendorfer Str. 40, 21073 Hamburg, Germany. E-mail: sebastian.druenert@tuhh.de
bNational Organisation Hydrogen and Fuel Cell Technology, Fasanenstr. 5, 10623 Berlin, Germany
First published on 16th November 2018
Abstract
Long-distance transport and long-term storage of hydrogen can be realized with Liquid Organic Hydrogen Carriers (LOHC) based on a two-step cycle: (1) loading of hydrogen (hydrogenation) into the LOHC molecule (i.e., hydrogen is covalently bound to the LOHC) and (2) unloading of hydrogen (dehydrogenation) after transport and storage. Since the (optimal) LOHC is liquid at ambient conditions and shows similar properties to crude oil based liquids (e.g. diesel, and gasoline), handling and storage is realized by well-known processes; thus stepwise adaptation of the existing crude oil based infrastructure is basically possible. Against this background, a defined process chain for intercontinental ship transport of hydrogen (5000 km) is simulated with various LOHCs. The respective results are evaluated and assessed related to their technological and economic performance. Additionally, they are compared to a pipeline-based provision chain based on compressed hydrogen (CGH2). Among others, the results show that methanol is the cheapest LOHC option for storage and transportation followed by dibenzyltoluene and toluene. For a storage time of 60 days they show economic advantages compared to compressed hydrogen (CGH2) under the defined assumptions; thus these LOHC options are especially advantageous for long-term storage/long distance transport applications. The energetic efficiency of the systems mainly depends on the source of the dehydrogenation heat. Two options, dehydrogenation driven by hydrogen burning vs. dehydrogenation driven by waste heat, have been evaluated in this study. Systems that run on waste heat perform much better in terms of efficiency. Overall, LOHCs can provide technologically efficient and economic promising storage and transport within a sustainable hydrogen economy.
Broader contextA worldwide transformation of the energy system towards renewable energies becomes inevitable to counteract the harmful effects of fossil fuels. To meet global energy demands, massive generation capacities need to be installed in the future; ideally at sites with a high energy potential (e.g. desert regions). Since consumption does not necessarily lie here, trans-regional energy transport must be carried out. This energy transport requires new fuels, which can be used in the existing infrastructure for a step-by-step implementation, but which are at the same time based on renewable energies. Liquid Organic Hydrogen Carries (LOHC) are a possible option for this, allowing for safe and efficient storage and transportation of energy. In this way they can make a decisive contribution to an environment-friendly energy system. |
1. Introduction
Renewable energies are globally on the rise and reached a total share of 19.5% of the global energy demand in 2017.1 Most likely this development will continue in the years to come. Lots of countries have committed themselves to the goal of reducing GHG emissions significantly by 2050 to contribute to the targets defined within the Paris Agreement which entered into force on November 4th, 2016. The consequence is that globally energy systems using mainly fossil fuel energy will be transformed in the years to come towards energy systems based more and more on renewable sources of energy. By 2050 renewables will have to provide basically most of the primary energy required to cover a strongly growing global energy demand due to an increasing population and even over-proportionally accelerating prosperity.So far, this development is driven by the transformation of the electricity supply systems; on the one hand electrical energy can easily be provided by “new” conversion options based on renewable sources of energy (i.e., windmills, and photovoltaic (PV) systems) and on the other hand the demand for electricity is strongly rising on a global scale. This currently ongoing thorough mutation brings up various challenges to be tackled in the years to come. Some of them are addressed as examples below.
• Fluctuating power generation. By the end of 2017 already approximately 540 GW and 400 GW have been installed in windmills and photovoltaic systems, respectively. As their electricity production strongly depends on site-specific meteorological conditions, their capacity factor is partly significantly lower than that of e.g. coal-fired power plants. Thus, additional capacities need to be installed to cover securely the given electricity demand. But the result of such a strategy is an increasing occurrence of overproduction of electricity at time periods with a very high meteorological energy supply. Thus, this development requires the need for the implementation of large-scale and long-term energy storage systems typically coupled with respective transportation systems to overcome local demand and supply discrepancies without the need for a high-voltage power line.
• Energy transport. The possible electricity generation from wind and solar radiation varies considerably both regionally and globally as well as temporally.2,3 Thus, in order to use these renewable sources of energy which are technically and economically most promising, the respective conversion plants might be installed preferably in regions with a very high renewable energy supply (and no conflicting use of the needed land areas). Consequentially, energy for e.g. Germany does not necessarily only have to be produced in Germany itself (keyword: import of “green” energy). In such a scenario, the electrical energy must not only be stored on a large scale but also transported via long distances exceeding clearly the distances to be covered by a “classical” power line taking economic constraints into consideration.
• GHG neutral transportation. To realize the transition from fossil fuels to renewable energies also within the transportation sector, innovative energy (carrier) concepts are urgently needed to contribute considerably to GHG emission reduction. From a market perspective they should rest on a broad basis of different renewable sources of energy. At the same time a secure and stable supply needs to be ensured. Additionally, suitable concepts must have the potential to provide competitive transportation duties on the market in the years to come. Thus, in addition to the “classical” processes for the production of biofuels, electricity-based fuels like hydrogen are gaining more and more attention. If the required electricity is provided from renewable sources of energy, it is a sustainable and thus basically GHG-neutral option.
Hydrogen can help to contribute to all of the challenges mentioned above. Due to the very specific chemical and physical properties as well as the already available state of technology for production, hydrogen is seen as a very promising energy carrier for the years to come. However, the low density and the resulting difficult handling of molecular hydrogen as a low-density gas complicate its usage and result in high economic and energetic efforts to store it and/or to transport it via longer distances.
So far, different storage options of hydrogen allowing partly also for long-distance transport already exist. They are characterized by specific advantages and disadvantages.
• Most widely used so far are “Compressed Hydrogen (CGH2)” and “Liquefied Hydrogen (LH2)” storage devices. Both storage options are characterized by high security requirements due to a very high pressure level (up to 700 to 800 bar) or very low temperatures (−252 °C), respectively. Additionally, the necessary conditioning of the hydrogen gas to be stored in these transportable storage devices results in a high energy (electricity) demand. Beside this, 0.3 to 3% of hydrogen is lost in a liquid H2 storage system due to boil-off.4–6
• Low and high temperature metal hydride storage systems are another option characterized by high storage capacities in theory. But so far extensive thermal management and considerable packing limitations greatly decrease these theoretical values.7 Also, the limited reversibility of the hydrogen storage, decomposition of the storage material and slow reaction kinetics are challenges to be tackled by further research.8
Another option to store hydrogen is Liquid Organic Hydrogen Carriers (LOHCs). The concept of storing hydrogen within LOHCs at ambient conditions is based on hydrogenation and subsequent dehydrogenation of organic molecules (i.e. a reversible chemical reaction). The term LOHCs includes all hydrogen storage systems that are liquid in the hydrogen-rich form. LOHCs are potentially cheap, safe, and easily manageable. Moreover, (in theory) they allow for long-term energy storage without boil-off or other losses as well as easily to be realized transportation.
The first studies on LOHCs took place in the early 1980s. Japanese researchers investigated the basic concept on the benzene/cyclohexane system. In the early 2000s they examined this and similar systems in more detail.9,10 Generally, the hydrogenation and dehydrogenation processes of various LOHC concepts have been assessed in depth.11–22 For example, Crabtree23 suggested organic heterocycles to be used as LOHCs outlining safe storage and simple heat management. Müller et al.14,24 evaluated LOHCs based on their thermodynamic properties emphasizing that especially nitrogen-containing aromatics are well suited to be used as a LOHC due to their enthalpy change. Among others, the company Air Products has already applied for several patents on different LOHC systems.25,26 Further research on potential LOHC candidates in various potential application fields has been done27–37 (e.g., energy storage in buildings, energy transport, and fuel applications in vehicles); each of these investigations mainly focuses on one LOHC (e.g., N-ethylcarbazole, dibenzyltoluene, toluene, or 1,2-dihydro-1,2-azaborine). Also, coupling of endothermic dehydrogenation with industrial waste heat has been examined for the example of a cement plant.38 Wang et al.39 carried out a comparison between a LOHC-based storage system and a Compressed Hydrogen Gas (CGH2) storage system. Considerable research has been performed on the applicability of selected LOHCs for very specific fields of application. However, a broad evaluation and comparison of different LOHCs on the basis of a techno-economic evaluation was not found.
Against this background, a defined storage and transport process chain is examined using various LOHCs on the basis of a comprehensive simulation. Based on the respective results, storage and transportation as well as overall chain efficiencies on one side and system costs on the other side are calculated. This is realized for different LOHCs within the evaluated process chain. Therefore, not only storage, transportation and re-provision of hydrogen, but also costs of the storage material as well as the respective catalysts, are taken into consideration. The compiled results are then compared with already established storage and transportation chains (pipeline transport of compressed hydrogen with storage in caverns or high-pressure tanks). Based on this systematic comparison final conclusions are drawn and recommendations are provided.
2. LOHC concept
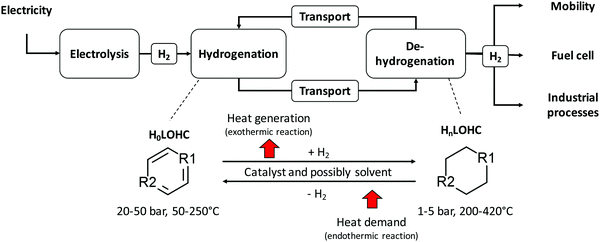
The LOHC storage and transport concept (Fig. 1) is used to connect regions with large energy generation potential from renewable sources and/or low electricity demand (e.g., desert regions) to regions with high energy demand and/or low energy provision potential (e.g., North and Central Europe, Japan). For this purpose, “green” electricity provided by renewable sources of energy (e.g., wind power, solar radiation, hydro power, geothermal energy, and biomass) is used, for example, within an electrolysis process to produce gaseous hydrogen from water. The provided hydrogen is afterwards immediately used to hydrogenate an unloaded LOHC molecule (H0LOHC). This hydrogenation process is typically exothermic and is often realized at elevated temperatures and pressures. The hydrogen-loaded LOHC (HnLOHC) shows a significant increased volumetric energy density compared to molecular hydrogen. This loaded liquid can be stored at ambient conditions for long periods without any energy losses. In parallel, the handling of this hydrogenated liquid is very much simpler compared to gaseous hydrogen as the properties of LOHCs are typically similar to crude oil derivates (e.g. diesel, and gasoline) and thus well known by industry. LOHCs are therefore well suited for intercontinental energy transport since the existing crude oil-based infrastructure can be used to a certain extent.Thus, after hydrogenation the HnLOHC is transported to the place of greatest value creation (i.e. the highest energy demand); this can be realized based on trucks, railroads, ships or even existing crude oil pipelines. If hydrogen is needed, the HnLOHC can be de-hydrogenated and hydrogen can again be provided in its gaseous form to be further used e.g. in fuel cells to produce electricity, in mobile applications (e.g. fuel cell cars) for providing operating power or within chemical processes e.g. as a “green” reaction partner. Contrary to hydrogenation, dehydrogenation is endothermic and is realized typically close to atmospheric pressure at elevated temperatures normally between 200 and 450 °C.
The LOHC is circulated within the overall system, which also involves transport after dehydrogenation back to the place of hydrogenation; thus the LOHC can ideally be used indefinitely. However, due to side reactions certain amounts are lost during such a storage and transport cycle. For this reason, the LOHC needs to be replaced at specific intervals.
The electrolysis process for the provision of gaseous hydrogen from water is ideally fed by electricity from renewable sources of energy showing volatile characteristics if wind power or solar radiation as the most important “new” renewable sources of energy are used for electricity provision. Under these conditions Polymer Electrolyte Membrane Electrolysis (PEMEL) is preferable to other electrolysis systems due to its good dynamic behavior enabling the possibility to quickly respond to power supply fluctuations and to be operated easily at part load.40,41 When hydrogen is subsequently used to generate electricity, Polymer Electrolyte Membrane Fuel Cells (PEMFCs) or Solid Oxide Fuel Cells (SOFCs) are possible technological solutions. In case of fluctuating demand Polymer Electrolyte Membrane Fuel Cells (PEMFCs) are favorable since they show the same dynamic behavior as Polymer Electrolyte Membrane Electrolysis (PEMEL). On the contrary, Solid Oxide Fuel Cells (SOFCs) are characterized by poor dynamic behavior but higher overall efficiency;40,41 thus this technological solution is only feasible if a constant electricity demand is given. Polymer Electrolyte Membrane Fuel Cells (PEMFCs) show a temperature level below 180 °C being typically below the dehydrogenation temperature of the most widely understood LOHCs. Therefore, hydrogen release requires heat from an appropriate heat source to drive the dehydrogenation process. Ultimately, but not preferably, a part of the released hydrogen can be burned to meet the heat demand of the dehydrogenation process. The latter case greatly reduces the efficiency of the overall process chain. Compared to that, waste heat from Solid Oxide Fuel Cells (SOFCs) is normally available with temperatures between 600 and 1000 °C; thus it can be coupled with the dehydrogenation process since both processes might run in parallel if the provision of electricity is the overarching goal. Such a system would be self-sufficient without the need of burning hydrogen (i.e. higher overall efficiencies).
Since hydrogen is not necessarily converted into electricity again after being transported and stored within the loaded LOHC, waste heat from fuel cells is not automatically and necessarily available. Thus, to avoid burning of a certain share of the stored and transported hydrogen it might be advantageous to locate the dehydrogenation plant near an excess heat source (e.g. coupling with the unused waste heat from a cement plant characterized by a temperature level up to 600 °C38). Therefore, the decision of the ultimate composition of the dehydrogenation concept depends on the possibility to attach this process to parallel processes, the dynamic requirements of the storage system, the demands from the transportation system and the dehydrogenation temperature of the specific LOHC.
3. Methodological approach
With the goal to assess transportation and storage of hydrogen via different LOHCs from a technological and an economic point of view, different LOHCs are assessed within a specific “average” process chain. To allow for an easy comparison of the respective results the same framework conditions for the process chains for the various assessed LOHCs are defined. Additionally, all processes are simulated with the same software. Below, the methodological approach applied to achieve this overarching goal is discussed. Thus, first the basic provision chains assumed for the different LOHCs investigated here are defined, then (secondly) they are simulated, before (thirdly) an assessment related to technological and economic criteria is realized.3.1 Process chain definition
The process chain assessed here starts with electricity provided by renewable sources of energy and ends again with “green” electricity provided at another place and at another time. In between these two corner points a certain (intercontinental) distance – and thus a specific time period – has to be overcome by transporting hydrogen bound to different LOHCs. The general system configuration being the same for all LOHCs assessed here is displayed in Fig. 2. For transportation a tanker designed for the transport of crude oil is assumed to be used. This process chain is basically adaptable to all LOHCs. | ||
| Fig. 2 Flow diagram and system boundaries of the process chain (PEMEL: Polymer Electrolyte Membrane Electrolysis, PEMFC: Polymer Electrolyte Fuel Cell). | ||
In addition to this process chain based on LOHCs, a compressed hydrogen storage system with 200 bar operating pressure is modelled as a reference process. In this case the transport is realized via an existing natural gas pipeline system.
3.2 Process chain simulation
For the subsequent techno-economic analysis mass and energy balances of all processes are needed. In order to obtain these, all processes as well as all process chains defined above are modelled and simulated with a commercial simulation software package based on energy flow analysis.42 Heat integration was carried out via pinch analysis.43The dynamic behavior of such systems, for example in the start-up phase, cannot be investigated with static Aspen Plus models. Nevertheless, with the expected results, the different LOHCs can be compared both technically and economically with each other as well as with the reference process, improvement potentials can be identified and promising LOHC substances for use in real word applications can be identified.
3.3 Process chain assessment
The various process chains defined and simulated are analyzed related to technical and economic parameters. Therefore, different assessment criteria are defined. The applied methods are discussed below.• Hydrogen storage efficiency (eqn (1)). The efficiency ηH2 describes the ratio of the energy content of the useable hydrogen output (EH2,use) to the energy content of the hydrogen input (EH2,in) based on the higher heating value of hydrogen plus the energy demand of the storage system (Estorage + Edhyd). Since hydrogenation is exothermic (Ehyd) an additional output is generated. If it can be used, it increases the efficiency by adding to the energetic output of the storage.
 | (1) |
• Transport efficiency (eqn (2)). The efficiency ηtransport is defined as the ratio of the energy content of the useable amount of hydrogen (EH2,use) to be transported less the energy demand of the transport (Etransport) to the energy content of the useable hydrogen.
 | (2) |
• Chain efficiency (eqn (3)). The chain efficiency ηchain describes the ratio of the electrical energy output of the fuel cell (Efuel![[thin space (1/6-em)]](https://www.rsc.org/images/entities/char_2009.gif) cell) to the energy consumption of the electrolysis (Eeletrolysis), the storage process (Estorage) and the transport (Etransport).
cell) to the energy consumption of the electrolysis (Eeletrolysis), the storage process (Estorage) and the transport (Etransport).
 | (3) |
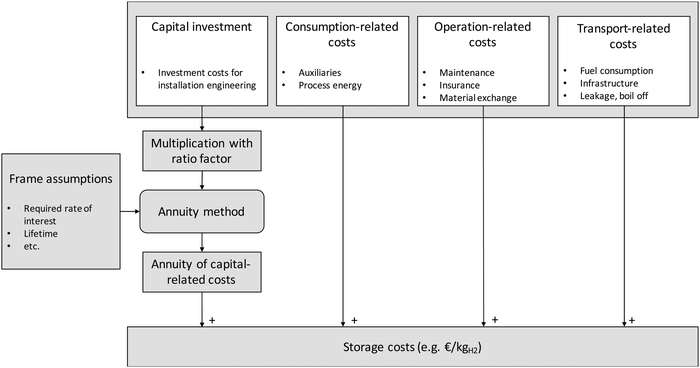 | ||
| Fig. 3 Method for the calculation of the storage costs following the annuity method (modified from ref. 44). | ||
For a conversion plant the overall investment costs increase with rising capacity; in parallel the specific costs decrease due to a higher throughput. Eqn (4) scales the costs according to this effect. Cdesign represents the investment costs for the installed equipment, Cbase the base costs, and Sdesign and Sbase the design and base capacity. SF describes the scaling factor.
 | (4) |
Additionally, there might be the need to adjust the costs of the installed equipment from the year of construction to the reference year. This is realized based on the Chemical Engineering Plant Cost Index (CEPCI).45,46 Since specific costs for hydrogenation and dehydrogenation reactors for different LOHCs are rare, the equations published by Eypasch et al.32 are used to calculate the specific investment. The equations are developed for dibenzyltoluene by curve fitting of the specific costs at different sizes. Since these equations are specific to dibenzyltoluene, they are adjusted via the ratio of the space-time yield (STY) of the specific reaction of dibenzyltoluene to the space-time yield (STY) of the respective LOHC (eqn (5) and (6)). Phyd,max describes the maximum power rating of the unit in kW.
 | (5) |
 | (6) |
 | (7) |
To account for additional costs like installation and legal expenses, the design investment for the respective equipment is multiplied by a ratio factor to obtain the fixed capital investment (FCI). Additionally, a surcharge is applied to the FCI to account for contingencies and working capital. This results in the total capital investment (TCI).46
With the annuity method the annualized capital investment (ACC) is calculated. To determine this, the total capital investment is multiplied by the so-called annuity factor. ACC is calculated according to eqn (8) using the plant lifetime (n) and the interest rate (i).
 | (8) |
To investigate the resilience of the results, different parameters need to be varied within a parameter variation. The examined parameters might be the capital investment and the electricity price.
4. Process chain definition and description
Below the corresponding assumptions for the simulation as well as the subsequent technical and economic assessment are summarized.4.1 Frame conditions
The basic assumptions for storage and transport underlying the technical and economic analysis are summarized in Table 1. The transport length represents, as an example case, the distance between the MENA-region (place of cheap electricity generation based on photovoltaic systems) and Germany (place of consumption). Since electricity is produced at locations with great energy potential (i.e., high solar radiation), low electricity prices and high operating hours can be assumed. Hydrogen storage within the LOHC bridges the gap between production and demand; here an average storage time of 60 days is assumed.The factors to calculate the fixed capital investment and the safety surcharge for the calculation of the total capital investment are listed in Table 2. The respective values for the ratio factors for each piece of equipment are listed in the ESI.† The assumptions made for the determination of the total operating costs are presented in Table 3.
| Factor | Value | |
|---|---|---|
| Direct costs | Installation | 0.47 |
| Instrumentation | 0.36 | |
| Piping | 0.68 | |
| Electrical systems | 0.11 | |
| Building | 0.18 | |
| Yard improvements | 0.10 | |
| Service facilities | 0.70 | |
| Indirect costs | Engineering | 0.33 |
| Construction | 0.41 | |
| Legal expenses | 0.04 | |
| Contractor's fees | 0.22 | |
| Safety surcharge | Contingencies | 0.15 |
| Working capital | 0.10 | |
4.2 Process chains
The structure of the simulated process chain is basically the same for all LOHCs (Fig. 4 and 5). This process chain includes electrolysis (i.e., hydrogen production from “green” electricity), hydrogenation (i.e., provision of the loaded LOHC), transportation and storage (of the loaded LOHC), dehydrogenation (i.e., provision of the gaseous hydrogen) and fuel cell operation (i.e., provision of electrical energy). Additionally, some LOHCs need downstream hydrogen purification after dehydrogenation.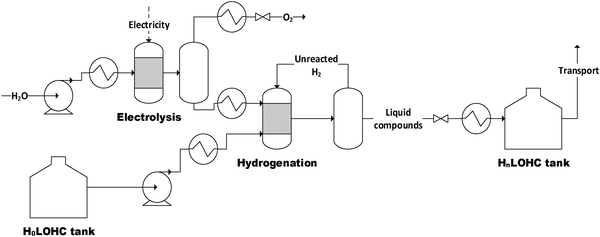 | ||
| Fig. 4 Flowsheet of the electrolysis and hydrogenation process (H0LOHC: unloaded LOHC, HnLOHC: loaded LOHC). | ||
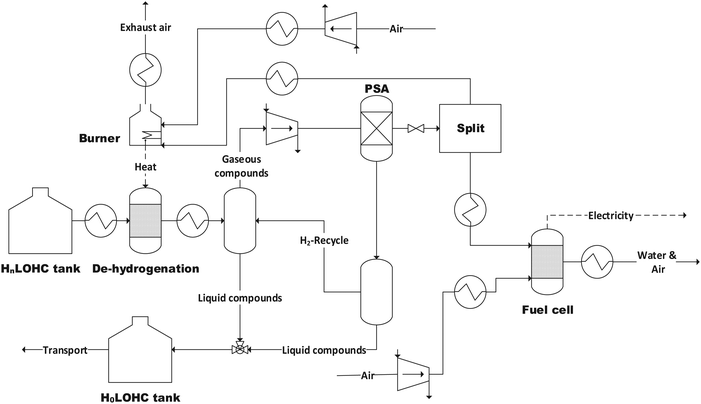 | ||
| Fig. 5 Flowsheet of the dehydrogenation and fuel cell process with pressure swing adsorption (PSA) (H0LOHC: unloaded LOHC, HnLOHC: loaded LOHC). | ||
Below, the structure of the model is explained in more detail, focusing on the hydrogenation and dehydrogenation. Table 4 shows the LOHCs assessed here in detail.
| LOHC | Reason for consideration | Ref. |
|---|---|---|
| N-Ethylcarbazole (NEC) | Well-studied nitrogenous LOHC | 18 |
| Dibenzyltoluene (DBT) | Already existing application as a LOHC; safe and convenient handling | 48 |
| 1,2-Dihydro-1,2-azaborine (AB) | Unique characteristics through integration of boron and nitrogen | 18 |
| Formic acid (FA) | Safe and convenient handling | 18 |
| Methanol (MET) | Very high storage density | 18 |
| Naphthalene (NAP) | Well-studied cycloalkane; high storage density | 49 |
| Toluene (TOL) | Well-studied cycloalkane; planned application as a LOHC | 50 |
For hydrogenation (Fig. 4), an elevated pressure level is needed. To avoid additional compression of the hydrogen, which would be followed by a higher energy demand and additional investment costs, electrolysis is realized at a higher pressure level than hydrogenation. Thus, possible pressure losses are accounted for. Water, hydrogen and unloaded LOHC (H0LOHC) are assumed to be heated up to the corresponding temperatures. An additional pump is used for the unloaded LOHC stream to achieve the required hydrogenation pressure level. In the hydrogenation reactor, the LOHC is loaded with hydrogen to a specific degree dependent on the respective LOHC (Table 6). To ensure that all available hydrogen is bound into the LOHC molecule unused hydrogen is recirculated within the process. Hydrogenation itself is an exothermic reaction (eqn (9)). Here it is assumed that the excess heat cannot be used (i.e., it is assumed to be a loss).
| H0LOHC + nH2 → HnLOHC with ΔH0R = x kJ molH2−1 | (9) |
After hydrogenation, the loaded LOHC stream is decompressed, cooled and stored at ambient conditions. Because hydrogenation takes place at elevated pressure, the product stream is saturated with hydrogen. During decompression hydrogen is released and, if not collected, lost. About 0.1 wt% of hydrogen degasses.47
Since formic acid as one of the investigated LOHCs shows a low storage capacity due to the needed high dilution, an additional distillation step after hydrogenation is necessary to ensure reasonable transport. The not separated formic acid can be recirculated with the solvent.
The loaded LOHC can then be transported by, for example, an ordinary oil tanker to the location of consumption. There the loaded LOHC-stream is heated to the respective temperature corresponding to the used LOHC and releases hydrogen within the dehydrogenation reactor. Depending on the used LOHC only a specific share of the bound hydrogen can be released again (Table 6). The dehydrogenation reaction is vice versa to the hydrogenation reaction (eqn (9)). The process stream is then cooled and after that separated in a vapor–liquid separation unit to ensure a sufficient hydrogen purity for fuel cell operation.
For some LOHCs, further hydrogen purification is necessary after dehydrogenation, as additional solvents, which are needed during the process, or partially gaseous LOHC must be removed to obtain hydrogen which is sufficient pure. Pressure Swing Adsorption (PSA) is the state of the art purification technique for this purpose.51 The heat for dehydrogenation is covered by partial burning of the released hydrogen (Fig. 5).
The share of loaded LOHC which cannot be de-hydrogenated is recirculated together with the unloaded LOHC to the place of hydrogenation again by ship. This reduces the storage capacity for transport purposes, since the still bound hydrogen is transported back to the site of hydrogenation.
4.3 Techno-economic parameters
The technical and economic parameters of the different components of the process chain are summarized below.| Hydrogenation | |||||||
|---|---|---|---|---|---|---|---|
| Temp. [°C] | Pressure [bar] | Loading [%] | STY [gHnLOHC L−1 h−1] | RE [kJ molH2−1] | Solvents | Ref. | |
| a 434 gAB L−1. b Final FA-concentration 1.53 M. c 910 gNAP L−1. d Water/methanol ratio 1.5 mol mol−1. | |||||||
| NEC | 150 | 50 | 100 | 388.2 | −53.2 | None | 55 |
| DBT | 150 | 50 | 100 | 278.8 | −65.4 | None | 55 |
| AB | 80 | 10 | 95 | 77.5 | −35.9 | THFa | 30 |
| FA | 50 | 40 | 100 | 7.7 | −31.2 | Waterb | 56 |
| MET | 250 | 50 | 26.4 | 220.0 | −16.5 | None | 57 |
| NAP | 200 | 69 | 100 | 218.2 | −66.3 | TOLc | 58 |
| TOL | 200 | 20 | 100 | 466.6 | −68.3 | None | 59 |
| Dehydrogenation | |||||||
|---|---|---|---|---|---|---|---|
| Temp. [°C] | Pressure [bar] | Conversion [%] | STY [gH2 L−1 h−1] | RE [kJ molH2−1] | Solvents | Ref. | |
| NEC | 270 | 1 | 90 | 163.1 | 53.2 | None | 55 |
| DBT | 310 | 1 | 97 | 27.5 | 65.4 | None | 55 |
| AB | 80 | 1 | 99 | 27.0 | 35.9 | THFa | 30 |
| FA | 60 | 1 | 100 | 0.2 | 31.2 | Waterb | 56 |
| MET | 420 | 1 | 100 | 44.8 | 16.5 | Waterd | 60 and 61 |
| NAP | 280 | 1 | 99 | 16.1 | 66.3 | TOLc | 49 and 58 |
| TOL | 320 | 1 | 95 | 61.5 | 68.3 | None | 59 and 62 |
The hydrogenation of dibenzyltoluene has recently been demonstrated in a newly developed pressure swing reactor at temperatures up to 320 °C and 30 bar.63 In addition to a higher value waste heat stream compared to the used conversion conditions, the STY could be drastically increased. However, investment accounting is based on a continuous tube reactor. Therefore, this technical innovation is mentioned here but not considered in the following comparison.
Since LOHCs show similar physical and chemical properties compared to crude oil, conventional oil storage tanks can be used. Their investment costs amount to 192 € per m3.47
The storage of compressed hydrogen in high-pressure tanks costs 380 € per kgH2 at 200 bar.64 For cavern storage the costs are scaled according to ref. 65.
The main assumptions of the ship transport are listed in Table 8. The possible payload for each tanker depends on its maximum loading. Therefore, the gravimetric storage density of the LOHCs defines the possible hydrogen load.
| Max. loading | 75![[thin space (1/6-em)]](https://www.rsc.org/images/entities/char_2009.gif) 000 t 000 t |
Depreciation period | 15 a |
| Average speed | 15 kn | Payload | Variable |
| Fuel costs | 355.85 € per t | Loading | 2 d |
| Fuel consumption | 56 t per d | Operating costs | 5000 € per d |
| Capital investment | 35 M€ |
Assumptions for the pipeline transport are summarized in Table 9. The specific capital investment for a hydrogen pipeline is calculated depending on the diameter according to ref. 70.
5. Results and discussion
The results based on the process modelling of the seven selected LOHCs are discussed below. This includes exemplary simulation results and the efficiencies of each process chain as well as the overall costs related to the defined calculation method leading to the overall system costs.5.1 Simulation results
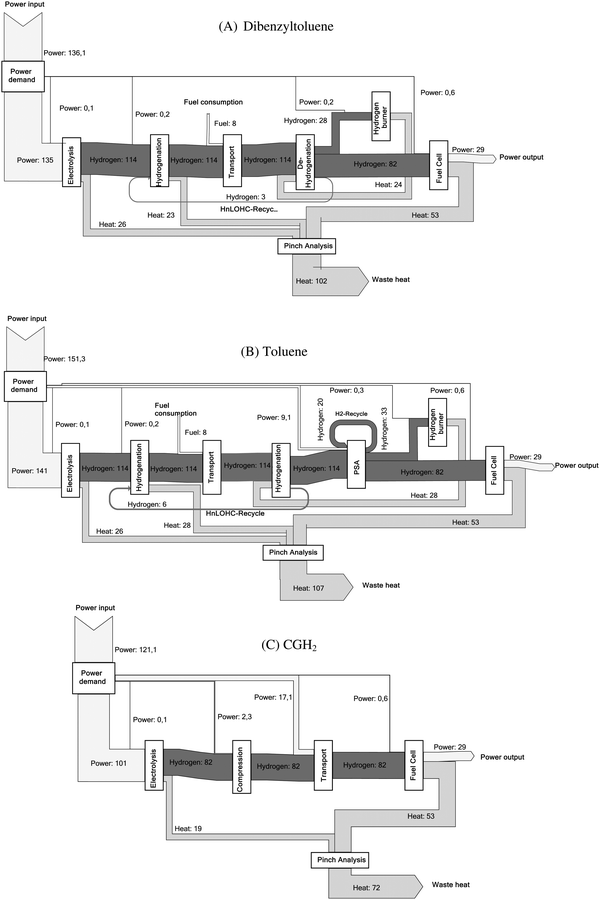
Mass and energy flows are the main outcome of the process simulation realized here for all provision chains. The mass flow of the main input and output parameters and the related energy flows are shown in the ESI.† Here only one example for the mass and energy flow is depicted in Fig. 6 showing the Sankey diagram for the dibenzyltoluene and toluene process as well as the reference process (Table 4). The width of the arrows is representative of the energy content of the respective sub-process. For hydrogen streams, the energy content is based on the higher heating value. The corresponding efficiencies for all LOHCs as well as for compressed hydrogen (i.e., the reference process) are listed in Table 8. The energy flow diagrams make it obvious that the LOHCs chains are characterized by higher energy inputs due to the electrolysis process but a clearly lower energy demand in terms of transport compared to the transport of compressed hydrogen.The energy flow (Fig. 6) for the two LOHCs show that a significant amount of energy is converted into heat during the overall process. The use of this excess heat can help to increase the energetic efficiency of the overall chain. But the temperature level is crucial for such integration of this heat e.g. into heating networks. For example, the exothermic hydrogenation reactions of formic acid take place at a temperature level of only 50 °C. And typically, it is challenging to use such low temperature waste heat due to thermodynamic and thus technical reasons; instead, in most cases for the necessary cooling devices additional electricity is needed. Thus, taking into account the provided heat, the cooling demand of each process is determined.
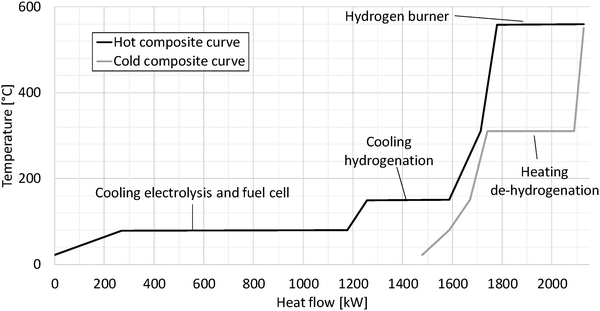
Fig. 7 shows the pinch diagram for the dibenzyltoluene process as an example. The pinch diagram proves that preheating of the input streams requires no heat from external sources; on the contrary waste heat is generated. The waste heat is mainly caused by the fuel cell and electrolysis at relatively low temperatures of 80 °C. Additionally, the hydrogenation process produces waste heat partially used within the process.
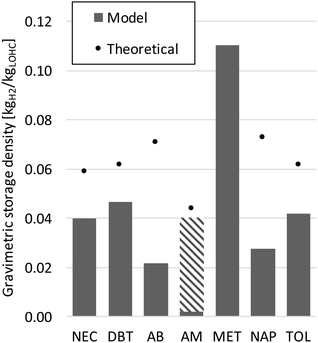
Based on the simulated processes, the gravimetric storage density of the loaded LOHC determining the transported amount of hydrogen energy can be calculated. Fig. 8 shows the results together with the theoretical densities. Thus the simulated capacities greatly decrease compared to the theoretical values because the stored hydrogen is partially burned to cover the heat demand of dehydrogenation. Adding solvents (Table 6) further reduces the capacities; especially formic acid shows a high reduction. Therefore, through distillation the storage density can be increased significantly. Overall, methanol shows the highest storage density.
5.2 Technical analysis
Table 10 shows the storage efficiencies according to eqn (1)–(3) for all selected LOHCs transported via ships. Data indicated in brackets describe an ideal system where hydrogenation heat is completely used. As a benchmark reference, the process chain of compressed hydrogen gas at 200 bar transported via pipeline is presented as well. Comparing the results shown in Table 10 allows for the following statements.| NEC | DBT | AB | FA | MET | NAP | TOL | CGH2 | |
|---|---|---|---|---|---|---|---|---|
| η H2 | 62.6 (76.4) | 60.8 (77.8) | 73.9 (82.6) | 11.0 (11.8) | 71.5 (76.9) | 54.1 (71.9) | 53.8 (71.9) | 97.3 |
| η transport | 90.3 | 90.3 | 83.1 | 90.3 | 95.2 | 95.5 | 90.3 | 79.2 |
| η chain | 20.3 | 20.0 | 21.0 | 3.8 | 21.6 | 17.7 | 18.1 | 23.9 |
• Storage efficiency. 1,2-Dihydro-1,2-azaborine has the highest hydrogen storage efficiency due to its low dehydrogenation heating demand. Even though the dehydrogenation demand is the lowest for methanol, hydrogen purification and carbon dioxide compression decrease the storage efficiency significantly. Formic acid shows the lowest efficiency due to the distillation necessary to achieve a sufficient purity. Compressed hydrogen shows the highest storage efficiency in comparison, since only gas compression is needed.
• Transport efficiency. Methanol is the most efficient LOHC in terms of transportation, since it has the highest storage density. 1,2-Dihydro-1,2-azaborine has the lowest storage density and is therefore the most inefficient system regarding transport. The regular compression stages for compressed hydrogen result in a high energy demand of the transport and thus a lower efficiency.
• Chain efficiency. Considering the whole chain, methanol and 1,2-dihydro-1,2-azaborine are the most efficient LOHC options. This is mainly due to their good storage efficiency; yet compressed hydrogen is more efficient (if a pipeline is available or can be installed).
In the examined process chain dehydrogenation heat is supplied by partially burning the released hydrogen. As mentioned in Section 2, it can also be covered by waste heat available from other processes (e.g. industrial or high-temperature fuel cell waste heat). This greatly influences the overall efficiency, since less hydrogen needs to be produced. Thus within this parameter variation it is assumed that the entire dehydrogenation heat can be covered by the waste heat of a (high-temperature) fuel cell; hydrogen burning is therefore not necessary. The corresponding efficiencies are listed in Table 11. By comparing the results, the following statements can be made.
| Value | NEC | DBT | AB | FA | MET | NAP | TOL | CGH2 |
|---|---|---|---|---|---|---|---|---|
| η H2 | 84.7 (98.9) | 81.9 (99.0) | 84.2 (92.9) | 12.5 (13.4) | 78.1 (83.6) | 75.6 (94.0) | 75.2 (93.2) | 97.3 |
| η transport | 92.8 | 92.8 | 85.5 | 90.3 | 97.6 | 90.4 | 92.8 | 79.2 |
| η chain | 26.9 | 26.9 | 24.0 | 4.3 | 24.0 | 24.9 | 25.3 | 23.9 |
• Storage efficiency. Covering the heat demand for dehydrogenation with waste heat from the fuel cells greatly increases storage efficiency; especially N-ethylcarbazole shows high values. If hydrogenation heat can also be used, the systems of N-ethylcarbazole and dibenzyltoluene even surpass compressed hydrogen.
• Transport efficiency. Also storage density can be increased this way since no additional hydrogen for combustion needs to be stored. This also improves the possible payload per ship resulting in less trips and less energy consumption, which in turn increases the transport efficiency.
• Chain efficiency. With covering of the dehydrogenation heat by waste heat of fuel cells higher efficiencies compared to compressed hydrogen can be achieved with regard to the whole process chain.
The efficiencies of the electrolysis process and the fuel cells might differ from the values assumed here because of technical improvements or incorrect operation. Thus, their impact on the chain efficiency is evaluated within a range of ±20%. Furthermore, the influence of the driving speed and the fuel demand of the ships is assessed. As an example, the results for dibenzyltoluene are summarized in Table 12. They show that both efficiencies have a high impact, whereas the driving speed and fuel consumption only slightly effect the chain efficiency.
| Reference (%) | Electrolysis efficiency (%) | Fuel cell efficiency (%) | Driving speed (%) | Fuel consumption (%) | |
|---|---|---|---|---|---|
| +20 | |||||
| Chain efficiency | 20.0 | 23.7 | 24.0 | 20.2 | 19.8 |
| Transport efficiency | 90.3 | — | — | 92.0 | 88.4 |
| −20 | |||||
| Chain efficiency | 20.0 | 16.2 | 16.0 | 19.7 | 20.2 |
| Transport efficiency | 90.3 | — | — | 87.9 | 92.3 |
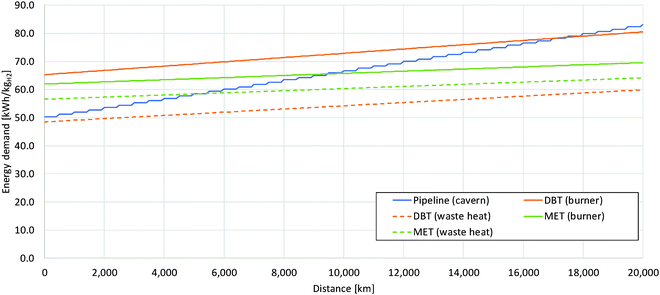
The energy consumption of the entire process chain related to the transport distance is shown in Fig. 9 for dibenzyltoluene and methanol as examples with covering of the dehydrogenation heat by partially burning hydrogen and by waste heat of fuel cells, respectively. The pipeline system is also depicted as a reference; here with each compression stage additional energy is consumed resulting in a sharp increase in energy consumption. Methanol shows the lowest gradient depending on the transport distance due to the high possible payload of the tanker. For longer distances methanol becomes more efficient than the pipeline transport; the respective distance depends on whether dehydrogenation heat is covered through waste heat or through partially burning the hydrogen. Dibenzyltoluene with sufficient fuel cell waste heat for dehydrogenation heating is always more efficient than compressed hydrogen. However, its energy demand is increasing more strongly than with methanol due to a lower payload. The option of burning a share of the released hydrogen is only more efficient after very long distances than compressed hydrogen.
5.3 Economic analysis
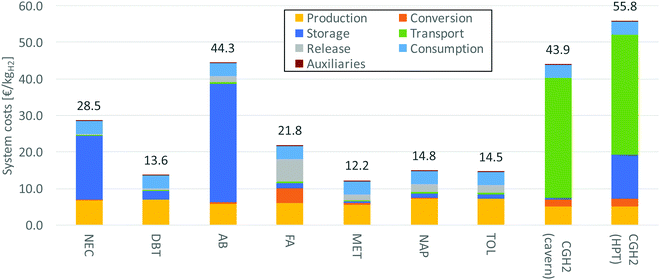
Based on the process simulation results stated above the various process chains are analyzed economically. The respective results are summarized in Table 13. Thus the total costs are lowest for methanol and dibenzyltoluene with approximately 134.4 M€ per a and 149.8 M€ per a, respectively. The system costs are displayed in Fig. 10. The following conclusions can be drawn.| Storagea | Conversion | Release | Production | Consumption | Transport | Auxiliaries | Total | |
|---|---|---|---|---|---|---|---|---|
| a Including LOHC purchase and exchange. | ||||||||
| Values in k€ per a | ||||||||
| NEC | 193![[thin space (1/6-em)]](https://www.rsc.org/images/entities/char_2009.gif) 153 153 |
942 | 2947 | 74![[thin space (1/6-em)]](https://www.rsc.org/images/entities/char_2009.gif) 401 401 |
38![[thin space (1/6-em)]](https://www.rsc.org/images/entities/char_2009.gif) 963 963 |
4351 | 27 | 314![[thin space (1/6-em)]](https://www.rsc.org/images/entities/char_2009.gif) 784 784 |
| DBT | 25![[thin space (1/6-em)]](https://www.rsc.org/images/entities/char_2009.gif) 048 048 |
1310 | 4279 | 75![[thin space (1/6-em)]](https://www.rsc.org/images/entities/char_2009.gif) 786 786 |
38![[thin space (1/6-em)]](https://www.rsc.org/images/entities/char_2009.gif) 963 963 |
4351 | 28 | 149![[thin space (1/6-em)]](https://www.rsc.org/images/entities/char_2009.gif) 765 765 |
| AB | 357![[thin space (1/6-em)]](https://www.rsc.org/images/entities/char_2009.gif) 725 725 |
4211 | 18![[thin space (1/6-em)]](https://www.rsc.org/images/entities/char_2009.gif) 898 898 |
64![[thin space (1/6-em)]](https://www.rsc.org/images/entities/char_2009.gif) 174 174 |
38![[thin space (1/6-em)]](https://www.rsc.org/images/entities/char_2009.gif) 963 963 |
4912 | 26 | 488![[thin space (1/6-em)]](https://www.rsc.org/images/entities/char_2009.gif) 910 910 |
| FA | 16![[thin space (1/6-em)]](https://www.rsc.org/images/entities/char_2009.gif) 822 822 |
45![[thin space (1/6-em)]](https://www.rsc.org/images/entities/char_2009.gif) 350 350 |
67![[thin space (1/6-em)]](https://www.rsc.org/images/entities/char_2009.gif) 500 500 |
65![[thin space (1/6-em)]](https://www.rsc.org/images/entities/char_2009.gif) 300 300 |
38![[thin space (1/6-em)]](https://www.rsc.org/images/entities/char_2009.gif) 963 963 |
4351 | 2095 | 240![[thin space (1/6-em)]](https://www.rsc.org/images/entities/char_2009.gif) 381 381 |
| MET | 4845 | 3835 | 18![[thin space (1/6-em)]](https://www.rsc.org/images/entities/char_2009.gif) 925 925 |
61![[thin space (1/6-em)]](https://www.rsc.org/images/entities/char_2009.gif) 797 797 |
38![[thin space (1/6-em)]](https://www.rsc.org/images/entities/char_2009.gif) 963 963 |
3978 | 2054 | 134![[thin space (1/6-em)]](https://www.rsc.org/images/entities/char_2009.gif) 397 397 |
| NAP | 14![[thin space (1/6-em)]](https://www.rsc.org/images/entities/char_2009.gif) 620 620 |
1757 | 24![[thin space (1/6-em)]](https://www.rsc.org/images/entities/char_2009.gif) 626 626 |
78![[thin space (1/6-em)]](https://www.rsc.org/images/entities/char_2009.gif) 691 691 |
38![[thin space (1/6-em)]](https://www.rsc.org/images/entities/char_2009.gif) 963 963 |
4725 | 29 | 163![[thin space (1/6-em)]](https://www.rsc.org/images/entities/char_2009.gif) 411 411 |
| TOL | 12![[thin space (1/6-em)]](https://www.rsc.org/images/entities/char_2009.gif) 610 610 |
796 | 23![[thin space (1/6-em)]](https://www.rsc.org/images/entities/char_2009.gif) 722 722 |
78![[thin space (1/6-em)]](https://www.rsc.org/images/entities/char_2009.gif) 938 938 |
38![[thin space (1/6-em)]](https://www.rsc.org/images/entities/char_2009.gif) 963 963 |
4351 | 25 | 159![[thin space (1/6-em)]](https://www.rsc.org/images/entities/char_2009.gif) 405 405 |
| CGH2 (cavern) | 3989 | 21![[thin space (1/6-em)]](https://www.rsc.org/images/entities/char_2009.gif) 072 072 |
0 | 56![[thin space (1/6-em)]](https://www.rsc.org/images/entities/char_2009.gif) 388 388 |
38![[thin space (1/6-em)]](https://www.rsc.org/images/entities/char_2009.gif) 963 963 |
363![[thin space (1/6-em)]](https://www.rsc.org/images/entities/char_2009.gif) 865 865 |
33 | 484![[thin space (1/6-em)]](https://www.rsc.org/images/entities/char_2009.gif) 311 311 |
| CGH2 (HPT) | 132![[thin space (1/6-em)]](https://www.rsc.org/images/entities/char_2009.gif) 490 490 |
23![[thin space (1/6-em)]](https://www.rsc.org/images/entities/char_2009.gif) 878 878 |
0 | 56![[thin space (1/6-em)]](https://www.rsc.org/images/entities/char_2009.gif) 388 388 |
38![[thin space (1/6-em)]](https://www.rsc.org/images/entities/char_2009.gif) 963 963 |
363![[thin space (1/6-em)]](https://www.rsc.org/images/entities/char_2009.gif) 865 865 |
33 | 615![[thin space (1/6-em)]](https://www.rsc.org/images/entities/char_2009.gif) 618 618 |
• Production. Hydrogen production is a big cost factor determining the overall system costs. Electrolysis shows high capital investment and high electricity costs. For compressed hydrogen the costs are lower, since less hydrogen needs to be produced due to higher storage efficiencies.
• Conversion. The costs for conversion depend on the space-time-values of each reaction. Since N-ethylcarbazole shows the highest values, its reactor investments are comparatively low. Compared to the other costs, conversion is negligible. This is not true for formic acid showing high conversion costs due to its low space-time-yield. The compression of hydrogen is more expensive compared to the hydrogenation of the LOHCs (except formic acid).
• Storage. Initially a specific amount of LOHC must be purchased for storage; additionally, there is a need to replace it during operation at certain intervals. Both factors are included in the cost parameter “storage”. N-Ethylcarbazole and 1,2-dihydro-1,2-azaborine have high raw material prices determining the comparatively high overall storage costs. Cavern storage is also relatively expensive, yet still cheaper than high-pressure tanks as well as N-ethylcarbazole and 1,2-dihydro-1,2-azaborine storage.
• Transport. Transport costs are comparably low among all LOHCs. Compressed hydrogen has especially high costs regarding transport. The high capital investment of the pipeline makes this transport option unattractive in comparison to LOHC transport.
• Release. The release costs include apart from the dehydrogenation reactor also the costs for the hydrogen burner and hydrogen purification. For the costs of the dehydrogenation (release) reactor again the space-time-values of each reaction are decisive. For all LOHCs except formic acid, which shows a low space-time-yield, these costs are insignificant in comparison. This cost category is omitted for compressed hydrogen.
• Consumption. Since all systems show the same output, the fuel cell (consumption) costs are the same. But within a cost comparison this is an important parameter; this is especially true for dibenzyltoluene, methanol, naphthalene and toluene.
• Auxiliaries. Auxiliaries include costs for pumps, compressors and blowers. They are negligible within the overall context. Methanol and formic acid, however, show significantly higher costs compared to the other LOHCs, because the compression of carbon dioxide is more expensive than the pumping of a liquid LOHC.
Some economic parameters are characterized by high uncertainties. The assumptions realized here might influence the overall storage costs significantly. Thus, a sensitivity analysis is applied to investigate their impact. The parameters are varied by ±20%. The results of this investigation are exemplary shown for dibenzyltoluene and the pipeline with cavern storage in Fig. 11.
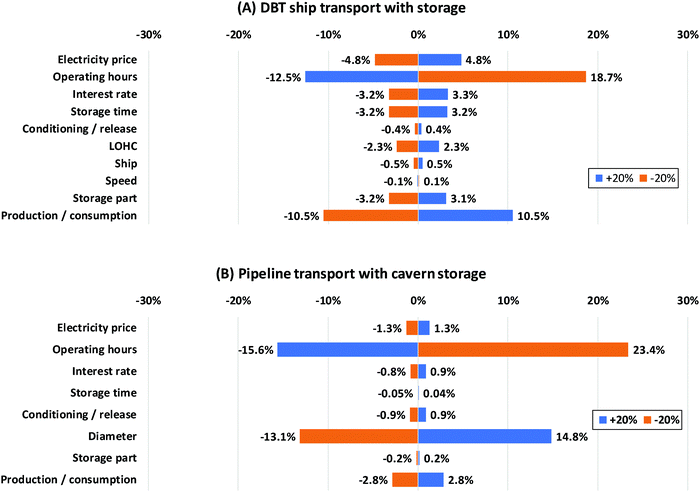 | ||
| Fig. 11 Sensitivity analysis of the dibenzyltoluene ship transport system (A) and compressed hydrogen pipeline transport system (B). (DBT: dibenzyltoluene). | ||
Fig. 11A reveals that the electrolyzer and the fuel cell (production/consumption) greatly affect the LOHC system costs, since the capital investment is dominated by those two units. Operating hours are also a decisive factor. For increasingly more full load hours the overall costs are spread over a larger quantity of hydrogen, reducing the specific costs. The electricity price also influences the costs to a high degree since the electricity consumption of the system is high especially due to the electrolysis step. The storage time and storage part have an impact on the amount of LOHC need to be purchased to store and transport a specific amount of hydrogen. Thus, just like the purchasing price they affect the “storage” costs. For dibenzyltoluene they are of less importance. In contrast, their impact on N-ethylcarbazole and 1,2-dihydro-1,2-azaborine is much greater because of the high price.
In the case of pipeline transport with cavern storage, the system costs are dominated by the capital investment for the transport infrastructure. Other costs are comparatively small. Thus, the operating hours and the pipeline diameter have the greatest impact on the overall costs (Fig. 11B). Fewer operating hours result in a low utilization rate of the pipeline designed for a certain flow. It therefore cannot react flexibly to a reduced load like ships; this increases the specific costs. The pipeline diameter is decisive for the capital investment of the pipeline and therefore a crucial factor for the system costs.
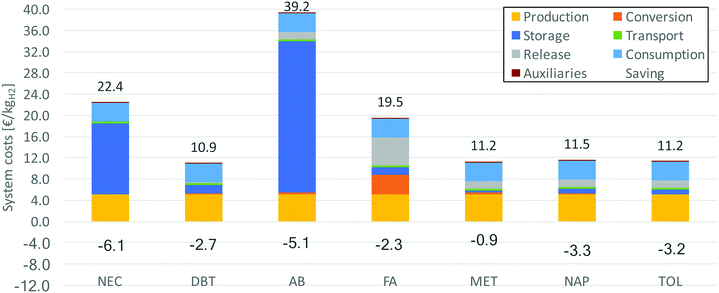
Also the costs are investigated for covering of the dehydrogenation heat by the waste heat of a fuel cell. Fig. 12 shows the system costs and the savings compared to internal covering through partially burning the released hydrogen. It becomes apparent that especially for LOHCs with high raw material prices, the costs can be significantly reduced. Since less LOHC is needed to store the same amount of useable hydrogen, the purchasing is comparatively less expensive.
Since large amounts of industrial carbon dioxide may not be available in remote locations, CO2 capture from air is a potential technology to adequately supply the formic acid and methanol systems. However, this would increase the raw material costs to 30–210 € per tCO2.73,74 Thus a middle value of approx. 100 € per tCO2 seems reasonable. Using captured CO2 from air results in system costs of 23.2 € per kgH2 for formic acid and 12.7 € per kgH2 for methanol. This is an increase of 8 and 4%, respectively. A price increase is therefore not insignificant for the overall system costs, but does not worsen the overall performance of methanol in the LOHC comparison.
5.4 Literature comparison
Also in other investigations, process chains of selected LOHCs have been assessed related to technical and economic parameters. Transport is typically not considered. Thus, the electrical efficiency, which equals the chain efficiency without transport energy consumption, is stated. An overview of the various results found in the literature with the assumptions made for electrolysis and fuel cell efficiency in comparison to the results of this investigation is shown in Table 14.| LOHC | Study | Electrolysis efficiency [% HHV] | Fuel cell efficiency [% HHV] | Covering dehydrogenation heat demand | Hydrogen efficiency [%] | Electrical efficiency [%] | Costs [€ per kgH2] |
|---|---|---|---|---|---|---|---|
| a Hydrogen conditioning with 8000 hours operating time per year. b Hydrogen conditioning and storage; 5300 hours operating time per year; storage time 60 days. | |||||||
| NEC | This study | 81.5 | 35.0 | Burner | 62.6 (76.4) | 21.5 | — |
| Teichmann et al.29 | 83.3 | 45.6 | Burner | — | 28.0 | — | |
| Müller. et al.75 | 83.3 | 45.6 | Burner | — | 30.8 | ||
| Wang et al.39 | — | — | Burner | 69.2 (88.7) | — | — | |
| This study | 81.5 | 35.0 | Waste heat | 84.7 (98.9) | 28.4 | 0.06a | |
| Teichmann et al.29 | 83.3 | 45.6 | Waste heat | — | 38.0 | — | |
| Choi et al.76 | — | — | Waste heat | 86.1 | — | — | |
| Teichmann et al.27 | — | — | Waste heat | — | — | 0.24a | |
| TOL | This study | 81.5 | 35.0 | Waste heat | — | 26.7 | — |
| Müller et al.75 | 83.3 | 46.5 | Waste heat | — | 31.2 | — | |
| DBT | This study | 81.5 | 35.0 | Waste heat | — | 28.4 | 1.9b |
| Krieger et al.38 | 71.0 | 42.3 | Waste heat | — | 28.5 | ||
| Reuß et al.77 | — | — | Waste heat | — | — | 1.3b | |
| AB | This study | 81.5 | 35.0 | Burner | — | 23.4 | — |
| Müller et al.30 | 82.7 | 55.0 | Burner | — | 29.1 | — | |
| FA | This study | 81.5 | 35.0 | Burner | 11.0 (11.8) | 3.8 | — |
| Schmidt et al.78 | 70.9 | 42.3 | Burner | 5.0 | 2 | — | |
The efficiencies calculated here are different compared to other studies. But these differences can be explained with the different efficiencies assumed here for electrolysis and fuel cell operation. For example, the hydrogen storage efficiency using formic acid as hydrogen storage here is lower compared to Schmidt et al.78 because a slightly higher yield of formic acid is assumed increasing the respective efficiency.
Economic calculations are rather rare. A comparison of the costs for hydrogen conditioning (hydrogenation) and release (dehydrogenation) using N-ethylcarbazole from Teichmann et al.27 results in lower costs. This is mainly due to different assumptions concerning the specific hydrogenation reactor costs (153 € per kW and 287 € per kW, respectively). Compared to that, hydrogen storage costs for a dibenzyltoluene system are higher here compared to the results of Reuß et al.,77 even though the costs for the hydrogenation and dehydrogenation sites are estimated to be lower in this study. A reduced plant lifetime and a higher LOHC price are largely responsible for these cost differences.
6. Final consideration
The overall goal of this paper is to present an extensive assessment of different LOHC storage systems in terms of technical and economic aspects and to evaluate their suitability for transport and storage applications. Therefore, seven different LOHCs have been identified and simulated under similar assumptions. The results have been assessed related to technical and economic parameters. The presented overall results show a broad variety of useable LOHCs, each with specific advantages and disadvantages under different storage and operating conditions.• Covering dehydrogenation heat through partially burning the released hydrogen, 1,2-dihydro-1,2-azaborine and methanol are particularly interesting from an energetic point of view due to their low heat demand for dehydrogenation. The additional power consumption for hydrogen purification for 1,2-dihydro-1,2-azaborine and for hydrogen purification and carbon dioxide compression for methanol are the reasons that not even better results are achieved. Dibenzyltoluene and N-ethylcarbazole (higher heating demands but no hydrogen purification) are also reasonable; yet, efficiencies of compressed hydrogen cannot be matched. However, the transport using LOHC ships is more efficient than pipeline transport. Formic acid is very inefficient due to the necessary energy-intensive distillation step.
• When the dehydrogenation heat demand is covered by waste heat from (high-temperature) fuel cells, N-ethylcarbazole and dibenzyltoluene are energetically the most promising LOHCs due to their lack of purification; they even surpass compressed hydrogen efficiencies. The approach of improving efficiency must therefore largely be based on the dehydrogenation step.
• From an economic perspective, methanol shows the highest potential of all assessed LOHCs under the given circumstances, followed by dibenzyltoluene and toluene; the main advantage is the low raw material prices. Transport by ships is significantly cheaper than pipeline transport of compressed hydrogen.
• Providing the heat for dehydrogenation from fuel cells not only improves the overall efficiencies but also lowers the costs. Especially N-ethylcarbazole and 1,2-dihydro-1,2-azaborine benefit from it, while the impact on methanol is minimal. In addition to the provision of dehydrogenation heat, there is further potential for reduction in electrolysis and fuel cell investment as well as LOHC raw material prices.
• The LOHCs dibenzyltoluene, methanol and toluene are ready for introduction to the market as their conversion and release systems are technologically mature.
LOHC technology is an interesting option for energy transport and is especially attractive because the substances have similar properties compared to crude oil. Thus, LOHCs can be used based at least partly on the existing infrastructure for crude oils. Dibenzyltoluene, methanol and toluene show in this regard the highest potential. However, there is still a need for further development, among others, in terms of reactor systems, process heat integration and LOHC optimization. Future cost reductions can be expected by large scale realization of such systems. Overall, this technology is an attractive alternative for sustainable and efficient energy transport and can thus contribute to the implementation of a climate-friendly hydrogen economy in all sectors of the overall energy system.
Conflicts of interest
There are no conflicts to declare.Acknowledgements
We would like to thank the National Organisation Hydrogen and Fuel Cell Technology for supporting this work.References
- REN21, Renewables 2017. Global Status Report, REN21, Montréal, QC, CA, 2017.
- DTU, Globalwindatlas, available at: https://www.globalwindatlas.info/, accessed12 June 2018.
- Solargis, Global Solar Atlas, available at: http://www.globalsolaratlas.info/?c=18.229351,36.914063,4&s=10.141932,57.172852, accessed 12 June 2018.
- P. Adametz, K. Müller and W. Arlt, Energetic Evaluation of Hydrogen Storage in Metal Hydrides, Int. J. Energy Res., 2016, 40, 1820–1831 CrossRef CAS.
- J. Jepsen, Technical and Economic Evaluation of Hydrogen Storage Systems Based on Light Metal Hydrides, 2014, pp. 1–150 Search PubMed.
- A. Züttel, Materials for hydrogen storage, Mater. Today, 2003, 6, 24–33, DOI:10.1016/S1369-7021(03)00922-2.
- P. Di Profio, S. Arca, F. Rossi and M. Filipponi, Comparison of Hydrogen Hydrates with Existing Hydrogen Storage Technologies, Int. J. Hydrogen Energy, 2009, 34, 9173–9180, DOI:10.1016/j.ijhydene.2009.09.056.
- T. Motyka, Metal Hydrides, 2015 Search PubMed.
- N. Itoh, W. C. Xu, S. Hara and K. Sakaki, Electrochemical coupling of benzene hydrogenation and water electrolysis, Catal. Today, 2000, 56, 307–314, DOI:10.1016/S0920-5861(99)00288-6.
- N. Kariya, A. Fukuoka and M. Ichikawa, Efficient evolution of hydrogen from liquid cycloalkanes over Pt-containing catalysts supported on active carbons under “wet–dry multiphase conditions”, Appl. Catal., A, 2002, 233, 91–102, DOI:10.1016/S0926-860X(02)00139-4.
- F. Sotoodeh and K. J. Smith, Structure Sensitivity of Dodecahydro-N-Ethylcarbazole Dehydrogenation over Pd Catalysts, J. Catal., 2011, 279, 36–47, DOI:10.1016/j.jcat.2010.12.022.
- F. Sotoodeh and K. J. Smith, Kinetics of Hydrogen Uptake and Release from Heteroaromatic Compounds for Hydrogen Storage, Ing. Eng. Chem. Res., 2009, 49, 1018–1026, DOI:10.1021/ie9007002.
- K. Stark, V. N. Emel’Yanenko, A. A. Zhabina, M. A. Varfolomeev, S. P. Verevkin, K. Müller and W. Arlt, Liquid Organic Hydrogen Carriers, Ind. Eng. Chem. Res., 2015, 54, 7953–7966, DOI:10.1021/acs.iecr.5b01841.
- K. Müller, K. Stark, V. N. Emel’Yanenko, M. A. Varfolomeev, D. H. Zaitsau, E. Shoifet, C. Schick, S. P. Verevkin and W. Arlt, Liquid Organic Hydrogen Carriers, Ind. Eng. Chem. Res., 2015, 54, 7967–7976, DOI:10.1021/acs.iecr.5b01840.
- R. Biniwale, S. Rayalu, S. Devotta and M. Ichikawa, Chemical Hydrides, Int. J. Hydrogen Energy, 2008, 33, 360–365, DOI:10.1016/j.ijhydene.2007.07.028.
- F. Sotoodeh, B. J. M. Huber and K. J. Smith, Dehydrogenation Kinetics and Catalysis of Organic Heteroaromatics for Hydrogen Storage, Int. J. Hydrogen Energy, 2012, 37, 2715–2722, DOI:10.1016/j.ijhydene.2011.03.055.
- K. Müller, R. Aslam, A. Fischer, K. Stark, P. Wasserscheid and W. Arlt, Experimental Assessment of the Degree of Hydrogen Loading for the Dibenzyl Toluene Based LOHC System, Int. J. Hydrogen Energy, 2016, 41, 22097–22103, DOI:10.1016/j.ijhydene.2016.09.196.
- Q.-L. Zhu and Q. Xu, Liquid Organic and Inorganic Chemical Hydrides for High-Capacity Hydrogen Storage, Energy Environ. Sci., 2015, 8, 478–512, 10.1039/C4EE03690E.
- D. Mellmann, P. Sponholz, H. Junge and M. Beller, Formic Acid as a Hydrogen Storage Material – Development of Homogeneous Catalysts for Selective Hydrogen Release, Chem. Soc. Rev., 2016, 45, 3954–3988, 10.1039/C5CS00618J.
- T. He, Q. Pei and P. Chen, Liquid Organic Hydrogen Carriers, J. Energy Chem., 2015, 24, 587–594, DOI:10.1016/j.jechem.2015.08.007.
- T. He, P. Pachfule, H. Wu, Q. Xu and P. Chen, Hydrogen carriers, Nat. Rev. Mater., 2016, 1 DOI:10.1038/natrevmats.2016.59.
- M. Markiewicz, Y. Q. Zhang, A. Bösmann, N. Brückner, J. Thoming, P. Wasserscheid and S. Stolte, Environmental and Health Impact Assessment of Liquid Organic Hydrogen Carrier (LOHC) Systems, Energy Environ. Sci., 2015, 8, 1035–1045, 10.1039/C4EE03528C.
- R. H. Crabtree, Hydrogen Storage in Liquid Organic Heterocycles, Energy Environ. Sci., 2008, 1, 134, 10.1039/b805644g.
- K. Müller, J. Völkl and W. Arlt, Thermodynamic Evaluation of Potential Organic Hydrogen Carriers, Energy Technol., 2013, 1, 20–24, DOI:10.1002/ente.201200045.
- Air Products and Chemicals Inc., US2004/0223907 A1, 2003.
- Air Products and Chemicals Inc., US8003073 B2, 2008.
- D. Teichmann, W. Arlt and P. Wasserscheid, Liquid Organic Hydrogen Carriers as an Efficient Vector for the Transport and Storage of Renewable Energy, Int. J. Hydrogen Energy, 2012, 37, 18118–18132, DOI:10.1016/j.ijhydene.2012.08.066.
- D. Teichmann, W. Arlt, P. Wasserscheid and R. Freymann, A Future Energy Supply Based on Liquid Organic Hydrogen Carriers (LOHC), Energy Environ. Sci., 2011, 4, 2767, 10.1039/c1ee01454d.
- D. Teichmann, K. Stark, K. Müller, G. Zittl, P. Wasserscheid and W. Arlt, Energy Storage in Residential and Commercial Buildings via Liquid Organic Hydrogen Carriers (LOHC), Energy Environ. Sci., 2012, 5, 9044, 10.1039/c2ee22070a.
- K. Müller, K. Stark, B. Müller and W. Arlt, Amine Borane Based Hydrogen Carriers, Energy Fuels, 2012, 26, 3691–3696, DOI:10.1021/ef300516m.
- P. Preuster, C. Papp and P. Wasserscheid, Liquid Organic Hydrogen Carriers (LOHCs), Acc. Chem. Res., 2017, 50, 74–85, DOI:10.1021/acs.accounts.6b00474.
- M. Eypasch, M. Schimpe, A. Kanwar, T. Hartmann, S. Herzog, T. Frank and T. Hamacher, Model-Based Techno-Economic Evaluation of an Electricity Storage System Based on Liquid Organic Hydrogen Carriers, Appl. Energy, 2017, 185, 320–330, DOI:10.1016/j.apenergy.2016.10.068.
- R. K. Ahluwalia, T. Q. Hua, J.-K. Peng, M. Kromer, S. Lasher, K. McKenney, K. Law and J. Sinha, Technical Assessment of Organic Liquid Carrier Hydrogen Storage Systems for Automotive Applications, Executive Summary, available at: https://www1.eere.energy.gov/hydrogenandfuelcells/pdfs/liquid_carrier_h2_storage.pdf, accessed 25 June 2018.
- P. Adametz, C. Pötzinger, S. Müller, K. Müller, M. Preißinger, R. Lechner, D. Brüggemann, M. Brautsch and W. Arlt, Thermodynamic Evaluation and Carbon Footprint Analysis of the Application of Hydrogen-Based Energy-Storage Systems in Residential Buildings, Energy Technol., 2017, 5, 495–509, DOI:10.1002/ente.201600388.
- A. Haupt and K. Müller, Integration of a LOHC Storage into a Heat-Controlled CHP System, Energy, 2017, 118, 1123–1130, DOI:10.1016/j.energy.2016.10.129.
- G. W. H. Scherer and E. Newson, Analysis of the Seasonal Energy Storage of Hydrogen in Liquid Organic Hydrides, Int. J. Hydrogen Energy, 1998, 23, 19–25 CrossRef CAS.
- T. Rüde, A. Bösmann, P. Preuster, P. Wasserscheid, W. Arlt and K. Müller, Resilience of Liquid Organic Hydrogen Carrier Based Energy-Storage Systems, Energy Technol., 2018, 6, 529–539, DOI:10.1002/ente.201700446.
- C. Krieger, K. Müller and W. Arlt, Coupling of a Liquid Organic Hydrogen Carrier System with Industrial Heat, Chem. Eng. Technol., 2016, 39, 1570–1574, DOI:10.1002/ceat.201600180.
- H. Wang, X. Zhou and M. Ouyang, Efficiency Analysis of Novel Liquid Organic Hydrogen Carrier Technology and Comparison with High Pressure Storage Pathway, Int. J. Hydrogen Energy, 2016, 41, 18062–18071, DOI:10.1016/j.ijhydene.2016.08.003.
- M. Carmo, D. L. Fritz, J. Mergel and D. Stolten, A Comprehensive Review on PEM Water Electrolysis, Int. J. Hydrogen Energy, 2013, 38, 4901–4934, DOI:10.1016/j.ijhydene.2013.01.151.
- O. Z. Sharaf and M. F. Orhan, An Overview of Fuel Cell Technology, Renewable Sustainable Energy Rev., 2014, 32, 810–853, DOI:10.1016/j.rser.2014.01.012.
- Aspen Technology, Aspen Plus – Process Simulation for Chemicals, Version 8.8, available at: https://www.aspen-tech.com/products/engineering/aspen-plus, accessed 18 May 2018.
- I. C. Kemp, Pinch Analysis and Process Integration. A User Guide on Process Integration for the Efficient Use of Energy, Elsevier Science, Burlington, 2nd edn, 2011 Search PubMed.
- V. D. Ingenieure, Betriebswirtschaftliche Berechnungen für Investitionsgüter und Anlagen, Beuth-Verlag, 2012 Search PubMed.
- G. P. Towler and R. K. Sinnott, Chemical engineering design. Principles, practice and economics of plant and process design, Elsevier/Butterworth-Heinemann, Amsterdam, Boston, 2008 Search PubMed.
- M. S. Peters, K. D. Timmerhaus and R. E. West, Plant design and economics for chemical engineers, McGraw-Hill, Boston, 5th edn, 2004 Search PubMed.
- D. Teichmann, PhD thesis, Dissertation, Friedrich-Alexander-Universität, 2014.
- Hydrogenious Technologies, Hydrogen – stored as an oil, available at: http://www.energiewende-erlangen.de/wp-content/uploads/2018/02/0_HydrogeniousTechnologies.pdf, accessed 8 June 2018.
- S. Hodoshima, S. Takaiwa, A. Shono, K. Satoh and Y. Saito, Hydrogen Storage by Decalin/Naphthalene Pair and Hydrogen Supply to Fuel Cells by Use of Superheated Liquid-Film-Type Catalysis, Appl. Catal., A, 2005, 283, 235–242, DOI:10.1016/j.apcata.2005.01.010.
- Mitsui & Co, The World's First Global Hydrogen Supply Chain Demonstration Project, available at: https://www.mitsui.com/jp/en/release/2017/1224164_10832.html, accessed 8 June 2018.
- S. Sicar and T. C. Golden, Pressure Swing Adsorption Technology for Hydrogen Production, Hydrogen and Syngas Production and Purification Technologies, 2009, vol. 10, pp. 414–450 Search PubMed.
- M. Fasihi, D. Bogdanov and C. Breyer, Techno-Economic Assessment of Power-to-Liquids (PtL) Fuels Production and Global Trading Based on Hybrid PV-Wind Power Plants, Energy Procedia, 2016, 99, 243–268, DOI:10.1016/j.egypro.2016.10.115.
- ASUE, Brennstoffzellen Für Die Hausenergieversorgung Funktionsweise, Entwicklung Und Marktübersicht, available at: http://www.asue.de/sites/default/files/asue/themen/brennstoffzellen/2016/broschueren/05_03_16_asue_brennstoffzellen_hausenergieversorgung.pdf.
- M. Wietschel, M. Ball, U. Hasenauer, H. Landinger, A. Mattucci, H. P. Ingólfsson and P. Tarquini, Projektbericht: Energy Corridor Optimization for European Markets of Gas, Electricity and Hydrogen. Project Acronym: ENCOURAGED, Fraunhofer Institut für System- und Innovationsforschung (ISI), 2006 Search PubMed.
- N. Brückner, K. Obesser, A. Bösmann, D. Teichmann, W. Arlt, J. Dungs and P. Wasserscheid, Evaluation of Industrially Applied Heat-Transfer Fluids as Liquid Organic Hydrogen Carrier Systems, ChemSusChem, 2014, 7, 229–235, DOI:10.1002/cssc.201300426.
- J. F. Hull, Y. Himeda, W.-H. Wang, B. Hashiguchi, R. Periana, D. J. Szalda, J. T. Muckerman and E. Fujita, Reversible Hydrogen Storage Using CO2 and a Proton-Switchable Iridium Catalyst in Aqueous Media under Mild Temperatures and Pressures, Nat. Chem., 2012, 4, 383–388, DOI:10.1038/nchem.1295.
- C. Yang, Z. Ma, N. Zhao, W. Wei, T. Hu and Y. Sun, Methanol synthesis from CO2-rich syngas over a ZrO2 doped CuZnO catalyst, Catal. Today, 2006, 115, 222–227, DOI:10.1016/j.cattod.2006.02.077.
- K.-C. Park, D.-J. Yim and S.-K. Ihm, Characteristics of Al-MCM-41 Supported Pt Catalysts, Catal. Today, 2002, 74, 281–290 CrossRef CAS.
- S. M. Shuwa, B. Y. Jibril and R. S. Al-Hajri, Hydrogenation of toluene on Ni–Co–Mo supported zeolite catalysts, Nig. J. Technol., 2018, 36, 1114, DOI:10.4314/njt.v36i4.17.
- M. Saito, R&D activities in Japan on methanol synthesis from CO2 and H2, Catal. Surv. Jpn., 1998, 2, 175–184, DOI:10.1023/A:1019082525994.
- C. Zhang, Z. Yuan, N. Liu and S. Wang, Study of Catalysts for Hydrogen Production by the High Temperature Steam Reforming of Methanol, Fuel Cells, 2006, 6, 466–471, DOI:10.1002/fuce.200600010.
- Y. Okada, E. Sasaki, E. Watanabe, S. Hyodo and H. Nishijima, Development of Dehydrogenation Catalyst for Hydrogen Generation in Organic Chemical Hydride Method, Int. J. Hydrogen Energy, 2006, 31, 1348–1356, DOI:10.1016/j.ijhydene.2005.11.014.
- H. Jorschick, P. Preuster, S. Dürr, A. Seidel, K. Müller, A. Bösmann and P. Wasserscheid, Hydrogen storage using a hot pressure swing reactor, Energy Environ. Sci., 2017, 10, 1652–1659, 10.1039/C7EE00476A.
- G. Parks, R. Boyd, J. Cornish and R. Remick, Hydrogen Station Compression, Storage, and Dispensing Technical Status and Costs, Systems Integration, available at: https://www.nrel.gov/docs/fy14osti/58564.pdf.
- A. Acht, Salzkavernen zur Wasserstoffspeicherung.
- W. Arlt, Speicherung Elektrischer Energie, Chemische Speicherung Elektrischer Energie, München, 2014 Search PubMed.
- P. Markussen, J. Austell and C. Hustad, A CO2-Infrastructure for Eor in the North Sea (Cens), Greenhouse Gas Control Technologies – 6th Internation Conference, 2003, pp. 1077–1082.
- Alibaba, Preis für Naphthalene, available at: https://www.alibaba.com/product-detail/Refined-naphthalene-CAS-NO-91-20_60722181200.html?spm=a2700.7724838.2017115.29.3b49557eoq81ev&s=p, accessed 2 May 2018.
- Intratec, Average toluene price, 2007–2010, available at: https://www.intratec.us/chemical-markets/toluene-price, accessed 8 June 2018.
- D. Krieg, Konzept und Kosten eines Pipelinesystems zur Versorgung des deutschen Straßenverkehrs mit Wasserstoff, Schriften des Forschungszentrums Jülich Reihe Energie & Umwelt, 2012, vol. 144 Search PubMed.
- ACCESS, Calculation of fuel consumption per mile for various ship types and ice conditions in past, present and in future.
- DOE, Multi-Year research, development, and demonstration plan, 3.2 hydrogen delivery, available at: https://www.energy.gov/sites/prod/files/2015/08/f25/fcto_myrdd_delivery.pdf, accessed 17 July 2018.
- D. W. Keith, G. Holmes, D. St. Angelo and K. Heidel, A Process for Capturing CO2 from the Atmosphere, Joule, 2018, 2, 1573–1594, DOI:10.1016/j.joule.2018.05.006.
- G. Holmes and D. W. Keith, An air-liquid contactor for large-scale capture of CO2 from air, Philos. Trans. R. Soc., A, 2012, 370, 4380–4403, DOI:10.1098/rsta.2012.0137.
- K. Müller, J. Geng and W. Arlt, Reversible vs. Irreversible Conversion of Hydrogen, Energy Technol., 2013, 1, 42–47, DOI:10.1002/ente.201200022.
- I. Y. Choi, B. S. Shin, S. K. Kwak, K. S. Kang, C. W. Yoon and J. W. Kang, Thermodynamic Efficiencies of Hydrogen Storage Processes Using Carbazole-Based Compounds, Int. J. Hydrogen Energy, 2016, 41, 9367–9373, DOI:10.1016/j.ijhydene.2016.04.118.
- M. Reuß, T. Grube, M. Robinius, P. Preuster, P. Wasserscheid and D. Stolten, Seasonal Storage and Alternative Carriers, Appl. Energy, 2017, 200, 290–302, DOI:10.1016/j.apenergy.2017.05.050.
- I. Schmidt, K. Müller and W. Arlt, Evaluation of Formic-Acid-Based Hydrogen Storage Technologies, Energy Fuels, 2014, 28, 6540–6544, DOI:10.1021/ef501802r.
Footnote |
| † Electronic supplementary information (ESI) available. See DOI: 10.1039/c8ee02700e |
| This journal is © The Royal Society of Chemistry 2019 |

