Catalytic deoxygenation of C18 fatty acid over supported metal Ni catalysts promoted by the basic sites of ZnAl2O4 spinel phase†
Guangci
Li
 *a,
Lei
Chen
a,
Ruikun
Fan
a,
Di
Liu
 b,
Song
Chen
a,
Xuebing
Li
*a and
Keng H.
Chung
a
aKey Laboratory of Biofuels, Qingdao Institute of Bioenergy and Bioprocess Technology, Chinese Academy of Sciences, Qingdao 266101, P.R. China. E-mail: ligc@qibebt.ac.cn; lixb@qibebt.ac.cn
bCollege of Chemical and Environmental Engineering, Shandong University of Science and Technology, Qingdao 266590, P.R. China
First published on 23rd November 2018
Abstract
Highly active Zn–Al composite oxides were synthesized via a hydrothermal process followed by thermal treatment and were used as supports to prepare Ni-based hydrogenation catalysts for catalytic deoxygenation of oleic acid, stearic acid, and 1-octadecanol. The results showed that increasing the temperature of hydrothermal synthesis changed the morphology of the Zn–Al composite oxides from sheet-like structures to spheroidal structures. High hydrothermal synthesis temperatures enhanced the interaction between Zn and Al atoms, resulting in more ZnAl2O4 spinel phase. This phase not only improved the chemical stability of the support but also supplied strong basic sites which efficiently inhibited the formation of by-products and increased the yield of heptadecane in the catalytic deoxygenation of oleic acid. Stearic acid and 1-octadecanol could be readily transformed to alkanes in the presence of metallic Ni and ZnAl2O4 phase. Decarbonylation of the octadecanal intermediate and dehydrogenation of 1-octadecanol were key reaction pathways to produce heptadecane, in which decarbonylation was catalyzed by metallic Ni, while the dehydrogenation was attributed to synergistic catalysis between metallic Ni and the strong basic sites of the support. Individual metallic Ni only catalyzed the cleavage of C–H bonds but did not affect the O–H bond of 1-octadecanol.
Introduction
In the past decade, the production of biomass-derived biofuels has attracted tremendous attention not only as substitutes for conventional fuels, but also due to environmental concerns, particularly greenhouse gas emissions.1 Among potential feedstocks for biofuel production, plant oils and fats and their derivative by-products, consisting primarily of triglycerides and fatty acids, are desirable for transportation fuel production because their chemical structures are long alkyl chains, similar to diesel.2 Currently, two common chemical processes for converting biomass to bio-diesel are being used, namely transesterification and catalytic deoxygenation with hydrogen.3 Under appropriate reaction conditions, triglycerides and fatty acids can be completely converted into alkanes through catalytic deoxygenation, and the final product can be either used as diesel or blended with petro-diesel. Because diesel-like alkanes have higher cetane numbers, oxidation stabilities, and calorific values than fatty acid methyl esters,4 catalytic deoxygenation is considered to be one of the most promising approaches for the conversion of natural oil sources to transportation fuels.Catalytic deoxygenation of fatty acids and esters involves three key reaction pathways: hydrodeoxygenation, hydrodecarbonylation, and hydrodecarboxylation,5 the selectivity of which is dependent on the catalyst. Currently, three types of commonly used hydrogenation catalysts are transition metal sulfide catalysts and noble and non-noble metal catalysts in reduced forms. Sulfided catalysts favor hydrodeoxygenation reactions, whereas reduced catalysts favor hydrodecarbonylation/hydrodecarboxylation reactions. Because the use of sulfided catalysts may result in sulfur-contaminated products,6 the development of non-sulfided metal catalysts, particularly Ni-based catalysts, has attracted increasing attention in recent years.7 In order to improve the activity of metallic nickel and develop superior Ni-based catalysts, various solid porous materials have been considered as supports, such as zeolites, metal/non-metal oxides, and activated carbon. Accordingly, key research areas are the effects of the support on the activities of Ni-based catalysts and the synergistic effects of the support and nickel species on the catalyst activity.8 In general, it has been concluded that the catalytic activities of nickel species and their reaction pathways are closely related to the surface acid sites of the supports. However, the role of basic sites is seldom discussed even though some supports, such as ZrO2 and CeO2, exhibit significant numbers of basic sites.
Positive effects of basic sites on the catalytic deoxygenation of fatty acids and esters have been reported. King showed that the intramolecular carboxyl groups of 2-furoic acid and carbonates can be directly removed via a decarboxylation route over hydrotalcite-like oxides.9 Na et al. demonstrated that both oleic acid and microalgae oil can be converted to alkane products in high yield using Mg–Al spinel as the catalyst.10 Our previous studies indicated that hydrotalcite-derived Zn–Al composite oxide is a promising support for preparing Ni-based catalysts, and varying the Zn/Al atom ratio could efficiently increase the exposure degree of metallic nickel.11 This improved the conversion of oleic acid and glycerol trioleate, resulting in high alkane yields. Furthermore, the catalysts with high amounts of Zn–Al spinel phase exhibited high hydrodecarbonylation selectivity. This high catalytic activity is likely related to the basic sites of spinel; however, this was not substantiated.
In this work, supports with various amounts of Zn–Al spinel were synthesized to examine the roles of the spinel and basic sites on the catalytic deoxygenation of fatty acids. The synergistic effects of nickel metal and the basic sites will be discussed.
Experimental
Preparation of Zn–Al composite oxides
Zn–Al composite oxides were prepared via a hydrothermal synthesis process followed by thermal treatment. Typically, Zn(NO3)2·6H2O (4.0 mmol), Al(NO3)3·9H2O (2.0 mmol), and urea (42.0 mmol) were dissolved in deionized water (40.0 mL) to form a colorless solution. The solution was then transferred into a 100 mL Teflon-lined stainless autoclave and heated at 180 °C for 3 h to produce the Zn–Al oxide precursor. After that, the autoclave was cooled naturally to room temperature. The white Zn–Al oxide precursor was collected by filtration and washed with deionized water until neutral pH was obtained; it was then dried in air at 80 °C overnight. The dried material was calcined at 500 °C in air for 4 h to yield the final composite oxide. Similar Zn–Al oxide precursors were synthesized at various hydrothermal temperatures (120 °C to 200 °C) to obtain composite oxides with various amounts of Zn–Al spinel. The Zn–Al oxide supports prepared at various temperatures were denoted as S-120, S-140, S-160, S-180, and S-200.Preparation of Ni-based catalysts
Supported Ni-based catalysts were prepared by an incipient wetness impregnation method. Typically, 3.4 mmol of Ni(NO3)2·6H2O was dissolved in a certain amount of deionized water; then, the solution was added dropwise to 1.8 g of the as-prepared Zn–Al composite oxide while agitating at room temperature for 2 h. The resulting substance was dried overnight at 100 °C and then calcined under nitrogen (80 mL min−1 N2) at 400 °C for 4 h. The calcined substance was reduced under hydrogen (80 mL min−1 H2) at 500 °C for 4 h to yield the supported Ni-based catalyst. The temperature-programmed heating for the calcination and reduction processes was 2 °C min−1. The supported Ni-based catalysts with various Zn–Al oxide supports were denoted as C-120, C-140, C-160, C-180, and C-200. The Ni metal loading on each catalyst was 10 wt%.Characterization of materials
The crystalline structures of the supports and Ni catalysts were characterized by X-ray diffraction (XRD) on a Bruker AXS-D8 advance powder diffractometer with a Cu Kα radiation source (wavelength: 1.5406 Å) operating at 40 kV and 40 mA. The samples were measured with a scanning rate of 4° min−1 and diffraction angles (2θ) ranging from 5 to 80°. The morphologies of the supports were determined using a Hitachi S-4800 field emission scanning electron microscope (FE-SEM) with an accelerating voltage of 1.5 kV. The metallic Ni particle sizes were measured by high-resolution transmission electron microscopy (HRTEM) on a JEM-2100HR electron microscope with an accelerating voltage of 200 V in order to determine the Ni nanoparticle size distributions. The textural properties of the supports were measured by nitrogen adsorption–desorption isotherms at −196 °C on a Quantachrome AutoSorb-6B adsorption analyzer. Each sample was degassed under vacuum at 180 °C for 6 h prior to the measurements. The specific surface areas were calculated using the Brunauer–Emmett–Teller (BET) method. The pore volumes and pore sizes were determined by the Barrett–Joyner–Halenda (BJH) method from the desorption branch of the isotherms.The interaction between the Ni species and supports was investigated by hydrogen temperature-programmed reduction (H2-TPR) measurements using a Micromeritics AutoChem II 2920 chemisorption analyzer. The test sample was 100 mg for each measurement. Each sample was charged in a U-shaped quartz cell reactor and pretreated under argon (20 ml min−1 Ar) at 300 °C for 1 h; the temperature-programmed heating was 10 °C min−1. The sample was then cooled to 100 °C. Afterwards, a mixture of 10 vol% H2/Ar (20 ml min−1) was introduced into the sample tube for 20 min, followed by temperature-programmed heating to 900 °C at 10 °C min−1; the sample was then held at this temperature for 20 min. Hydrogen consumption during the tests was determined using a thermal conductivity detector (TCD) calibrated by reduction of fresh CuO.
The surface compositions of the catalysts were analyzed by X-ray photoelectron spectroscopy (XPS) using an Escalab 250Xi Thermo Spectrometer equipped with a monochromatic Al Kα X-ray source under ultra-high vacuum (2 to 3 × 10⁻⁶ Pa) and a hemispherical analyzer. The XPS data from the regions related to the C 1s, O 1s, Zn 2p and Ni 2p core levels were recorded for each sample. The obtained spectra were fitted by mixed Gaussian–Lorentzian functions. The binding energies (BE) were internally calibrated by the reference deposit C 1s BE.
Elemental analysis of the catalysts was performed using inductively coupled plasma optical emission spectroscopy (ICP-OES) on a Leeman Labs Prodigy spectrometer. The measured contents of nickel were compared with a standard to determine the actual concentrations.
The basicity of the supports was analyzed by CO2 temperature-programmed desorption (CO2-TPD) measurements using a Micromeritics AutoChem II 2920 chemisorption analyzer. The test sample was 100 mg for each measurement. Each sample was charged in a U-shaped quartz cell reactor and pretreated under argon (20 ml min−1 Ar) at 300 °C for 1 h; the temperature-programmed heating was 10 °C min−1. The sample was then cooled to 50 °C. Afterwards, a mixture of 10 vol% CO2/Ar (20 ml min−1) was introduced into the sample tube for 1 h, followed by temperature-programmed heating to 600 °C at 10 °C min−1; the sample was then held at this temperature for 20 min. The CO2 desorption during the test was determined using a TCD. The acidities of the supports were analyzed by NH3-TPD measurements using the same device and a similar procedure to that of the CO2-TPD measurements.
Activity tests and product analyses
The catalytic deoxygenation of oleic acid was carried out in a 100 mL batch stainless autoclave with a mechanical stirrer. In each run, 0.2 g of fresh catalyst, 2.0 g of oleic acid, and 30.0 g of decalin were loaded into the autoclave. Prior to the reaction, the reactor was purged three times with H2 to remove inside air, followed by pressurization to 2.5 MPa at ambient temperature. The reaction system was subsequently heated to 280 °C and maintained at this temperature for 6 h; it was then continuously stirred at 600 rpm. The reaction system was then cooled to ambient temperature and the products were collected for subsequent analyses.The gas products were analyzed using a gas chromatography mass spectrometer (GC-MS) equipped with a TCD and a HP-PLOT/Q column (30 m × 0.32 mm, 20 micro). The liquid products were analyzed using a GC-MS with a flame ionization detector (FID) and a HP-INNOWAX column (30 m × 0.25 mm, 0.25 micro). A DB-HT-SIMDIS column (5 m × 0.53 mm, 0.15 micro) was used to detect high boiling point products, such as stearyl stearate. n-Octadecane was used as an external standard to quantify the liquid product composition. Because zinc stearate is a by-product which cannot be dissolved in decalin and analyzed using a GC-MS, the amount of zinc stearate was determined using the gravimetric method. The generated zinc stearate was obtained by heating, centrifugation, washing, and drying processes.
The HDO activities of the catalysts were estimated as follows:
The apparent reaction rates were calculated using the following equation:
The formation rates of the products were calculated using the following equation:
Results and discussion
Crystalline structures of the supports and Ni-based catalysts
The XRD patterns of the various Zn–Al composite oxide supports are shown in Fig. 1. It can be seen that the chemical compositions of the Zn–Al composite oxide supports are dependent on the temperature of the synthesis process. At a relatively low temperature, all of the diffraction peaks were for ZnO phase (JCPDS #65-3411) and no diffraction peaks for Al2O3 phase were found, indicating that the Al2O3 crystallites were too small to be detected by XRD. In this case, the Al2O3 phase was highly dispersed in ZnO phase without interaction because no Zn–Al spinel was formed (see pattern (a)). As the synthesis temperature increased, the intensity of the diffraction peaks for ZnO phase became weaker and diffraction peaks for ZnAl2O4 spinel (JCPDS #05-0669) started to appear, suggesting interactions between Zn2+ cations and Al3+ cations (see patterns (b) and (c)). At high synthesis temperatures, the intensity of the diffraction peaks for ZnAl2O4 phase became stronger while the ZnO phase peaks decreased in intensity and became undetectable (see pattern (d)), indicating that ZnAl2O4 spinel is the predominant structure in the Zn–Al composite oxide at high synthesis temperatures. Due to the lack of Al3+ cations, the excess Zn2+ cations nucleated, grew and formed amorphous ZnO phase, which is evident from the appearance of its diffraction peaks at elevated temperatures (see pattern (e)). The evolution of the crystalline structures of the Zn–Al composite oxide supports indicates that increased synthesis temperature favors the formation of stable ZnAl2O4 spinel phase.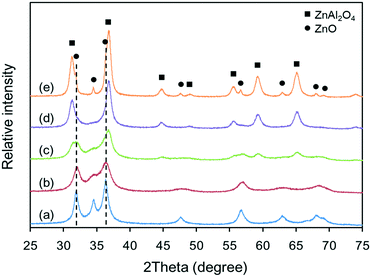 | ||
| Fig. 1 XRD patterns of Zn–Al composite oxide supports: (a) S-120, (b) S-140, (c) S-160, (d) S-180, and (e) S-200. | ||
The XRD patterns of the various Ni-based catalysts are shown in Fig. 2. Compared to the supports, the crystallite structures of the catalysts changed to some extent. The intensity of the diffraction peaks of ZnO phase in catalysts C-120, C-140 and C-160 became sharper than that in supports S-120, S-140 and S-160. This is because in the subsequent thermal treatment processes (calcination and reduction after Ni impregnation), sintering of the ZnO particles occurred, which led to increases in both the particle size and crystallinity of ZnO phase. In contrast, the intensity of the diffraction peaks of ZnAl2O4 phase remained almost unchanged due to its high thermal stability. Note that the diffraction peaks of ZnO phase were not observed in the patterns of catalysts C-180 and C-200, although they appeared in patterns of supports S-180 and S-200 in Fig. 1. Also, the diffraction peak of ZnAl2O4 phase was observed in the pattern of catalyst C-120 but not in that of support S-120. It is likely that the solid-phase reaction between ZnO and amorphous Al2O3 during the catalyst preparation step continued in the subsequent thermal treatment step.
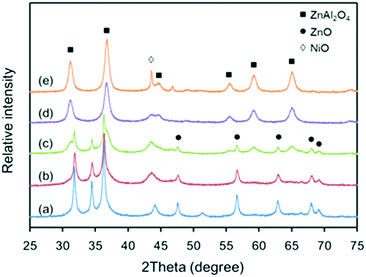 | ||
| Fig. 2 XRD patterns of the Ni-based catalysts: (a) C-120, (b) C-140, (c) C-160, (d) C-180, and (e) C-200. | ||
The standard XRD pattern of metallic Ni (JCPDS #04-0850) consists of two characteristic diffraction peaks assigned to Ni(111) and Ni(200) at 2θ angles of 44.6° and 52.1°, respectively. In Fig. 2, only the diffraction peaks of NiO phase (JCPDS #44-1159) were detected. It is likely that the metallic Ni was generated after the reduction procedure, as observed during the experiment, where the color of the unreduced catalyst changed from yellow-green to black. These results indicate that the metallic Ni crystallites were well dispersed on the surface of the catalysts and thus could not be detected by XRD.
Textural properties
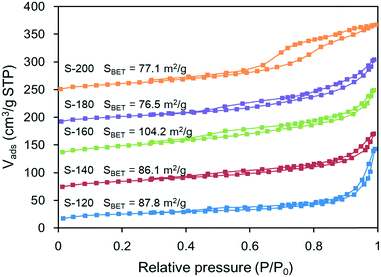
The crystalline structure of a Zn–Al composite oxide support is dependent on its composition and crystallite size; these factors are also likely to have a direct impact on its pore structure. Fig. 3 (and Table S1 in the ESI†) shows the surface areas and pore volumes of the Zn–Al composite oxide supports determined by the N2 adsorption/desorption method. Among the five support samples, S-160 had a relatively high surface area, whereas the other samples had similar surface areas when considering the experimental error associated with the BET mode; this is in agreement with the XRD characterization. As shown in Fig. 1, the diffraction peak intensity of S-160 was the lowest among the supports, suggesting that S-160 had the smallest crystallite size. It is known that the surface areas of powder materials are dependent on particle size and shape. Small crystallites aggregate to form small particles, leading to a high surface area. This can also explain the slight difference in the surface areas of S-140 and S-180. Like the surface areas, the pore volumes of all the oxide supports were similar; these are dependent on the shape and packing manner of the particles.Fig. 3 shows that the isotherm types of the various oxide supports were different. The isotherms of S-200 are of type IV, indicating the presence of large mesopores and macropores,12 whereas those for the others are of type II, which is characteristic of a mesoporous material. All the isotherms exhibited significant hysteresis loops which started at a relative pressure (P/P0) of 0.35 but showed no distinct uptake at low relative pressures, strongly suggesting the absence of micropores. In addition to the types of isotherms, the shapes of the hysteresis loops were slightly different among these supports. The hysteresis loop of S-200 was of type H2, which is characteristic of solids consisting of aggregates of spheroidal particles with nearly cylindrical pores, whereas the hysteresis loops of the other supports were of type H3, which is characteristic of solids consisting of agglomerates of plate-like particles with slit-shaped pores.12 These findings agreed with the SEM images (see Fig. S1†). At a low synthesis temperature, the composite oxide support consisted primarily of sheet-like particles (see Fig. S1a†). As the temperature increased, the number of sheet-like particles deceased and eventually disappeared, while the number of spheroidal particles increased (see Fig. S1e†). In correlation with the findings from the XRD analyses, the sheet-like and the spheroidal particles are likely composed of ZnO and ZnAl2O4, respectively. Compared to the sheet-like particles, the spheroidal particles were much smaller in size; however, due to their closely packed structures resulted in lower surface areas.
Surface basicity
The number and strength of basic sites for the Zn–Al composite oxide supports were detected by CO2-TPD, as shown in Fig. 4. The integration area under each TPD profile decreased from S-120 to S-200, indicating that as the synthesis temperature increased, the number of basic sites decreased. Note that all the supports had similar specific surface areas (SSA); thus, the varying number of basic sites among these supports is likely related to the morphology of the oxide particles. Fig. S1† shows that the particles of S-120 were primarily sheet-like structures, and they gradually evolved into spheroidal structures. In comparison, the sheet-like particles can expose larger lattice planes, which may supply more accessible basic sites. Despite this, the strength of the basic sites increased with the synthesis temperature because two distinct desorption peaks at above 400 °C were observed in the TPD profiles for S-180 and S-200, and the latter exhibited a higher CO2 desorption temperature. Cosimo et al. used the same method to characterize the basicity of Mg–Al composite oxide and found that the CO2 desorption peak for pure Al2O3 mainly appeared below 200 °C.13 This suggests that the contribution of Al3+–O2− pairs to the surface basicity is not important. Therefore, for the Zn–Al composite oxide supports, most of the basic sites likely originate from ZnO and ZnAl2O4, and the latter supplies stronger basic sites.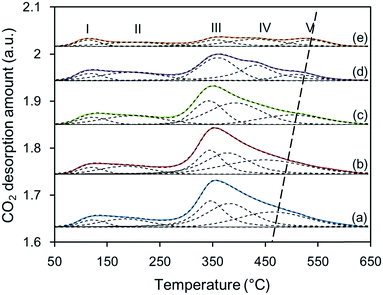 | ||
| Fig. 4 CO2-TPR profiles of Zn–Al composite oxide supports: (a) S-120, (b) S-140, (c) S-160, (d) S-180, and (e) S-200. | ||
All the TPD profiles were deconvoluted in five distinct desorption peaks with less than 5% error, and the total number and strength distribution of the basic sites can be quantitatively determined from the area and position of each individual desorption peak. Like the strengths of acidic sites, the strengths of basic sites are generally divided into three categories depending on the desorption temperature: weak, medium, and strong. However, the boundary of the basic strength is not identical, especially for medium basic sites. Liu et al. classified desorption peaks appearing at 147 °C to 377 °C as medium basic sites,14 whereas Azzouz et al. suggested that the peaks appearing at 380 °C to 450 °C indicate medium basic sites.15 In this work, based on the deconvoluted TPD profiles, the basic sites were also divided into three categories, and the temperature ranges were defined as 80 °C to 250 °C, 250 °C to 450 °C, and 450 °C to 600 °C for weak, medium, and strong basic strengths, respectively. Like the basic sites of Mg–Al composite oxide,16 the weak basic sites of Zn–Al composite oxide were related to Zn–OH and/or Al–OH groups, the medium basic sites were associated with Zn2+–O2− pairs, and the strong basic sites resulted from coordinatively unsaturated O2− ions.
Table 1 shows the distribution of the strengths of the basic sites of various Zn–Al composite oxide supports. The CO2 desorption data showed that the total number of basic sites decreased from 860 to 303 μmol g−1 as the synthesis temperature increased from 120 °C to 200 °C, which is likely related to the formation of the Zn–Al hydrate precursor. When the Zn–Al hydrate crystallites aggregated and grew in size, cross-linking of these crystallites occurred; in this process, two Zn(Al)–OH groups dehydrated to form Zn–O–Zn(Al) bonds,17 leading to a decrease in the number of OH groups and/or accessible basic sites. This process can be enhanced by increasing the synthesis temperature. In the thermal treatment step, the number of OH groups decreased further and more basic sites, such as Zn2+–O2− pairs and O2− ions, were covered or formed new chemical bonds with adjacent metal atoms by sintering. Hence, the numbers of all the basic sites decreased. The strength distribution of the three types of basic sites changed slightly. As the synthesis temperature increased, the relative amount of strong basic sites decreased from 19.8% to 17.9% and then increased to 27.1%, which is likely related to the amounts of ZnO and ZnAl2O4 phases. With the formation of ZnAl2O4, migration of Al3+ ions into the ZnO framework occurred, leading to removal of Zn2+ ions from the surface to form additional surface O2− ions.13 Hence, the surface of ZnAl2O4 is capable of supplying more strong basic sites than that of ZnO.
| Sample | Basic strength distributiona (peak area %) | CO2 desorption amount (μmol g−1) | ||
|---|---|---|---|---|
| Weak (80 °C to 250 °C) | Medium (250 °C to 450 °C) | Strong (450 °C to 600 °C) | ||
| a Because various desorption peaks in the same temperature range have overlapped areas, for comparison purposes, the data summarized in this table were obtained by calculating the profile areas between two vertical lines corresponding to the temperature range. | ||||
| S-120 | 14.8 | 65.4 | 19.8 | 860 |
| S-140 | 15.0 | 65.7 | 19.7 | 833 |
| S-160 | 16.6 | 65.5 | 17.9 | 735 |
| S-180 | 18.6 | 62.2 | 19.2 | 566 |
| S-200 | 17.3 | 55.6 | 27.1 | 303 |
Reducibility of Ni species
The interactions between NiO and the Zn–Al supports were investigated by H2-TPR experiments, and the profiles are shown in Fig. 5. The reduction peaks of Ni species for all the catalysts appeared in three temperature ranges: the peaks below 300 °C were attributed to weakly interacting NiO species; the peaks at 300 °C to 550 °C were attributed to strongly interacting NiO species; and the peaks over 550 °C were assigned to Ni-aluminate species, which are difficult to reduce. Apparently, as the synthesis temperature of the supports increased, the reduction peaks of NiO shifted to lower temperatures (the high reduction temperature decreased from 625 °C to 490 °C, the medium temperature decreased from 455 °C to 310 °C, and the low temperature was even less than 200 °C for C-180), which is likely related to the compositions of the supports. XRD patterns showed that C-120 was composed of ZnO and amorphous Al2O3; the latter phase readily interacted with NiO to form stable Ni–O–Al bonds during thermal treatment at a higher temperature, which inhibited the reduction of NiO at low temperature. As the synthesis temperature increased, the dominant phase of the supports changed from ZnO to ZnAl2O4, which in turn decreased the single Al2O3 phase because ZnAl2O4 phase is generated from Zn2+ and Al3+ ions. Consequently, the formation of Ni–O–Al bonds was inhibited and the interaction between NiO and the supports decreased. Despite this, NiO could not be completely reduced to metallic Ni at 500 °C, and the diffraction peaks of NiO remained in the XRD patterns of the catalysts. From the peak areas up to 500 °C, the calculated overall H2 consumption values of the various Ni-based catalysts were 0.33, 0.36, 0.52, 0.79, and 1.43 mmol g−1, which are equivalent to 19.4%, 21.2%, 30.6%, 46.5%, and 84.1% degrees of NiO reduction, respectively.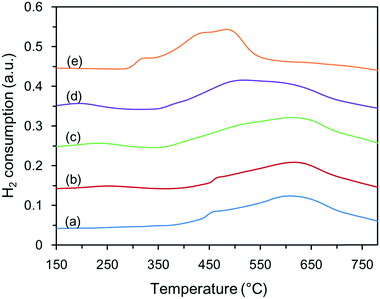 | ||
| Fig. 5 H2-TPR profiles of the unreduced Ni-based catalysts: (a) C-120, (b) C-140, (c) C-160, (d) C-180, and (e) C-200. | ||
Surface compositions of the Ni-based catalysts
Fig. 6 shows the states of Zn and Ni species in various Ni-based catalysts determined by XPS. In Fig. 6A, the Zn 2p3/2 bands for all samples can be deconvoluted into two peaks, which are assigned to ZnO and ZnAl2O4.18 The changes in the relative amounts of ZnAl2O4 agreed with the XRD analyses (see Table S2†). As reported by Druska et al., the Zn 2p3/2 binding energies of tetrahedral and octahedral Zn2+ ions were at 1021.0 to 1022.2 and 1022.9 to 1023.4 eV, respectively.19 In this work, the binding energy of Zn 2p3/2 increased slightly with the synthesis temperature of the support, indicating that the relative amount of Zn2+ ions in the octahedral sites increased.20 The gradual widening of the ZnAl2O4 peak was related to the distributions of Zn2+ ions over the tetrahedral and octahedral sites. Combined with the CO2-TPD analyses, it can be concluded that the strong basic sites not only arise from the migration of Al3+ ions to form spinel structures but also arise from the migration of Zn2+ ions from tetrahedral sites to octahedral sites to form local inverse spinel structures.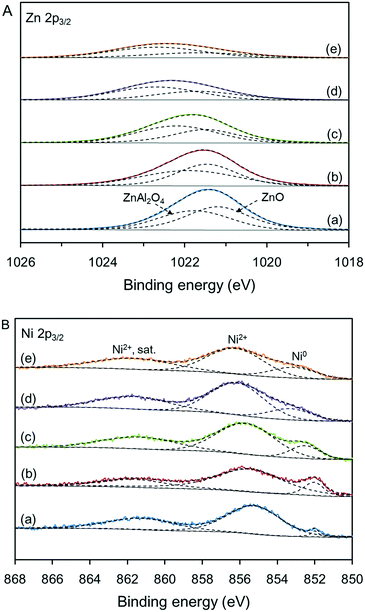 | ||
| Fig. 6 Zn 2p3/2 (A) and Ni 2p3/2 (B) XPS spectra of the various Ni-based catalysts: (a) C-120, (b) C-140, (c) C-160, (d) C-180, and (e) C-200. | ||
As shown in Fig. 6B, the Ni 2p3/2 bands were deconvoluted into three peaks at binding energies of 850.0 to 867.5 eV; these were assigned to metallic Ni, NiO species, and Ni2+ satellites,18 where the NiO species include single NiO phase and Ni-aluminate (NiAl2O4) phase. The integral areas of the peaks revealed that only a portion of NiO species was reduced to metallic Ni because of the strong metal–support interaction, which agreed with the H2-TPR results. From the XPS spectra, the calculated surface concentration of metallic Ni was much lower than the degree of NiO reduction, suggesting that most of the metallic Ni was contained in the Ni species particles and was not accessible even though its proportion increased from 7.9% to 25.0% (see Table S3†). Furthermore, the contents of Ni species of the catalysts determined by ICP-OES showed that the actual Ni content of each catalyst was close to the set value. However, the surface content of Ni species determined by XPS increased from 9.2 to 19.6 wt% as the relative amount of ZnAl2O4 phase increased, suggesting that more Ni species are present on the catalyst surface. This is also attributed to the weakening of the metal–support interaction.
HRTEM images of the as-prepared catalysts were recorded to further investigate the effects of weakening the metal–support interaction on the particle size of metallic Ni (see Fig. S2†). Note that the average size did not markedly increase, as expected, although the reduction degree of Ni species and the surface concentration of metallic Ni increased. The particle size distributions show that for catalysts C-120 and C-140, the sizes were mainly distributed in the range of 8 to 20 nm, while for the other catalysts, they were mainly distributed from 12 to 24 nm; this indicates that the particle size increases to a small extent with weakening of the interactions.
Activity tests
The effects of ZnAl2O4 phase on the catalytic activity were investigated, in which oleic acid was selected as the model compound for catalytic deoxygenation over the as-prepared Ni-based catalysts. The yields of the reaction liquid products were quantitatively analyzed by GC-MS, as shown in Table 2. Because the C![[double bond, length as m-dash]](https://www.rsc.org/images/entities/char_e001.gif) C double bonds in oleic acid molecules can be readily saturated, high conversions (>98%) were achieved for all experimental runs. The liquid products consisted of heptadecane, octadecane, 1-octadecanol, and zinc stearate. Because the yields of the alkanes were high (>85 wt%), two potential products, stearyl stearate and octadecanal, were not found in the reaction products. Unlike zeolite-based catalysts, the Ni-based catalysts lacked Brønsted acidic sites; hence, no alkane isomers or cracking products were formed. As expected, CO was the predominant gas product, indicating that the removal of oxygen atoms in the oleic acid molecules mainly occurred through a hydrogenation–decarbonylation reaction route.
C double bonds in oleic acid molecules can be readily saturated, high conversions (>98%) were achieved for all experimental runs. The liquid products consisted of heptadecane, octadecane, 1-octadecanol, and zinc stearate. Because the yields of the alkanes were high (>85 wt%), two potential products, stearyl stearate and octadecanal, were not found in the reaction products. Unlike zeolite-based catalysts, the Ni-based catalysts lacked Brønsted acidic sites; hence, no alkane isomers or cracking products were formed. As expected, CO was the predominant gas product, indicating that the removal of oxygen atoms in the oleic acid molecules mainly occurred through a hydrogenation–decarbonylation reaction route.
| Catalyst | Yields of liquid products (wt%) | |||
|---|---|---|---|---|
| n-C17 | n-C18 | 1-Octadecanol | Zinc stearate | |
| a Reaction conditions: oleic acid (2.0 g), decalin (30.0 g), catalyst (0.2 g), temperature (280 °C), H2 pressure (2.5 MPa), and stirring at 600 rpm for 6 h. | ||||
| C-120 | 83.3 | 2.6 | 0.9 | 13.2 |
| C-140 | 86.6 | 3.5 | 1.1 | 8.8 |
| C-160 | 89.3 | 2.3 | 1.0 | 7.4 |
| C-180 | 90.3 | 4.2 | — | 5.5 |
| C-200 | 92.1 | 3.9 | — | 4.0 |
The yields of heptadecane and octadecane listed in Table 2 were plotted as a function of the surface concentration of metallic Ni, as shown in Fig. 7. As the surface metallic Ni content increased, the yield of heptadecane increased linearly, while that of octadecane almost remained unchanged; this suggests that metallic Ni can efficiently catalyze the hydrodecarbonylation of fatty acids to produce heptadecane with high selectivity. Moreover, the yields of heptadecane and zinc stearate were plotted as a function of the surface concentration of ZnAl2O4 (see Fig. S3†); the plots show that the yield of heptadecane increased and that of zinc stearate decreased with increasing surface concentration of ZnAl2O4. Zinc stearate, which is chemically stable, was generated by reaction of the intermediate stearic acid with ZnO. Once zinc stearate was formed, it was difficult to convert to alkanes through catalytic hydrogenation. Thus, inhibiting the formation of zinc stearate will also increase the yield of alkanes. As discussed above, a high synthesis temperature results in more ZnAl2O4 spinel, which is resistant to fatty acids and can be used to inhibit the formation of zinc stearate. Because the basic strength of the supports increases with increased crystallinity of ZnAl2O4 phase while the acidic strength does not change regularly (see Fig. S4†), it is likely that the basic sites play a role in the decarbonylation reaction. Combining Fig. 7 and S3,† it was concluded that the increased yield of heptadecane is not only due to the increased surface metallic Ni content, but can also be attributed to the basic sites of ZnAl2O4 phase.
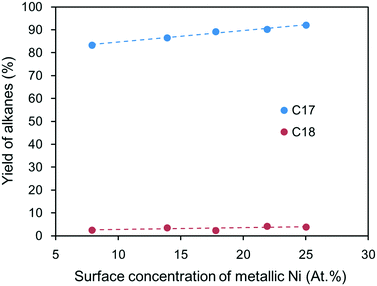 | ||
| Fig. 7 Yields of heptadecane and octadecane as a function of the surface concentration of metallic Ni on the catalysts. | ||
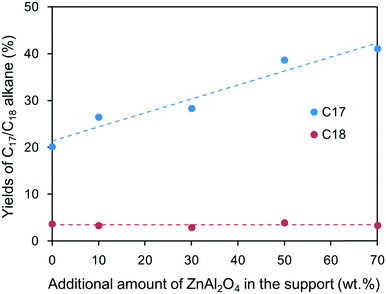
To eliminate the detrimental effects of ZnO phase on oleic acid conversion and further understand the role of ZnAl2O4 phase in heptadecane production, Ni/ZnAl2O4 and Ni/SiO2 catalysts were prepared for activity tests (see the Experimental section in the ESI†). For comparison purposes, the loading amounts of the Ni/ZnAl2O4 and Ni/SiO2 catalysts were 10 wt% as well. The activities of the two catalysts were evaluated under identical reaction conditions with stearic acid as the feedstock. Table 3 shows the effects of ZnAl2O4 spinel on the reaction rate of the formation of alkanes at low conversion (<20%). Addition of ZnAl2O4 markedly increased the formation rates of the alkanes, particularly C17, compared to Ni/SiO2 catalyst. Fig. 8 shows the yields of C17 and C18 in the deoxygenated product as a function of the amount of ZnAl2O4 in the support at high conversion (>80%). In the presence of Ni/SiO2 catalyst alone, stearic acid can be transformed to alkanes, among which heptadecane is the main product; this suggests that individual metallic Ni can catalyze the decarbonylation reaction. When the amount of ZnAl2O4 added to the catalyst increased from 10% to 70%, the yield of heptadecane increased almost linearly, even though there was a small amount of ZnO in the support (see Fig. S5†). The results in Table 3 and Fig. 8 validate the role of the basic sites in decarbonylation, in which ZnAl2O4 phase favored the formation of heptadecane.
| Catalyst | Yields of alkanes (wt%) | Formation rates of alkanesa (×106 mol gcat−1 s−1) | ||
|---|---|---|---|---|
| n-C17 | n-C18 | n-C17 | n-C18 | |
| a To accurately calculate the value, the conversion of stearic acid was controlled at a low level (<20%) to eliminate concentration gradient effects. | ||||
| Ni/SiO2 | 2.0 | 0.17 | 1.6 | 0.14 |
| Ni/(0.9SiO2 + 0.1ZnAl2O4) | 3.2 | 0.25 | 2.5 | 0.20 |
| Ni/(0.7SiO2 + 0.3ZnAl2O4) | 5.7 | 0.43 | 4.5 | 0.34 |
| Ni/(0.5SiO2 + 0.5ZnAl2O4) | 6.7 | 0.37 | 5.3 | 0.29 |
| Ni/(0.3SiO2 + 0.7ZnAl2O4) | 7.1 | 0.32 | 5.5 | 0.25 |
Our previous work found that heptadecane was mainly produced by octadecanal hydrodecarbonylation, and octadecanal was mainly derived from 1-octadecanol dehydrogenation because the hydrogenation rate of octadecanal to 1-octadecanol was much higher than the hydrocarbonylation rate of octadecanal to heptadecane.11a Thus, 1-octadecanol was used as a feedstock to investigate the catalytic activity of ZnAl2O4 phase on 1-octadecanol dehydrogenation (see Fig. S6†). When Ni/SiO2 catalyst was used, only a small amount of 1-octadecanol was converted, and the yield of octadecane was higher than that of heptadecane. These results indicate that metallic Ni alone cannot efficiently catalyze 1-octadecanol dehydrogenation, and most of the 1-octadecanol was transformed to octadecane through a dehydration–hydrogenation route catalyzed by unreduced and reduced Ni species, respectively. In comparison, the yield of heptadecane obtained from 1-octadecanol was much lower than that obtained from stearic acid, as shown in Fig. 8. This is because under hydrogenation conditions, stearic acid was rapidly hydrogenated to octadecanal followed by hydrogenation to 1-octadecanol, whereas during octadecanal hydrogenation, the decarbonylation reaction occurred simultaneously in the presence of metallic Ni, leading to the formation of heptadecane. If octadecanal was subsequently transformed to 1-octadecanol, only a small part of it could be further converted to heptadecane through the dehydrogenation–decarbonylation process over Ni/SiO2 catalyst. When a small amount (10 wt%) of ZnAl2O4 support was added to the catalyst, the conversion of 1-octadecanol dramatically increased to nearly 100% and 96% heptadecane was obtained as the predominant product.
To further investigate the effects of the support on 1-octadecanol deoxygenation, TEM and XPS characterizations of the two catalysts were performed (see Fig. S7 and S8†). Although the metallic Ni concentration of the Ni/ZnAl2O4 catalyst (15.4%) was slightly lower than that of Ni/SiO2 (17.9%), the particle sizes of the Ni species of the former were much smaller (17 nm) than those of the latter (25.9 nm). Thus, Ni/ZnAl2O4 catalyst would have higher catalytic activity than Ni/SiO2 catalyst because smaller particles have higher dispersity and exposure, which favors contact and activation of the reactant. Despite this, it was still thought that the increase of catalytic activity was mainly dependent on the change in the support basicity. Moreover, although the yield of C17 alkane increased with the amount of ZnAl2O4, the yield only increased from 20.1% to 41.1% when 70 wt% of ZnAl2O4 was added; when 10 wt% of ZnAl2O4 was added, the yield only increased to 26.5% (Fig. 8). In contrast, the yield of C17 alkane increased to 95.9% when 10 wt% of ZnAl2O4 was added and 1-octadecanol was used as reactant instead of stearic acid (see Fig. S6†). Thus, simply increasing the metallic Ni activity was not sufficient to have such a marked impact on the heptadecane yield. Relative to the metallic Ni activity, the change in the support resulted in a higher promotion effect for 1-octadecanol than for stearic acid. This suggests that ZnAl2O4 phase can assist metallic Ni in the catalytic dehydrogenation of 1-octadecanol, i.e., there is a synergistic effect between the two active components. In addition, after adding the ZnAl2O4 support to the catalyst, the yield of octadecane decreased from 7.8% to 4.1% although 1-octadecanol had been fully converted to alkane. This change indicates that in the presence of strong basic sites, the dehydrogenation reaction rate of 1-octadecanol is much higher than its dehydration reaction rate; hence, heptadecane was the predominant product.
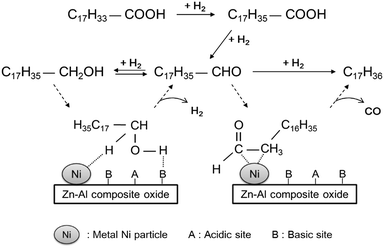
Based on the experimental results, an overall reaction pathway for the hydrodeoxygenation of oleic acid over the Ni-based catalysts to produce alkanes, including the synergistic effects between metallic Ni and basic sites, was proposed (see Fig. 9). Under H2 atmosphere, the dominant route for the conversion of oleic acid on a Ni-based catalyst is hydrogenation–decarbonylation: oleic acid is hydrogenated rapidly to stearic acid, catalyzed by metallic Ni atoms; stearic acid is then reduced to octadecanal, followed by decarbonylation to heptadecane. Because the formation rate of 1-octadecanol is higher than that of heptadecane, a portion of octadecanal is reduced to 1-octadecanol and finally converted to octadecane. This route is mainly catalyzed by acidic sites, and its selectivity depends on the acid type. In the absence of Brønsted acidic sites, this reaction pathway proceeds with difficulty below 300 °C. As a result, unconverted 1-octadecanol will be re-dehydrogenated to octadecanal. As discussed above, 1-octadecanol dehydrogenation was believed to be dependent on the synergistic effect between metallic Ni and the basic sites of ZnAl2O4 phase, which is similar to results reported by Chen et al.21 Using EXAFS spectra, they validated that the dehydrogenation of 2-octanol to 2-octanone was accelerated by the synergistic catalysis between metallic Ni and the Niδ+–Oδ− acid–base sites: metallic Ni catalyzed the cleavage of the α-C–H bonds of 2-octanol by the formation of Ni–Hδ− hydride, and the acid–base sites adsorbed Oδ−–Hδ+ groups to form a Niδ+-alcoholate intermediate and then cleaved the bond.22 Our experiments demonstrated that the dehydrogenation of 1-octadecanol rarely occurs in the absence of basic sites; therefore, like 2-octanol, the H atoms of the OH groups in 1-octadecanol are selectively adsorbed on basic Oδ− sites and became activated, while the H atom bonded to α-C is activated by metallic Ni. Through the cleavage of the C–H and O–H bonds and protolysis, octadecanal was formed. Subsequently, the formed octadecanal was dehydrogenated to a ketene intermediate on metallic Ni, followed by the formation of a η2(C–C) complex;8c,23 this was further decarbonylated to produce heptadecane, accompanied by a hydrogenation process.
Conclusions
In summary, Zn–Al composite oxides supported on Ni-based catalysts with various amounts of ZnAl2O4 phase were prepared by controlling the hydrothermal synthesis temperature of the Zn–Al hydrate precursor. Increased temperature favored the formation of ZnAl2O4 phase and enhanced the basic strength of the support, in which Zn2+ ions migrated from the tetrahedral sites to the octahedral sites to form a local inverse spinel structure. The strengthened basic sites weakened the interactions between the surface Ni species and the support, which improved the reduction of Ni species. Due to the high chemical stability of ZnAl2O4, the formation of zinc stearate was inhibited, and most of the oleic acid was transformed to alkane. During the conversion of oleic acid, decarbonylation of octadecanal and dehydrogenation of 1-octadecanol were the key pathways, in which decarbonylation was catalyzed by metallic Ni and dehydrogenation was attributed to synergistic catalysis between metallic Ni and the strong basic sites. The H atoms of α-C and the OH groups of 1-octadecanol were activated by metallic Ni and the basic sites, respectively. Increasing the amount of ZnAl2O4 and the number of strong basic sites could markedly increase the selectivity to heptadecane.Conflicts of interest
There are no conflicts to declare.Acknowledgements
Financial support from the National Natural Science Foundation of China (No. 21506239; 21761132006) is gratefully acknowledged.Notes and references
- (a) N. Armaroli and V. Balzani, Angew. Chem., Int. Ed., 2006, 46, 52 CrossRef; (b) P. Azadi, O. R. Inderwildi, R. Farnood and D. A. King, Renewable Sustainable Energy Rev., 2013, 21, 506 CrossRef CAS.
- S. A. W. Hollak, R. W. Gosselink, D. S. van Es and J. H. Bitter, ACS Catal., 2013, 3, 2837 CrossRef CAS.
- (a) V. B. Borugadda and V. V. Goud, Renewable Sustainable Energy Rev., 2012, 16, 4763 CrossRef CAS; (b) E. Furimsky, Catal. Today, 2013, 217, 13 CrossRef CAS; (c) A. F. Lee, J. A. Bennett, J. C. Manayil and K. Wilson, Chem. Soc. Rev., 2014, 43, 7887 RSC.
- (a) M. F. Demirbas, Appl. Energy, 2009, 86, s151 CrossRef; (b) P. Šimáček, D. Kubička, G. Šebor and M. Pospíšil, Fuel, 2009, 88, 456 CrossRef; (c) P. Šimáček, D. Kubička, G. Šebor and M. Pospíšil, Fuel, 2010, 89, 611 CrossRef.
- (a) B. Veriansyah, J. Y. Han, S. K. Kim, S. A. Hong, Y. J. Kim, J. S. Lim, Y. W. Shu, S. G. Oh and J. Kim, Fuel, 2012, 94, 578 CrossRef CAS; (b) K. A. Rogers and Y. Zheng, ChemSusChem, 2016, 9, 1750 CrossRef CAS PubMed.
- E. M. Ryymin, M. L. Honkela, T. R. Viljava and A. O. I. Krause, Appl. Catal., A, 2010, 389, 114 CrossRef CAS.
- C. Kordulis, K. Bourikas, M. Gousi, E. Kordouli and A. Lycourghiotis, Appl. Catal., B, 2016, 181, 156 CrossRef CAS.
- (a) B. Peng, Y. Yao, C. Zhao and J. A. Lercher, Angew. Chem., Int. Ed., 2012, 51, 2072 CrossRef CAS PubMed; (b) B. Peng, X. Yuan, C. Zhao and J. A. Lercher, J. Am. Chem. Soc., 2012, 134, 9400 CrossRef CAS PubMed; (c) B. Peng, C. Zhao, S. Kasakov, S. Foraita and J. A. Lercher, Chem. – Eur. J., 2013, 19, 4732 CrossRef CAS PubMed; (d) H. Zuo, Q. Liu, T. Wang, N. Shi, J. Liu, L. Ma and J. Fuel, Chem. Technol., 2012, 40, 1067 CAS; (e) H. Zuo, Q. Liu, T. Wang, L. Ma, Q. Zhang and Q. Zhang, Energy Fuels, 2012, 26, 3747 CrossRef CAS.
- (a) S. W. King, US Pat., 5191123, 1993 Search PubMed; (b) S. W. King, US Pat., 5245032, 1993 Search PubMed.
- (a) J.-G. Na, B. E. Yi, J. N. Kim, K. B. Yi, S.-Y. Park, J.-H. Park, J.-N. Kim and C. H. Ko, Catal. Today, 2010, 156, 44 CrossRef CAS; (b) J.-G. Na, J. K. Han, Y.-K. Oh, J.-H. Park, T. S. Jung, S. S. Han, H. C. Yoon, S. H. Chung, J.-N. Kim and C. H. Ko, Catal. Today, 2012, 185, 313 CrossRef CAS.
- (a) G. Li, F. Zhang, L. Chen, C. Zhang, H. Huang and X. Li, ChemCatChem, 2015, 7, 2646 CrossRef CAS; (b) L. Chen, F. Zhang, G. Li and X. Li, Appl. Catal., A, 2017, 529, 175 CrossRef CAS.
- G. Leofanti, M. Padovan, G. Tozzola and B. Venturelli, Catal. Today, 1998, 41, 207 CrossRef CAS.
- J. I. Di Cosimo, V. K. Díez, M. Xu, E. Iglesia and C. R. Apesteguía, J. Catal., 1998, 178, 499 CrossRef CAS.
- Z. Liu, J. A. Cortés-Concepción, M. Mustian and M. D. Amiridis, Appl. Catal., A, 2006, 302, 232 CrossRef CAS.
- A. Azzouz, D. Nister, D. Miron, A. V. Ursu, T. Sajin, F. Monette, P. Niquette and R. Hausler, Thermochim. Acta, 2006, 449, 27 CrossRef CAS.
- (a) H. A. Prescott, Z. Li, E. Kemnitz, A. Trunschke, J. Deutsch, H. Lieshe and A. Auroux, J. Catal., 2005, 234, 119 CrossRef CAS; (b) J. S. Valente, J. Prince, A. M. Maubert, L. Lartundo-Rojas, P. del Angel, G. Ferrat, J. G. Hernandz and E. Lopez-Salinas, J. Phys. Chem. C, 2009, 113, 5547 CrossRef CAS.
- H. D. Gesser and P. C. Goswami, Chem. Rev., 1989, 89, 765 CrossRef CAS.
- NIST X-ray Photoelectron Spectroscopy Database, Data compiled and evaluated by A. V. Naumkin, A. Kraut-Vass, S. W. Gaarenstroom and C. J. Powell, URL: https://srdata.nist.gov/xps/Default.aspx.
- P. Druska, U. Steinike and V. Šepelák, J. Solid State Chem., 1999, 146, 13 CrossRef CAS.
- X. Duan, D. Yuan and F. Yu, Inorg. Chem., 2011, 50, 5460 CrossRef CAS PubMed.
- H. Chen, S. He, M. Xu, M. Wei, D. G. Evans and X. Duan, ACS Catal., 2017, 7, 2735 CrossRef CAS.
- (a) J. Q. Wang, Q. Wang, X. H. Jiang, Z. N. Liu, W. M. Yang and A. I. Frenkel, J. Phys. Chem. C, 2015, 119, 854 CrossRef CAS; (b) C. Mager-Maury, G. Bonnard, C. Chizallet, P. Sautet and P. Raybaud, ChemCatChem, 2011, 3, 200–207 CrossRef CAS; (c) K. Paredis, L. K. One, S. Mostafa, L. Li, Z. F. Zhang, J. C. Yang, L. Barrio, A. I. Frenkel and B. R. Cuenya, J. Am. Chem. Soc., 2011, 133, 6728 CrossRef CAS PubMed.
- M. Peroni, I. Lee, X. Huang, E. Baráth, O. Y. Gutiérrez and J. A. Lercher, ACS Catal., 2017, 7, 6331 CrossRef CAS.
Footnote |
| † Electronic supplementary information (ESI) available: Catalyst preparation, SEM images, XPS data, XRD profile, etc. See DOI: 10.1039/c8cy02027b |
| This journal is © The Royal Society of Chemistry 2019 |


