 Open Access Article
Creative Commons Attribution 3.0 Unported Licence
From benzene to naphthalene: direct measurement of reactions and intermediates of phenyl radicals and acetylene†
Te-Chun
Chu
 ,
Zachary J.
Buras
 ,
Mica C.
Smith
 ,
Awele B.
Uwagwu
and
William H.
Green
 *
*
Massachusetts Institute of Technology, 77 Massachusetts Avenue, Cambridge, MA 02139, USA. E-mail: whgreen@mit.edu
First published on 16th September 2019
Abstract
Hydrogen-abstraction–C2H2-addition (HACA) is one of the most important pathways leading to the formation of naphthalene, the simplest two-ring polycyclic aromatic hydrocarbon (PAH). The major reaction channels for naphthalene formation have previously been calculated by Mebel et al., but few experiments exist to validate the theoretical predictions. In this work, time-resolved molecular beam mass spectrometry (MBMS) was used to investigate the time-dependent product formation in the reaction of a phenyl radical with C2H2 for the first time, at temperatures of 600 and 700 K and pressures of 10 and 50 Torr. A pressure-dependent model was developed with rate parameters derived from Mebel et al.'s calculations and from newly calculated pathways on the C8H7 PES at the G3(MP2,CC)//B3LYP/6-311G** level of theory. The model prediction is consistent with the MBMS product profiles at a mass-to-charge ratio (m/z) of 102 (corresponding to the H-loss product from C8H7, phenylacetylene), 103 (the initial C8H7 adduct and its isomers plus the 13C isotopologue of phenylacetylene), 128 (naphthalene), and 129 (C10H9 isomers plus the 13C isotopologue of naphthalene). An additional C8H7 isomer, bicyclo[4.2.0]octa-1,3,5-trien-7-yl, not considered by Mebel et al.'s calculations, contributes significantly to the signal at m/z 103 due to its stable energy and low reactivity. At high C2H2 concentrations, bimolecular reactions dominated the observed chemistry, and the m/z 128 and m/z 102 MBMS signal ratio was measured to directly determine the product branching ratio. At 600 K and 10 Torr, branching to the H-loss product (phenylacetylene) on the C8H7 PES accounted for 7.9% of phenyl radical consumption, increasing to 15.9% at 700 K and 10 Torr. At 50 Torr, the branching was measured to be 2.8% at 600 K and 6.2% at 700 K. Adduct stabilization is favored at higher pressure and lower temperature, which hinders the formation of the H-loss product. The pressure-dependent model predicted the observed branching ratios within the experimental uncertainty, indicating that the rate parameters reported here can be used in combustion mechanisms to provide insights into phenyl HACA reactions and PAH formation.
1. Introduction
Polycyclic aromatic hydrocarbons (PAHs) have attracted wide attention in combustion as precursors of soot,1–5 and their build-up process from small molecules has a significant impact on process efficiency and the desired product selectivity.6–8 A number of kinetic models have been proposed to understand the formation of naphthalene, one of the simplest two-ring PAHs, most notably the hydrogen-abstraction–C2H2-addition (HACA) mechanism starting from benzene and a phenyl radical (C6H5) due to its accessible entrance barrier and significant exothermicity.1,3,9 The potential energy surface (PES) of C6H5 + acetylene (C2H2) was reported by Richter et al. at the B3LYP/cc-PVDZ level of theory with pressure-dependent rate constant calculations.10 Tokmakov et al. further investigated the C6H5 + C2H2 reaction using the G2M method and applied Rice–Ramsperger–Kassel–Marcus (RRKM) theory to predict the kinetics and product branching ratios.11 To investigate the chemistry beyond the C8H7 PES, Kislov et al. used the G3(MP2,CC) level of theory to explore the reactions involving a second acetylene addition, which include C8H5, C10H7, and C10H9 PESs, as well as other important reactions in HACA chemistry.12 With the kinetics evaluated from those calculations, the Diels–Alder mechanism was found to be much slower than the HACA mechanism at high combustion temperatures. More recent calculations reported by Mebel et al. improved Kislov et al.'s calculations12 by performing RRHO-based variational transition state theory (VTST) calculations for low-barrier reactions and variable reaction coordinate-transition state theory (VRC-TST)13 for barrierless H-elimination reactions on the C10H7 PES.14 Branching ratios in a wide range of temperatures and pressures were evaluated, and naphthalene was predicted to be the dominant product at temperatures of up to 2500 K.Several experimental kinetics studies of C6H5 HACA reactions have also been performed. Fahr and Stein conducted pyrolysis experiments in a flow reactor to measure the kinetics of phenylacetylene + H formation at 1000–1330 K.15 Yu et al. used cavity ringdown spectroscopy to measure the total C6H5 + acetylene rate constant at 297–523 K, and by assuming a constant C6H5 recombination rate, they correlated their rates measured at relatively low temperatures with those measured in Fahr et al.'s experiments.15–17 Using a reflectron time of flight mass spectrometer, Parker et al. directly observed the formation of phenylacetylene and naphthalene in the phenyl + acetylene reaction.18 Subsequent work by Yang et al. found further evidence of the styrenyl and ortho-vinylphenyl radicals, which supported previous theoretical work.19 However, the time-dependent products and the product branching ratio have not been directly measured previously.
In this work, we directly measured the time dependent formation of products in the C6H5 + C2H2 HACA reaction using molecular beam mass spectrometry (MBMS) under a range of T and P conditions (600–700 K and 10–50 Torr). A pressure-dependent model was developed using Mebel et al.'s ab initio calculations14 and additional pathways on the C6H5 + C2H2 PES calculated here, and compared with our experimental data to assess the validity of the proposed reaction channels for accurately predicting the formation of naphthalene via the HACA mechanism.
2. Experimental
The experimental apparatus used in this work has been described previously.20–22 Time-resolved molecular beam mass spectrometry (MBMS) was used to measure product signals at pressures of 10 and 50 Torr and temperatures of 600 and 700 K. Experiments were performed in a custom quartz flow reactor (1.6 cm inner diameter in the reaction region) in a high vacuum chamber equipped with a reflectron time-of-flight mass spectrometer (Kore TOF-MS). Gases were well-mixed before flowing into the reactor and were pumped using a Roots blower (Leybold). The pressure in the reactor was held constant at 10 or 50 Torr by throttling a butterfly valve leading to the pump at the reactor outlet. The reactor was wrapped with nichrome ribbon wire for heating up the gas to the desired temperatures, and two thermocouples were located inside the reactor to control the temperature. Prior to the experiments, axial temperature profiles with 2.5 cm resolution along the length of the reactor were measured to obtain the real temperatures of the gas mixture used for kinetic modeling.A collimated pulsed 266 nm laser beam (fourth harmonic frequency of an Nd:YAG laser) with 1 Hz repetition rate was focused coaxially into the reactor to photolyze the radical precursor. The total gas flow rate was adjusted to maintain one flash per refresh condition. Additional experiments with higher C2H2 concentration were performed under each set of temperature and pressure conditions. The gas mixture was sampled through a pinhole in the reactor center and formed a molecular beam intersecting with a focused 118 nm (10.5 eV) photoionization laser beam (ninth harmonic frequency of an Nd:YAG laser), which formed cations measured by MBMS. Time-of-flight mass spectra were measured at reaction times of up to 8 ms after the photolysis pulse in order to observe products from both the first and the second C2H2 addition. Peaks on the mass spectra at different mass-to-charge ratios (m/z) were integrated and compared with model predictions. Before the laser beam entered the reactor, an adjustable iris was placed in its path to control the size of the laser beam. The laser diameter was clipped from 1.8 cm to 1.5 cm, slightly smaller than the reactor inner diameter, which gives two main advantages: (1) clipping the edges of the beam can decrease inhomogeneities in the radical concentration produced by the laser beam. (2) No direct contact was made between the reactor inner wall and the laser beam, reducing undesired wall reactions which apparently promote the fast hydrogenation of the phenyl radical to benzene, observed in MBMS experiments when the laser beam size was not optimized.21 Nitrosobenzene (C6H5NO; Sigma-Aldrich, 98%) was used as the photolytic precursor of the phenyl radical (C6H5).16,17 To remove oxygen and impurities, several freeze–pump–thaw cycles were performed on C6H5NO.21 Helium (He) was the carrier gas and bath gas for all the experiments with UHP grade purity (≥99.999%) obtained from Airgas; acetylene (C2H2) with ≥99.5% purity was used (CP grade) and was also purchased from Airgas; and acetone in the acetylene was removed using a cartridge activated charcoal gas purifier (SGD80003) obtained from Airgas.
3. Theoretical
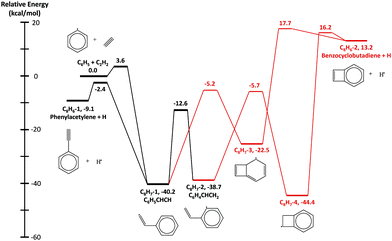
The HACA routes of C6H5 were previously explored by Mebel et al. at the G3(MP2,CC)//B3LYP/6-311G** level of theory12 including C8H7, C10H7, and C10H9 potential energy surfaces (PESs) and other reactions such as H-abstraction, radical recombination, or radical disproportionation.12,14 In this work, two additional C8H7 isomers (bicyclo[4.2.0]octa-2,4,7-trien-1-yl, C8H7-3, in Fig. 1 and bicyclo[4.2.0]octa-1,3,5-trien-7-yl, C8H7-4, in Fig. 1) and one C8H6 (benzocyclobutadiene, C8H6-2 in Fig. 1) + H product along with four transition states are included in the updated C8H7 PES, shown in Fig. 1. These species were reported by Richter et al.10 and Tokmakov and Lin11 in previous theoretical literature; the geometries were optimized and frequencies were calculated at the B3LYP/6-311G** level of theory using Richter et al.'s10 geometry as the initial guess. The only exception is the transition state between C8H7-4 and C8H6-2 + H, which was optimized at the M062X/cc-pVTZ level of theory, because the B3LYP/6-311G** method could not find a correct converged geometry. Its frequencies were later calculated at the B3LYP/6-311G** level to keep it consistent with other species on the C8H7 PES. The energies of the stationary points and transition states were calculated using the same method as Mebel et al.,14 G3(MP2,CC)//B3LYP/6-311G**. All the calculations were performed in Gaussian 16,23 except for the rCCSD(T) energy used in the G3(MP2,CC) method which was obtained from Molpro 2015.24–34 Molecular parameters for the newly calculated stationary points are reported in the ESI.† For the rest of the species on the C8H7, C10H7 and C10H9 PESs, ab initio data were directly taken from the work of Mebel et al.14Arkane,35 a package included in the open-source software Reaction Mechanism Generator (RMG),36 was used to calculate phenomenological pressure-dependent rate coefficients k(T,P). The collisional energy-transfer parameter, 〈ΔEdown〉 = α(T) = 424 × (T/300 K)0.62 cm−1, was taken from the work of Mebel et al.37 for argon bath gas, and scaled down for helium bath gas using Jasper et al.'s method.38 While the theoretical rate coefficients reported by Mebel et al.14 were calculated using the direct diagonalization method to solve the master equation,39,40 the present work used the modified strong collision approximation to calculate k(T,P) from pressure-dependent networks incorporating the additional pathways discussed above. cis/trans isomers with interconversion barriers <4 kcal mol−1 are treated as lumped single species in our rate calculations. Lennard-Jones parameters for the different PESs were estimated from the reported transport properties of PAHs by Wang et al.41 Thermochemical properties for important species were obtained from the Narayanaswamy library in the RMG database, which focuses on aromatics formation and considers accurate experimental data along with G3MP2//B3 calculations.8 For other species not in the Narayanaswamy library, RMG was used to estimate their thermochemical properties with the group additivity method, which has recently been improved and extended by similarity matching and bicyclic decomposition for predicting fused cyclics.42 The above-mentioned k(T,P) and thermochemical properties were used to construct a pressure-dependent kinetic mechanism for C6H5 + C2H2. In addition to the main HACA routes, the mechanism includes side reactions that are important under our experimental conditions, such as addition of H atoms formed in HACA reactions to C2H2 forming vinyl radicals. The mechanism is attached in the ESI† in Chemkin format with the rate parameters and the species thermochemistry.
The detailed chemical mechanism for various C6H5 HACA pathways was used to simulate the time-dependent species concentrations under the conditions of the MBMS experiments to compare the theoretical calculations with the measured product signals. A similar approach was used by Buras et al.21 for experiments performed in the same apparatus. To account for the transport effects in molecular beam sampling and the reactor, a constant 0.2 ms time delay with a simple model with a first-order rate constant (ksampling) was utilized, which was adapted from Baeza-Romero et al.43 A previous work21 used the rise time of the I atom signal to estimate the sampling rate, which is not available in the present work, since we did not use the iodide. Here nitric oxide (NO), cogenerated with C6H5 through photolysis, was chosen to fit ksampling, because it is barely affected by the C6H5 + C2H2 reactions. An example of the NO time series measured by MBMS experiments is given in the ESI† to compare with the model prediction with ksampling. The fitted ksampling only affects the time dependence of the absolute predicted signals, but has no effect on the relative abundance of species at any given time point. For most experiments, the fitted value of ksampling was 1600–2000 s−1, whereas a smaller value (1200 s−1) was found for one experiment, possibly due to a shifted laser alignment. To further convert the species concentration into signals compared to the observed signals in the experiments, the predicted species concentration (Ci) after sampling was weighted by the photoionization cross section (PICS) for each species at 10.5 eV (118.2 nm): σNO = 3.1 Mb,44σphenylacetylene = 63.0 Mb45 (10% uncertainty), σC8H7 radical = 8 Mb (a factor of two uncertainty), σnaphthalene = 51.4 Mb18,46,47 (50% uncertainty), and σC10H9 radical = 8 Mb (a factor of two uncertainty). Lower PICS values were estimated for the radical species relative to the close-shell species, because of the correspondingly lower occupancy of the HOMO from which the electron is ejected.48 However, aromatic resonance stabilized radicals (RSRs) commonly have PICS similar to the corresponding closed-shell structure, i.e. the benzyl radical (25.5 Mb49) compared to toluene (32.0 Mb45). Since both C8H7-3 and C8H7-4 in the C8H7 PES are RSRs, their PICSs are estimated to be 40 Mb (a factor of two uncertainty), similar to their closed-shell analogues, benzocyclobutane, with >50 Mb PICS at 10.5 eV ionization energy estimated by Li et al.46 Due to the difference of PICS between some isomers, the MBMS measured signals cannot be converted to the lumped concentration of isomers; thus, the signals are compared instead of the species concentration in this work. The impact of 13C isotopes was assumed to contribute 1.1% per carbon atom for each of the products, and the same PICS was assumed for each set of isotopomers. Finally, a scaling constant Ci obtained from the internal calibration mixture for each experimental condition was multiplied with the PICS to obtain the time-dependent predicted product signals. Steps of the described modeling approach are depicted in the ESI.† For the rate of production (ROP) analysis, Chemical Workbench50 was used to evaluate the reactant consumption under MBMS experimental conditions.
4. Results & discussion
4.1 Hydrogen-abstraction–C2H2-addition (HACA) routes of the phenyl radical
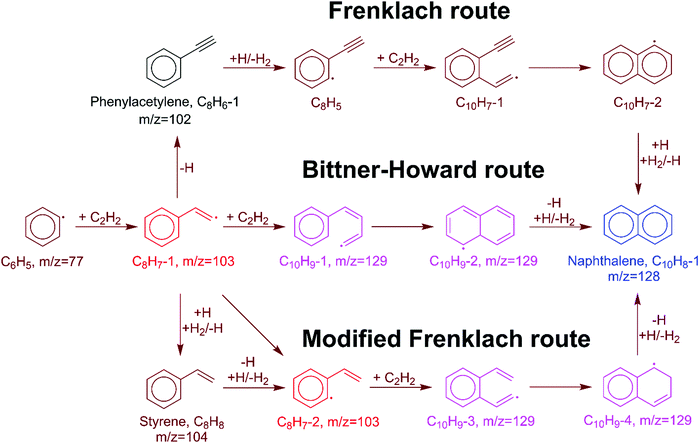
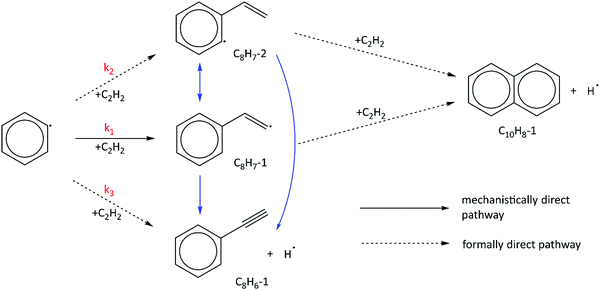
In the HACA mechanism for the reaction of the phenyl radical with C2H2, three pathways have been identified leading to naphthalene formation: the Frenklach,3,9,51 Bittner–Howard,52 and modified Frenklach53,54 routes. Reactions involved in each route are depicted in Fig. 2. In our previous study on methane-rich combustion at high temperature (>1400 K), the Frenklach route was the most important pathway of naphthalene formation,6 which involves external H abstraction from phenylacetylene (C8H6) forming a C8H5 radical before the second C2H2 addition. However, this route is not expected to be significant under the experimental conditions (600–700 K, 10–50 Torr) of this work where H atoms are generated from H-loss reactions. Due to high C2H2 concentration in our MBMS experiments, H atoms are mostly consumed by C2H2 instead of reacting with phenylacetylene; therefore, no clear time-dependence of the m/z = 127 signal corresponding to C10H7 isomers was observed, which supports this hypothesis.In the Bittner–Howard route, the initial adduct of C6H5 + C2H2, C8H7-1, directly reacts with the second C2H2 to form the C10H9-1 radical, followed by isomerization and β-scission to the final product, naphthalene. In the modified Frenklach route, C8H7-2 can be generated via the direct well-skipping reaction of C6H5 + C2H2, isomerization of C8H7-1, or an H-assisted pathway involving the formation of styrene. The existence of styrene in this route suggests that we may expect observation of a signal at m/z = 104 in the MBMS experiments. Naphthalene is formed in a similar manner to the Bittner–Howard route by the reaction of C8H7-2 with C2H2, isomerization, and β-scission. Both the Bittner–Howard route and the modified Frenklach route involve reactions on the C10H9 PES. Under low pressure or high temperature conditions, well-skipping reactions become important even for fairly large molecules;55 therefore, the C8H7-1 + C2H2 and C8H7-2 + C2H2 reactions can produce naphthalene + H without stabilization of C10H9 isomers. All of these reactions have been included in the pressure-dependent model developed in this work.
4.2 Products measured by MBMS experiments
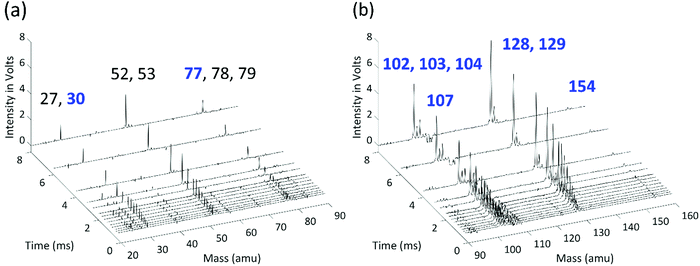
Time-resolved mass-spectra after background subtraction measured at 700 K and 10 Torr are shown in Fig. 3. A negative signal appears at m/z 107 (C6H5NO) after t = 0 due to the photolysis of the chemical precursor, and m/z = 30 (NO) and m/z = 77 (C6H5) peaks appear as the photolysis products are co-generated. The signal at m/z = 30 slowly increases to its maximum value due to the molecular beam sampling effect, and it remains nearly constant at longer reaction times, indicating that NO is not reactive. The signal of the phenyl radical, on the other hand, decreases rapidly due to its fast reaction with C2H2. The products of the reaction between C6H5 and the first C2H2 appear at m/z = 102 (H-loss product, phenylacetylene), 103 (the initial adduct C8H7-1 and its isomers plus the 13C isotopologue of phenylacetylene), and 104 (styrene, the side product in the modified Frenklach route). As the C8H7 isomers further react with a second C2H2, signals at m/z = 128 (naphthalene) and 129 (C10H9 isomers plus the 13C isotopologue of naphthalene) are observed in the mass spectra. The signal at m/z = 154 corresponds to biphenyl produced from phenyl radical recombination, which is less significant at higher temperature.When H atoms are eliminated in β-scission reactions, they rapidly react with the high concentration C2H2 in the reactor to generate C2H3 (vinyl radical, m/z = 27). Similar to the HACA reactions of the phenyl radical to form naphthalene, a vinyl radical can react with two C2H2 molecules to form benzene. The observed signals at m/z = 52 (vinylacetylene), m/z = 53 (C4H7 isomers plus the 13C isotopologue of m/z = 52), m/z = 78 (benzene), and m/z = 79 (C6H7 isomers plus the 13C isotopologue of m/z = 78) are attributed to the products of vinyl HACA reactions. The time-resolved signal intensities and the main reaction pathways for vinyl + C2H2 are available in the ESI.† This reaction network is under thorough study in our group, and will be discussed in detail in a separate publication. H atom consumption to form a vinyl radical is significant and is included in the model, but under our conditions further reactions of vinyl have negligible effects on the main peaks of interest here (m/z = 77, 102, 103, 104, 128, 129). Other peaks observed in the MBMS experiments are attributed to the calibration mixture and hydrocarbon impurities in C2H2 or C6H5NO, and show no discernible time dependence.
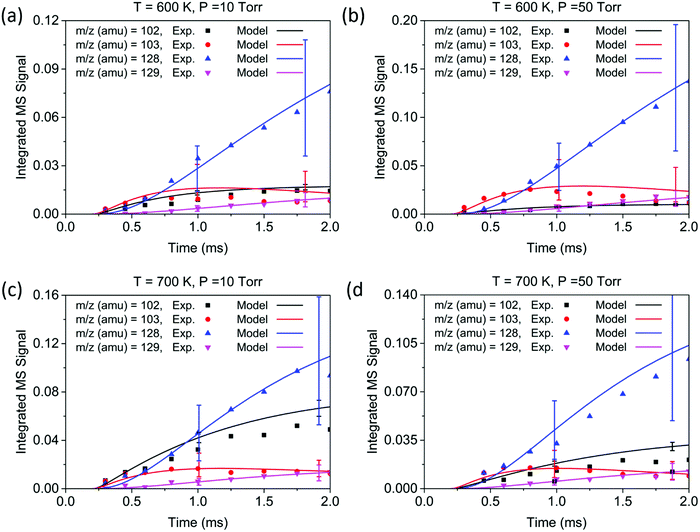
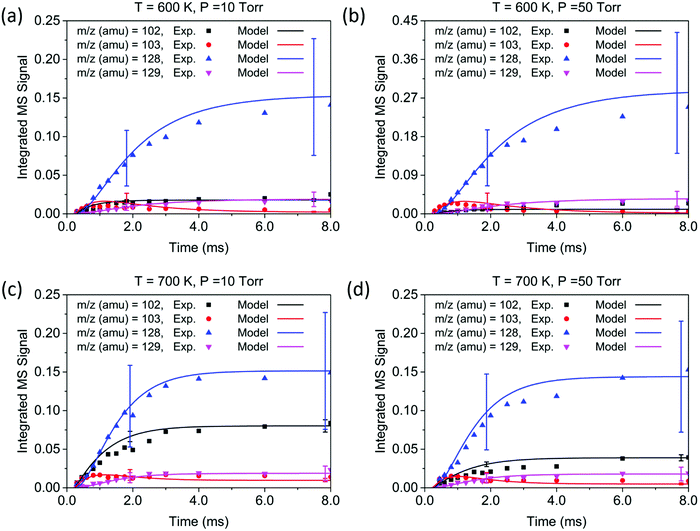
The conditions for each experiment are summarized in Table 1. In experiments 1–4, the concentration of C2H2 was controlled to achieve a rise time of ∼1.0 ms for the signal at m/z = 103. Under these conditions, the signals corresponding to the main products—at m/z = 102, 103, 128, and 129—appear within 2.0 ms, and reach a steady state at ∼8.0 ms. The reaction temperature T was determined by averaging over temperature measurements at different points in the reactor, in this case averaged over the 5 cm length on the upstream side of the center pinhole, which corresponds to the MBMS sampling region during the time after the flash. The initial concentration of C6H5 after photolysis is the same as that of NO; therefore, the NO signal (m/z = 30) together with its known ionization cross section (3.1 Mb44) was used to determine the initial radical concentration. Time profiles of experimental measurements and the modeling results are shown in Fig. 4 for a short time scale (2.0 ms) and Fig. 5 for a long time scale (8.0 ms). The results for experiments 5–8 are given in the ESI,† and show that the product signals rise and reach a steady state earlier due to the faster reaction at higher C2H2 concentration.
| Exp. # | Nominal T (K) | Real T (K) | P (Torr) | [Precursor]a (1013 cm−3) | [C6H5]0b,c (1012 cm−3) | [C2H2]a (1016 cm−3) | k sampling (s−1) |
|---|---|---|---|---|---|---|---|
a 20% uncertainty due to mass flow controller calibrations.
b Calculated from a stable NO signal at m/z = 30 after photolysis, σ118![[thin space (1/6-em)]](https://www.rsc.org/images/entities/char_2009.gif) nm,NO = 3.1 Mb.44
c Photolysis energy is 15 mJ per pulse. nm,NO = 3.1 Mb.44
c Photolysis energy is 15 mJ per pulse.
|
|||||||
| 1 | 600 | 607.4 ± 0.6 | 10 | 2.2 | 1.16 ± 0.23 | 3.82 | 2000 |
| 2 | 600 | 595.0 ± 0.7 | 50 | 2.1 | 0.93 ± 0.19 | 3.77 | 2000 |
| 3 | 700 | 705.0 ± 0.7 | 10 | 2.2 | 0.92 ± 0.18 | 2.74 | 1600 |
| 4 | 700 | 693.1 ± 1.0 | 50 | 2.1 | 0.83 ± 0.17 | 2.69 | 2000 |
| 5 | 600 | 607.4 ± 0.6 | 10 | 2.2 | 1.05 ± 0.21 | 5.46 | 1800 |
| 6 | 600 | 595.0 ± 0.7 | 50 | 2.1 | 0.99 ± 0.20 | 5.38 | 2000 |
| 7 | 700 | 705.0 ± 0.7 | 10 | 2.2 | 0.80 ± 0.16 | 3.83 | 1200 |
| 8 | 700 | 693.1 ± 1.0 | 50 | 2.1 | 0.91 ± 0.18 | 3.77 | 1600 |
Overall, the measurement and the model show quantitative agreement within the error bars for the experiments in Fig. 4 and 5. The model shows that phenylacetylene comprises almost 100% of the m/z = 102 signal under all experimental conditions, as does naphthalene to the m/z = 128 signal. At early time scales of up to 1.0 ms, the signal at m/z = 103 increases rapidly due to the generation of initial adduct C8H7-1 by the C6H5 + C2H2 (+M) → C8H7-1 (+M) reaction. The rise time for this species is faster than those for all other major products under our experimental conditions, except for the experiment at 700 K and 10 Torr. Under these relatively high temperature and low pressure conditions, the “formally direct” pathway C6H5 + C2H2 (+M) → phenylacetylene + H (+M) leads to a faster rate of phenylacetylene generation and thus a larger m/z = 102 signal was observed in both the experiment and the model. We define “formally direct” pathways as reactions traversing more than one transition state; conversely, “mechanistically direct” pathways refer to reactions that have one transition state connecting reactants and products.56–59 At the beginning of the C6H5 + C2H2 reaction, a rate-of-production (ROP) analysis indicates that 8.0% of C6H5 consumption directly forms C8H6 at 600 K and 10 Torr, compared to 16.3% at 700 K and 10 Torr. Furthermore, more m/z = 102 signal was observed at higher temperature. At 700 K, in addition to the “formally direct” pathway leading to C8H6 formation, thermalized C8H7-1 and C8H7-2 have more energy to overcome the barriers to H elimination, e.g. C8H7-1 (+M) → phenylacetylene + H (+M). As more C8H7 isomers react to form the H-elimination product instead of reacting with a second C2H2 at higher temperatures, the relative yield of the phenylacetylene product at m/z = 102 is expected to increase over naphthalene at m/z = 128. The ROP analysis shows that, at 1.0 ms, the reaction channel C8H7-1 (+M) → C8H6 + H (+M) accounts for only 0.41% of C8H7-1 consumption at 600 K and 10 Torr, and it increases to 16.3% at 700 K and 10 Torr. The product distribution also exhibits a dependence on pressure in both the measurement and the model: at higher pressure, the formation of C8H7 adducts is favored over the bimolecular products C8H6 + H; therefore, the signal at m/z = 102 becomes less significant when the pressure is increased from 10 to 50 Torr.
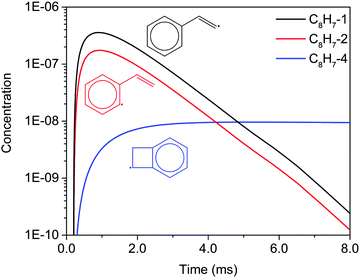
Unlike the m/z = 102 and m/z = 128 signals which are attributed to single species under our experimental conditions, the origin of the m/z = 103 and m/z = 129 signals is more complicated due to the combination of signals from multiple isomers as well as the contribution from 13C-substituted species. After reaching its maximum, the m/z = 103 signal is expected to decay to near zero because C8H7-1 and C8H7-2 are both highly reactive with C2H2. However, at 700 K after 3.0 ms in Fig. 5(c) and (d), the m/z = 103 signal remains constant and above zero. According to the model, part of this signal comes from 13C-substituted phenylacetylene, which contributes 8 × 1.1% of the m/z = 102 signal to the signal at m/z = 103. An interesting discovery is that the resonantly stabilized radical C8H7-4 has the highest concentration among all C8H7 isomers at later times, and accounts for 25% of the m/z = 103 signal at 700 K and 50 Torr at 8.0 ms in the model. Fig. 6 shows the modeled concentration of C8H7 isomers at 700 K and 50 Torr. The initial adduct C8H7-1 and its rapidly equilibrated isomer C8H7-2 both increase in concentration at early reaction times, but decrease significantly after 2.0 ms. The concentration of C8H7-4 is negligible at early time scales, but exceeds the concentration of other isomers after 6.0 ms. As seen in Fig. 1, C8H7-4 has the lowest energy of all species on the PES, and is surrounded by high barriers ∼40 kcal mol−1. After thermalized C8H7-2 isomerizes into C8H7-4, the high energy barrier inhibits further reactions and thus leads to a long lifetime for the C8H7-4 radical. The signal at m/z = 129 is attributed mainly to 13C-substituted naphthalene, and none of the C10H9 isomers included in the model are predicted to produce observable signals at any time scale under our experimental conditions. The model prediction implies that naphthalene is mainly formed by “formally direct” pathways: C8H7-1 + C2H2 (+M) → naphthalene + H (+M) and C8H7-2 + C2H2 (+M) → naphthalene + H (+M). According to the ROP analysis, C8H7-1 + C2H2 (+M) → naphthalene + H (+M) accounts for 72.1% and C8H7-2 + C2H2 (+M) → naphthalene + H (+M) accounts for 27.5% of naphthalene formation for the experiment at 700 K and 10 Torr at 1.0 ms.
4.3 Important reaction pathways and direct determination of branching ratios
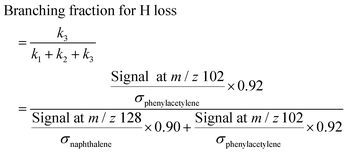
We have shown that the kinetic model developed in this work, containing reactions on the C8H7, C10H7, and C10H9 PESs calculated by Mebel et al. in addition to other important HACA reactions, is well validated by the MBMS experiments. Using the validated model, the most important reaction pathways can be identified under our experimental conditions (600–700 K, 10–50 Torr). As shown in Fig. 7, C6H5 reacts with C2H2 to form the initial adduct C8H7-1 via a mechanistically direct pathway, and generates C8H7-2 and the bimolecular products C8H6-1 + H via formally direct pathways on the C8H7 PES. Isomerization between C8H7-1 and C8H7-2 appears to be significant in the model, as is the β-scission of both isomers into C8H6-1 + H. As discussed before, naphthalene (C10H8-1) is formed mainly through formally direct pathways for the reactions of C8H7-1 and C8H7-2 with a second C2H2 molecule, without thermalizing the C10H9 isomers. The validated model shows that naphthalene dominates by at least three orders of magnitude over other C10H8 isomers; therefore, the present m/z = 129 signal observed in the MBMS experiments is fully attributed to the 13C isotopologue of naphthalene. (Our model includes other C10H9 species (m/z = 129), but they have short lifetime, not persistent.)At high C2H2 concentration, all the bimolecular reactions with C2H2 dominate over unimolecular reactions. The isomerization reactions between C8H7-1 and C8H7-2 and their β-scission into C8H6-1 + H become negligible, such that only the bimolecular reactions including C6H5 + C2H2 (+M) → C8H7-1 (+M), C6H5 + C2H2 (+M) → C8H7-2 (+M), C6H5 + C2H2 (+M) → C8H6-1 + H (+M), C8H7-1 + C2H2 (+M) → C10H8-1 + H (+M), and C8H7-2 + C2H2 (+M) → C10H8-1 + H (+M) are significant. Since C10H8-1 + H are the sole final products for the bimolecular reactions of C8H7-1 and C8H7-2 with C2H2 and C10H8-1 fully dominates the m/z = 128 signal, as is the case for C8H6-1 in the m/z = 102 signal, we can use the signal ratio of m/z = 128 and m/z = 102 to determine the product branching ratios of C6H5 + C2H2 to C10H8-1 and C8H6-1:
 | (1) |
 | (2) |
 | (3) |
Experiments to evaluate product branching ratios were conducted under similar conditions to those of the MBMS experiments discussed in the previous section, but using much higher C2H2 concentrations. To avoid the molecular sampling effect on MBMS signals at early time scales, all the signal ratios were obtained at least 1.0 ms after photolysis. At least six different delay times were measured for each set of experimental conditions, and the ratio of m/z = 128 to m/z = 102 was observed to remain stable within the measured time range, as seen in Fig. 8. As this ratio increases, the yield of H-loss products decreases in favor of radical adduct stabilization (followed by reaction with C2H2 to form naphthalene). Uncertainty propagation was performed to estimate the uncertainty of H-loss branching measured in the experiments. The main source of uncertainty is the uncertainty in PICS of phenylacetylene and naphthalene; further details for the uncertainty analysis are included in the ESI.†Table 2 summarizes the experimental conditions and the H-loss branching measured by the MBMS experiments and predicted by the model developed in this work.
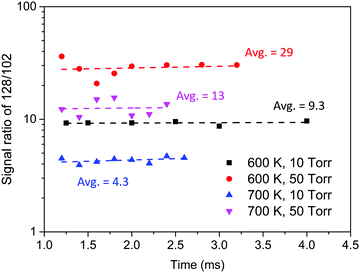 | ||
| Fig. 8 Signal ratio of m/z = 128 to m/z = 102 measured in the MBMS experiments with high C2H2 concentration. | ||
| Nominal T (K) | Real T (K) | P (Torr) | k′a (104 s−1) | Time range (ms) | Number of time points | Predicted H-loss branching (%) | Measured H-loss branching (%) |
|---|---|---|---|---|---|---|---|
| a k′ = k × [C2H2], where k is the total rate constant of C6H5 + C2H2 calculated by Mebel et al.14 | |||||||
| 600 | 607.4 ± 0.6 | 10 | 1.3 | 1.2–4.0 | 6 | 8.0 | 7.9 ± 4.9 |
| 600 | 595.0 ± 0.7 | 50 | 2.4 | 1.2–3.2 | 8 | 2.6 | 2.8 ± 1.6 |
| 700 | 705.0 ± 0.7 | 10 | 2.2 | 1.2–2.6 | 8 | 16.4 | 15.9 ± 8.0 |
| 700 | 693.1 ± 1.0 | 50 | 6.4 | 1.2–2.4 | 7 | 6.3 | 6.2 ± 3.4 |
The product branching predicted by the model falls within the uncertainty of the measurements under all the conditions studied in this work. At 600 K and 10 Torr, 7.9% of C6H5 reacts directly with C2H2 to form C8H6-1 + H, but this branching fraction decreases to 2.8% when the pressure is increased to 50 Torr. The reaction of C6H5 + C2H2 can also form chemically activated C8H7-1, the fate of which depends on the competition between collisional stabilization (k1), isomerization followed by stabilization (k2), and β-scission (k3) under various temperature and pressure conditions. When the pressure increases, the greater efficiency of collisional stabilization of C8H7-1 by the bath gas reduces the probability of the formally direct H-loss pathway to form C8H6-1 + H, since C8H7-1 is more likely to become stabilized before other reactions can occur. Therefore, higher pressure leads to a lower branching fraction for the H-loss pathway, as was observed in the experiments at 700 K when the pressure was increased from 10 to 50 Torr (experiments 3 and 4). When the temperature is increased with pressure held constant, the H-loss branching fraction increases by a factor of two from 7.9% (600 K) to 15.9% (700 K) at 10 Torr, and from 2.8% (600 K) to 6.2% (700 K) at 50 Torr. Higher temperatures lead to a greater probability that chemically activated C8H7-1 formed from the reaction of C6H5 with C2H2 has sufficient internal energy to overcome the barrier to undergo β-scission. Given the excellent agreement between the model and experiment for the time-dependent signals of main products and the direct H-loss branching fractions, we conclude that our model has been thoroughly validated under the range of T and P conditions considered in this work. For future development of PAH formation mechanisms, the updated model derived from Mebel et al.14 presented here is therefore recommended to describe the HACA reactions of the phenyl radical with C2H2 as well as the formation of naphthalene.
Conclusions
C6H5 + C2H2 HACA reaction pathways were studied experimentally with MBMS under a range of T and P conditions (600–700 K, 10–50 Torr) and with a pressure-dependent kinetic model built using Mebel's ab initio calculations on the C8H7, C10H7, and C10H9 PESs in addition to newly calculated pathways on the C8H7 PES at the G3(MP2,CC)//B3LYP/6-311G** level of theory and other important side reactions. Time-dependent signals at various mass-to-charge ratios (m/z) were measured, and the corresponding species concentrations predicted by the model were converted into expected signals for direct comparison with the MBMS experiments.Under the conditions in this work, major product peaks at m/z = 102 (H-loss product on the C8H7 PES, phenylacetylene), 103 (the initial adduct C8H7-1 and its isomers plus the 13C isotopologue of phenylacetylene), 128 (naphthalene), and 129 (C10H9 isomers plus the 13C isotopologue of naphthalene) were observed. The modeled signals show excellent agreement with the measurements. As the temperature increases from 600 to 700 K, the m/z = 102 signal increases significantly relative to the m/z = 128 signal, which indicates that product branching toward the H-loss pathway increases at higher temperature. When the pressure is increased from 10 to 50 Torr, more efficient collisional stabilization led to a higher rate of C8H7 adduct formation and a reduced yield of phenylacetylene. At long time scales (up to 8 ms after photolysis) at 700 K, C8H7 radicals were expected to be completely consumed by bimolecular reactions due to the excess C2H2 concentrations in the reactor. However, the signal at m/z = 103 corresponding to C8H7 remained constant and nonzero after 4.0 ms. The model revealed that part of this signal came from 13C-substituted phenylacetylene, but more importantly, part of the signal was also attributed to a resonantly stabilized aromatic radical C8H7-4 which was newly calculated in this work.
At high C2H2 concentrations, C2H2 addition reactions become dominant. By measuring the signal ratio of m/z = 128 to m/z = 102, the relative product branching of the formally direct H-loss reaction pathway forming phenylacetylene on the C8H7 PES was directly determined. The measured phenylacetylene branching fractions are 7.9% at 600 K and 10 Torr, 2.8% at 600 K and 50 Torr, 15.9% at 700 K and 10 Torr, and 6.2% at 700 K and 50 Torr; the corresponding branching fractions predicted by the model agreed with the measurements within the experimental uncertainty under all the T and P conditions studied. The time-dependent products and product branching measured with MBMS successfully validate the kinetic model constructed in this work, and the rate parameters are recommended for future modeling of the phenyl + C2H2 HACA reaction in mechanisms of PAH formation.
Conflicts of interest
There are no conflicts to declare.Acknowledgements
We gratefully acknowledge SABIC for financial support for this research, and Prof. Alexander Mebel for valuable discussions.References
- H. Richter and J. B. Howard, Prog. Energy Combust. Sci., 2000, 26, 565–608 CrossRef CAS.
- M. R. Kholghy, A. Veshkini and M. J. Thomson, Carbon, 2016, 100, 508–536 CrossRef CAS.
- M. Frenklach and H. Wang, Symp. (Int.) Combust., 1991, 23, 1559–1566 CrossRef.
- M. Frenklach, Combust. Flame, 2019, 201, 148–159 CrossRef CAS.
- A. M. Valencia-López, F. Bustamante, A. Loukou, B. Stelzner, D. Trimis, M. Frenklach and N. A. Slavinskaya, Combust. Flame, 2019, 207, 265–280 CrossRef.
- T.-C. Chu, Z. J. Buras, P. Oßwald, M. Liu, M. J. Goldman and W. H. Green, Phys. Chem. Chem. Phys., 2019, 21, 813–832 RSC.
- V. Chernov, M. J. Thomson, S. B. Dworkin, N. A. Slavinskaya and U. Riedel, Combust. Flame, 2014, 161, 592–601 CrossRef CAS.
- K. Narayanaswamy, G. Blanquart and H. Pitsch, Combust. Flame, 2010, 157, 1879–1898 CrossRef CAS.
- M. Frenklach, D. W. Clary, W. C. Gardiner and S. E. Stein, Symp. (Int.) Combust., 1985, 20, 887–901.
- H. Richter, O. A. Mazyar, R. Sumathi, W. H. Green, J. B. Howard and J. W. Bozzelli, J. Phys. Chem. A, 2001, 105, 1561–1573 CrossRef CAS.
- I. V. Tokmakov and M. C. Lin, J. Am. Chem. Soc., 2003, 125, 11397–11408 CrossRef CAS PubMed.
- V. V. Kislov, N. I. Islamova, A. M. Kolker, S. H. Lin and A. M. Mebel, J. Chem. Theory Comput., 2005, 1, 908–924 CrossRef CAS PubMed.
- Y. Georgievskii and S. J. Klippenstein, J. Phys. Chem. A, 2003, 107, 9776–9781 CrossRef CAS.
- A. M. Mebel, Y. Georgievskii, A. W. Jasper and S. J. Klippenstein, Proc. Combust. Inst., 2017, 36, 919–926.
- A. Fahr and S. E. Stein, Symp. (Int.) Combust., 1989, 22, 1023–1029 CrossRef.
- T. Yu, M. C. Lin and C. F. Melius, Int. J. Chem. Kinet., 1994, 26, 1095–1104 CrossRef CAS.
- T. Yu and M. C. Lin, J. Am. Chem. Soc., 1993, 115, 4371–4372 CrossRef CAS.
- D. S. N. Parker, R. I. Kaiser, T. P. Troy and M. Ahmed, Angew. Chem., Int. Ed., 2014, 53, 7740–7744 CrossRef CAS PubMed.
- T. Yang, T. P. Troy, B. Xu, O. Kostko, M. Ahmed, A. M. Mebel and R. I. Kaiser, Angew. Chem., Int. Ed., 2016, 55, 14983–14987 CrossRef CAS.
- J. E. Middaugh, Z. J. Buras, M. Matrat, T.-C. Chu, Y.-S. Kim, I. M. Alecu, A. K. Vasiliou, C. F. Goldsmith and W. H. Green, Rev. Sci. Instrum., 2018, 89, 074102 CrossRef PubMed.
- Z. J. Buras, T. C. Chu, A. Jamal, N. W. Yee, J. E. Middaugh and W. H. Green, Phys. Chem. Chem. Phys., 2018, 20, 13191–13214 RSC.
- J. E. Middaugh, PhD thesis, Massachusetts Institute of Technology, 2014.
- M. J. Frisch, G. W. Trucks, H. B. Schlegel, G. E. Scuseria, M. A. Robb, J. R. Cheeseman, G. Scalmani, V. Barone, G. A. Petersson, H. Nakatsuji, X. Li, M. Caricato, A. V. Marenich, J. Bloino, B. G. Janesko, R. Gomperts, B. Mennucci, H. P. Hratchian, J. V. Ortiz, A. F. Izmaylov, J. L. Sonnenberg, D. Williams-Young, F. Ding, F. Lipparini, F. Egidi, J. Goings, B. Peng, A. Petrone, T. Henderson, D. Ranasinghe, V. G. Zakrzewski, J. Gao, N. Rega, G. Zheng, W. Liang, M. Hada, M. Ehara, K. Toyota, R. Fukuda, J. Hasegawa, M. Ishida, T. Nakajima, Y. Honda, O. Kitao, H. Nakai, T. Vreven, K. Throssell, J. A. Montgomery Jr., J. E. Peralta, F. Ogliaro, M. J. Bearpark, J. J. Heyd, E. N. Brothers, K. N. Kudin, V. N. Staroverov, T. A. Keith, R. Kobayashi, J. Normand, K. Raghavachari, A. P. Rendell, J. C. Burant, S. S. Iyengar, J. Tomasi, M. Cossi, J. M. Millam, M. Klene, C. Adamo, R. Cammi, J. W. Ochterski, R. L. Martin, K. Morokuma, O. Farkas, J. B. Foresman and D. J. Fox, Gaussian 16 Rev. B.01, Gaussian Inc., Wallingford, CT, 2016 Search PubMed.
- H. J. Werner, P. J. Knowles, G. Knizia, F. R. Manby and M. Schütz, WIREs Comput. Mol. Sci., 2012, 2, 242–253 CrossRef CAS.
- P. J. Knowles, C. Hampel and H. J. Werner, J. Chem. Phys., 1993, 99, 5219–5227 CrossRef CAS.
- P. J. Knowles and H. J. Werner, Theor. Chim. Acta, 1992, 84, 95–103 CrossRef CAS.
- P. J. Knowles, J. S. Andrews, R. D. Amos, N. C. Handy and J. A. Pople, Chem. Phys. Lett., 1991, 186, 130–136 CrossRef CAS.
- R. D. Amos, J. S. Andrews, N. C. Handy and P. J. Knowles, Chem. Phys. Lett., 1991, 185, 256–264 CrossRef CAS.
- P. J. Knowles and N. C. Handy, Comput. Phys. Commun., 1989, 54, 75–83 CrossRef CAS.
- H. J. Werner and P. J. Knowles, J. Chem. Phys., 1988, 89, 5803–5814 CrossRef CAS.
- P. J. Knowles and H. J. Werner, Chem. Phys. Lett., 1988, 145, 514–522 CrossRef CAS.
- H. J. Werner and P. J. Knowles, J. Chem. Phys., 1985, 82, 5053 CrossRef CAS.
- P. J. Knowles and H. J. Werner, Chem. Phys. Lett., 1985, 115, 259–267 CrossRef CAS.
- P. J. Knowles and N. C. Handy, Chem. Phys. Lett., 1984, 111, 315–321 CrossRef CAS.
- J. W. Allen, C. F. Goldsmith and W. H. Green, Phys. Chem. Chem. Phys., 2012, 14, 1131–1155 RSC.
- C. W. Gao, J. W. Allen, W. H. Green and R. H. West, Comput. Phys. Commun., 2016, 203, 212–225 CrossRef CAS.
- A. M. Mebel, Y. Georgievskii, A. W. Jasper and S. J. Klippenstein, Faraday Discuss., 2016, 195, 637–670 RSC.
- A. W. Jasper, C. M. Oana and J. A. Miller, Proc. Combust. Inst., 2015, 35, 197–204 CrossRef CAS.
- Y. Georgievskii and S. J. Klippenstein, MESS.2016.3.23.2016.
- Y. Georgievskii, J. A. Miller, M. P. Burke and S. J. Klippenstein, J. Phys. Chem. A, 2013, 117, 12146–12154 CrossRef CAS PubMed.
- H. Wang and M. Frenklach, Combust. Flame, 1994, 96, 163–170 CrossRef CAS.
- K. Han, A. Jamal, C. A. Grambow, Z. J. Buras and W. H. Green, Int. J. Chem. Kinet., 2018, 50, 294–303 CrossRef CAS.
- M. T. Baeza-Romero, M. A. Blitz, A. Goddard and P. W. Seakins, Int. J. Chem. Kinet., 2012, 44, 532–545 CrossRef CAS.
- T. Adam and R. Zimmermann, Anal. Bioanal. Chem., 2007, 389, 1941–1951 CrossRef CAS PubMed.
- Z. Zhou, M. Xie, Z. Wang and F. Qi, Rapid Commun. Mass Spectrom., 2009, 23, 3994–4002 CrossRef CAS PubMed.
- Y. Y. Li, J. Z. Yang and Z. J. Cheng, Photonionization Cross Section Database (Version2.0), http://flame.nsrl.ustc.edu.cn/database/.
- Y. Li, L. Zhang, Z. Tian, T. Yuan, J. Wang, B. Yang and F. Qi, Energy Fuels, 2009, 23, 1473–1485 CrossRef CAS.
- H. Xu and S. T. Pratt, J. Phys. Chem. A, 2013, 117, 9331–9342 CrossRef CAS PubMed.
- Y. A. Dyakov, J. Chem. Phys., 2012, 137, 064314 CrossRef PubMed.
- Chemical Workbench 4.1.18493, Kintech Lab, Moscow, Russia, 2016 Search PubMed.
- H. Wang and M. Frenklach, J. Phys. Chem., 1994, 98, 11465–11489 CrossRef CAS.
- J. D. Bittner and J. B. Howard, Symp. (Int.) Combust., 1981, 18, 1105–1116 CrossRef.
- N. W. Moriarty, N. J. Brown and M. Frenklach, J. Phys. Chem. A, 1999, 103, 7127–7135 CrossRef CAS.
- M. Frenklach, N. W. Moriarty and N. J. Brown, Symp. (Int.) Combust., 1998, 27, 1655–1661 CrossRef.
- B. M. Wong, D. M. Matheu and W. H. Green, J. Phys. Chem. A, 2003, 107, 6206–6211 CrossRef CAS.
- J. Zádor, C. A. Taatjes and R. X. Fernandes, Prog. Energy Combust. Sci., 2011, 37, 371–421 CrossRef.
- A. M. Knepp, G. Meloni, L. E. Jusinski, C. A. Taatjes, C. Cavallotti and S. J. Klippenstein, Phys. Chem. Chem. Phys., 2007, 9, 4315–4331 RSC.
- E. G. Estupiñán, J. D. Smith, A. Tezaki, S. J. Klippenstein and C. A. Taatjes, J. Phys. Chem. A, 2007, 111, 4015–4030 CrossRef.
- J. D. DeSain, S. J. Klippenstein, J. A. Miller and C. A. Taatjes, J. Phys. Chem. A, 2003, 107, 4415–4427 CrossRef CAS.
Footnote |
| † Electronic supplementary information (ESI) available. See DOI: 10.1039/c9cp04554f |
| This journal is © the Owner Societies 2019 |

