 Open Access Article
Creative Commons Attribution 3.0 Unported Licence
Understanding the interdependence of operating parameters in microbial electrosynthesis: a numerical investigation†
Siddharth
Gadkari
 *ab,
Mobolaji
Shemfe
b,
J. Annie
Modestra
c,
S. Venkata
Mohan
c and
Jhuma
Sadhukhan
ab
aCentre for Environment and Sustainability, University of Surrey, Guildford, Surrey GU2 7XH, UK. E-mail: s.gadkari@surrey.ac.uk
bDepartment of Chemical and Process Engineering, University of Surrey, Guildford GU2 7XH, UK
cBioengineering and Environmental Sciences Lab, CEEFF Department, CSIR-Indian Institute of Chemical Technology (CSIR-IICT), Hyderabad 500 007, India
First published on 14th May 2019
Abstract
This study describes and evaluates a dynamic computational model for a two chamber microbial electrosynthesis (MES) system. The analysis is based on redox mediators and a two population model, describing bioelectrochemical kinetics at both anode and cathode. Mass transfer rates of the substrate and bacteria in the two chambers are combined with the kinetics and Ohm's law to derive an expression for the cell current density. The effect of operational parameters such as initial substrate concentration at the anode and cathode and the operation cycle time on MES performance is evaluated in terms of product formation rate, substrate consumption and coulombic efficiency (CE). For a fixed operation cycle time of 3 or 4 days, the anode and cathode initial substrate concentrations show linear relationship with product formation rate; however MES operation with a 2 day cycle time shows a more complex behaviour, with acetic acid production rates reaching a plateau and even a slight decrease at higher concentrations of the two substrates. It is also shown that there is a trade-off between product formation rate and substrate consumption and CE. MES performance for operation with cycle time being controlled by substrate consumption is also described. Results from the analysis demonstrate the interdependence of the system parameters and highlight the importance of multi-objective system optimization based on targeted end-use.
1 Introduction
Microbial electrosynthesis (MES) is a type of bioelectrochemical device which involves electricity driven microbial reduction of carbon dioxide into a variety of useful multi-carbon compounds.1–3 While the MES setup typically involves the combination of a chemical anode with a biocatalysed cathode (biocathode), systems with both biocatalyzed anode and cathode are also being investigated.1,4–7 When a biocatalysed anode (bioanode) is used in MES, wastewater or sludge hydrolysates which typically contain a multitude of organic substances or contaminants can be used as a substrate at the anode.1,4,6 At the bioanode the organics/contaminants in the waste stream function as the electron source and undergo oxidation to produce electrons and protons, which can then be subsequently used for microbial reduction at the cathode. The external power required for microbial oxidation of wastewater organics at the bioanode is lower than that required for water splitting at the abiotic anode.7 Bioanode based MES has the potential to produce high value organic chemicals from wastewater streams and CO2, thus allowing recovery of useful energy in the form of chemicals from waste. It also allows the use of low-cost carbon materials as electrodes in comparison with chemical anodes, which typically require costly electrodes for water electrolysis.1,4,5Several products, including methane, acetic acid, propanol, butanol and ethanol, can be microbially synthesised from CO2 reduction at different potentials.1,3,8 To date, acetic acid (AA) has been the most reported product in the literature.9–12 AA is a versatile intermediate for producing several chemicals, including vinyl acetate monomers, esters and acetic anhydride, for the manufacture of synthetic fibers, textiles, inks, and pesticides.13 Current industrial production methods of AA such as methanol carbonylation, dubbed the ‘Monsanto process’, acetaldehyde oxidation, oxidation of n-butane, fermentation of hydrocarbons, and ethane direct oxidation all use raw materials extracted from fossil fuels.14,15 Consequently, they are resource-intensive and environmentally damaging. The plausibility of MES to replace these industrial systems necessitates the optimization of MES and efficient quantification of the production rates.
Significant progress has been made in the past decade towards understanding the physico-electrochemical and biological mechanisms of the process, which has helped in improving the product yields.16–18 However the performance is still far behind from making a strong business case for large scale implementation.3,16,18 Thorough understanding of the relationships among the various parameters and their dynamic processes is important to make this technology more efficient.2,19,20 Computational models can complement experimental studies towards MES optimization and expedite the development of this technology. However past research on MES has extensively focused on experimental studies, and barring a few numerical investigations, modeling and simulation remain mostly neglected.19–24
Pinto et al.22 proposed a multi-population dynamic model of a microbial electrolysis cell (MEC) and derived an expression for the hydrogen production rate at the chemical cathode based on MEC current and specific cathode efficiency. The bacterial population at the anode is assumed to consist of fermentative, electricigenic, methanogenic acetoclastic, and methanogenic hydrogenophilic microorganisms, whose metabolic activity and growth rates are described using multiplicative Monod kinetics. This model expressed in ordinary differential equations is based on the assumption that a single hydrolysis and fermentation step of complex organic matter conversion to acetate can be used to describe the anaerobic degradation of wastewater. Though this model is not derived for MES directly and does not consider any biocatalyst at the cathode, it serves as a good starting point for more comprehensive numerical models for different microbial electrochemical cells.22
Kazemi et al.23 used the conductive biofilm approach and modeled the biocathode in an MES to study the bioelectrosynthesis of acetate by CO2 reduction. The rate of microbial reduction at the cathode is described using a Nernst–Monod expression assuming that the biofilm matrix conducts electrons from the cathode to the biofilm bacteria. The biomass is classified into two types, active (bacteria responsible for CO2 reduction) and inert (inactive conductive components such as EPS and nanowires). An expression for overpotential is derived from electron balance and Ohm's law, combining the electron flux in the conductive matrix with electron consumption (from CO2 reduction) and electron generation (due to self-oxidation of biomass) terms. This model predicts the biofilm dynamics, substrate concentration and current density profiles; however the analysis is limited to the cathode and does not account for the influence of electrode kinetics and mass transfer losses at the anode.23
In a previous study by the authors,24 a dynamic model also based on the conductive biofilm approach was used to study formic acid synthesis in a bioelectrochemical system (BES). Current density and local overpotential along the biofilm depth were correlated with the conductivity of the biofilm matrix. However this model was based on bioanode kinetics alone and assumed a non-limiting cathode. To the authors’ knowledge, thus far, a comprehensive dynamic simulation (considering both anode and cathode kinetics) of microbially catalyzed electrosynthesis of AA from CO2 reduction via MES is yet to be performed.
In the present study, for the first time, a comprehensive one dimensional dynamic model has been developed for a two chamber microbial electrosynthesis system. The modeling framework is based on a two-population model and accounts for the bioelectrochemical kinetics at both the (bio)electrodes, which are combined to the mass balance of substrates and bacteria in the respective electrode chambers. Potential losses are derived and are used to calculate the MES current and product formation rate. The dynamic model applicability for optimization studies is illustrated by examining the effect of operating parameters on MES performance.
2 Methodology
The mathematical modeling framework has been developed based on a two chamber MES, assuming both electrodes are catalyzed using bacteria. The experimental setup as described by Modestra and Mohan4 has been used for reference. The anode chamber which is inoculated with untreated anaerobic bacteria may consist of several different types of microbial populations.4 For this analysis, the bacteria in the anode are classified into two types, primary anodic bacteria (the ‘exoelectrogenic’ bacteria that consume the substrate (COD) and release electrons which can be transferred to the anode) and secondary anodic bacteria (which can include fermentative/methanogenic bacterial types that decompose the substrate into smaller compounds but do not transfer any free electrons in the process). The cathode chamber is inoculated with selectively enriched homoacetogenic bacteria which mainly reduce CO2/bicarbonate to AA.4 However the presence of small quantities of butyric and propionic acids in the final product suggests the presence of other bacterial types that can either reduce CO2/bicarbonate or elongate AA to produce higher carbon (C3 and C4) compounds.4 Thus in the model, the bacterial population at the cathode is also classified into two types, primary cathodic bacteria (such as the enriched homoacetogenic bacteria in this case, that reduce CO2/bicarbonate to acetic acid) and secondary cathodic bacteria (chain elongators or other bacterial types that are capable of producing higher carbon compounds by direct CO2 reduction or elongation of C2 compounds). Here it should be noted that the terms ‘primary’ and ‘secondary’ are being used in a generalized framework and the specific sub-type of bacteria in each of these categories will depend on the individual systems. Some MES systems with pure culture may not have any secondary bacteria at all. Also, for MES with a chemical anode, there will be no anodic bacteria.In addition to the above description, the following assumptions are made in deriving the dynamic model:
• Substrates in both anolyte and catholyte are perfectly mixed.
• Microbial populations in the biofilms of the anode and cathode chambers are uniformly distributed.
• pH and temperature are strictly controlled.
• Gases produced during oxidation and reduction reactions in the anode and cathode remain dissolved in the respective bulk solutions.
• Activation overpotential at the anode is negligible.
• Extracellular electron transfer to and from the electrodes is assumed to take place using redox mediators.
2.1 Material balance in the anode chamber
In the anode chamber, the primary microbial population (xp,a) consumes the substrate (Sa) and in this process the oxidized form of the redox mediator (Moxa) is also converted into its reduced form (Mreda). This reduced mediator exchanges the electron with the anode and also releases a proton while it regains its oxidized form. The above sequence of reactions between the anode substrate and the redox mediators can be described conceptually as in eqn (1) and (2).| Sa + Moxa → Mreda + CO2 | (1) |
| Mreda → Moxa + e− + H+ | (2) |
Meanwhile, the secondary bacterial population (xs,a) also consumes the substrate but does not release any free electrons which can be utilized by the redox mediators. Considering a fed-batch operation,4 the rate of change of substrate and biomass concentrations can be expressed as in eqn (3)–(5).
 | (3) |
 | (4) |
 | (5) |
The redox mediator in the anode biomass exists in either oxidized (Moxa) or reduced form (Mreda); however the total mediator concentration Mtotala remains constant.
| Mtotala = Moxa + Mreda | (6) |
As the primary bacteria decompose the substrate, the oxidized form of the redox mediator is transformed into its reduced form, which then transfers electrons to the anode and is converted back to its oxidized form. The transfer of electrons results in current flow and thus the rate of change of oxidized mediator concentration can be expressed as in eqn (7).
 | (7) |
The Monod kinetic model, describing the relationship between growth rate of bacteria and the concentration of the limiting nutrients, is the most commonly used model for describing the bacterial growth and substrate consumption rates.25 The substrate consumption rate of the primary bacteria and the corresponding microbial growth rate are limited by both the substrate and the oxidized mediator concentrations. On the other hand, the substrate consumption rate of the secondary bacteria and the corresponding microbial growth rate are only limited by the substrate concentration. Thus the substrate consumption and growth rates for primary bacteria are represented by multiplicative Monod kinetics (eqn (8) and (9)), while the same for secondary bacteria are described using standard Monod kinetics (eqn (10) and (11)).
 | (8) |
 | (9) |
 | (10) |
 | (11) |
2.2 Material balance in the cathode chamber
In the cathode chamber, the oxidized form of the redox mediator (Moxc) accepts the electron from the cathode and is converted into its reduced form (Mredc). The primary microbial population at the cathode (xp,c) consume the substrate (Sc) and utilize the reduced mediator to produce the main product, AA. In this process the reduced form of the mediator is converted back to the oxidized form. The sequence of reactions between the cathode substrate and the redox mediators, leading to the formation of product (AA), can be described conceptually as in eqn (12) and (13).| Moxc + e− + H+ → Mredc | (12) |
| Sc + Mredc → AA + Moxc | (13) |
The secondary bacterial population at the cathode (xs,c) may also consume the substrate. The rate of change of substrate and that of microbial populations at the cathode are represented as in eqn (14)–(16).
 | (14) |
 | (15) |
 | (16) |
Similar to the anode chamber, the total mediator concentration in the cathode biomass (Mtotalc) is the sum of its reduced (Mredc) and oxidized (Moxc) forms.
| Mtotalc = Moxc + Mredc | (17) |
The rate of change of reduced mediator concentration at the cathode is a function of the substrate consumption rate by primary bacteria and the MES current and is described as in eqn (18).
 | (18) |
The substrate consumption and growth rates for primary bacteria at the cathode are represented by multiplicative Monod kinetics, while the same for secondary bacteria are represented using standard Monod kinetics as described in eqn (19)–(22).
 | (19) |
 | (20) |
 | (21) |
 | (22) |
2.3 Ohm's law and voltage losses
As the equilibrium cell voltage in a MES is negative, the reactions at the electrodes are non-spontaneous and thus an external power is required.26 Additionally there are activation (anode and cathode), concentration (anode and cathode) and ohmic voltage losses in the system, which need to be compensated by the external power requirement.22,26 Thus the total applied voltage in a MES can be expressed as in eqn (23).| −Eapp = EBEMF − ηohm − ηconca − ηconcc − ηacta − ηactc | (23) |
This analysis assumes a constant supply of redox mediators, which undergo transformation between oxidized and reduced forms as they exchange electrons to or from the electrodes. Considering this, the major factor influencing the concentration overpotential is the substrate concentration at the two electrodes. The corresponding voltage losses at the anode and cathode can thus be represented as in eqn (24) and (25).
 | (24) |
 | (25) |
Voltage is also lost as activation energy due to slow electrochemical kinetics at the electrodes. Such potential loss in MES to drive the electrochemical reactions from equilibrium state is assumed to be far greater at the cathode as compared to the anode and is often the controlling factor of MES performance. Thus the activation overpotential at the anode is neglected while that at the cathode (ηactc) can be expressed as a function of current density using the Butler–Volmer expression. Hamelers et al.27 combined the Monod kinetics (describing the biochemical oxidation of the substrate) with the Butler–Volmer electron transfer kinetics to derive a steady state expression for the current density as a function of overpotential in a microbial fuel cell. In this analysis, the voltage balance and Ohm's law are used to derive the dynamic expression for current density. The Butler–Volmer equation is used to describe the polarisation at the cathode. Assuming the symmetry factor or the charge transfer coefficient as 0.5, the Butler–Volmer equation can be re-arranged as a hyperbolic sine function, which provides the expression for activation overpotential as in eqn (26):
 | (26) |
Based on Ohm's law, the ohmic voltage drop (ηohm) is directly proportional to the current density, and can be expressed as in eqn (27):
| ηohm = ImesRohm | (27) |
Eqn (27) can be substituted in eqn (23) to obtain an expression for MES current as described in eqn (28).
 | (28) |
Following a similar approach as suggested by Pinto et al.,29 the model rigor was further improved by incorporating an expression for Rohm as a function of primary bacteria concentration, described as in eqn (29).
| Rohm = Rmin + (Rmax − Rmin)e(−KR(xp,a+xp,c)) | (29) |
2.4 Product formation rate
The product formation rate is a direct function of current density. However as mentioned before, the secondary bacteria can also use the primary product to convert it into secondary products. Thus the final production rate of the primary product, Qp (mol m−3 d−1), can be expressed as in eqn (30). | (30) |
Q sp is assumed to be a function of only Qp and is expressed as in eqn (31).
 | (31) |
A substantial consumption of AA begins only after reaching a certain threshold concentration, which would differ for different cathode bacterial populations and is described using the rate of primary product elongation (qp2). It should also be noted that the primary and secondary products can be different for different MES setups and depend mainly on the bacterial strains used at the cathode. For example, in the MES studied by Modestra and Mohan,4 the cathode is inoculated with enriched acetogenic bacteria, thus the primary product is AA, whereas Choi et al.30 used an acidogenic clostridium strain, Clostridium tyrobutyricum, which primarily produces butyrate and acetate is only a secondary product.
3 Results and discussion
The mathematical model for a two chamber MES system as described in Section 2 is generic. It can be used to assess the productivity and performance of wastewater valorization and carbon dioxide reduction in different microbial electrosynthesis systems. The effectiveness of the proposed model has been demonstrated by studying the performance of the MES described by Modestra and Mohan,4 under different operating conditions.3.1 Parameter estimation
First, the model parameters such as the maximum substrate consumption rates, maximum microbial growth rates, yield coefficients, etc., that are specific to the experimental study and the setup are estimated by best-fit regression analysis by comparing the numerical results with experimental values obtained from Modestra and Mohan.4 In the simulation based curve fitting method, the objective function (defined in eqn (32)) is minimized to obtain the parameter values. | (32) |
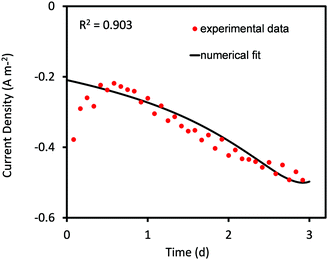 | ||
| Fig. 1 Predicted values of current density obtained from curve fitting using the Nelder–Mead Simplex algorithm compared to the corresponding experimental values for 3 days of MES operation. | ||
In the current analysis, the Nelder–Mead optimization algorithm is constrained to obtain 90% agreement with the experimental data. Once this condition is met the simulation is stopped and the fitted parameter values are obtained. The constraint helps in obtaining a reasonably good agreement with minimum computational expense. However, it is also responsible for the poor compliance of predicted values during the first 12 hours. The agreement can be improved by continuing the simulation longer; however this would also extend the computation time significantly.
It should also be noted that the reliability of the fitted parameters is largely dependent on the available experimental data. As highlighted, in this analysis, the data are available for only one set of operating conditions, and thus the fitted parameters are conditional to the single objective function and may not be unique. Fitting to experimental data for a range of operating conditions could offer a more unique estimate; however for the current analysis this remains one of the main limitations.
Parameter values which are known to have the largest impact on MES performance such as the maximum substrate consumption and growth rates of the primary bacteria at the anode and cathode are fitted first before obtaining other values. The accuracy of the current predicted values is assessed in the next section, comparing the predicted results for change in cathode substrate concentration and AA production for the same set of operating conditions.
3.2 Validation
Based on the experimental data of AA production,4 the threshold value of AA above which its elongation to higher carbon compounds starts is 0.09 mol m−3 s−1. This is substituted while solving for eqn (30) and (31). Fig. 2 shows the comparison of numerically predicted values of change in cathode substrate concentration and amount of acetic acid produced as a function of time to that observed in the experimental study.4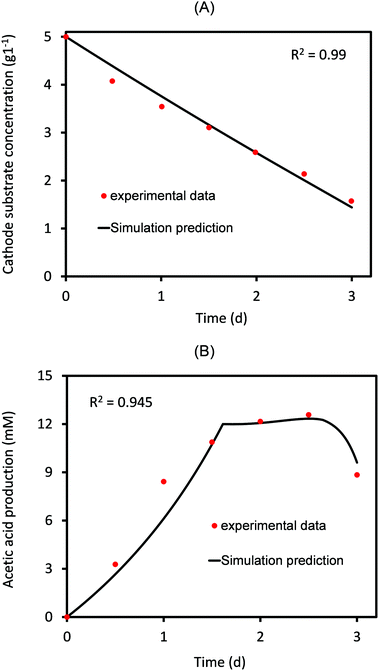 | ||
| Fig. 2 Predicted values of (A) cathode substrate concentration and the (B) acetic acid produced as a function of time compared to the corresponding experimental values for 3 days of MES operation. | ||
As can be seen in Fig. 2, there is a close agreement between the experimental and predicted values, indicating a reasonably good estimate of the parameters. As expected, the substrate concentration at the cathode almost linearly decreases with time (Fig. 2A). On the other hand, the concentration of AA produced increases linearly for the first 1.8 days, after which it remains almost constant for some time and then slowly starts decreasing. The reason for such a decrease is the consumption of AA for elongation to secondary products (C3/C4 compounds). This utilization of the primary product has been accurately included in the model (eqn (31)), which provides a good agreement between predicted and experimental values, as shown in Fig. 2B. Several experimental studies on MES have reported the formation of different secondary products, the type and concentrations of which vary with the nature of microbial populations used at the cathode.30,33 The current model is generic and can be used to analyze different MES focusing on a variety of products using different bacterial strains and substrates. In case where the primary product is not being consumed/elongated to produce secondary products, qp2 in eqn (31) should be equated to zero.
3.3 Effect of substrate concentrations
The dynamic model is used to study how the initial substrate concentrations at the anode (Sain) and at the cathode (Scin) influence the MES performance in terms of the primary product (in this case AA) formation rate. For this analysis, the MES is assumed to be operating in fed-batch mode in a cycle of 3 days.4 After 3 days, the feed in both the anode and cathode chambers is changed and replenished to initial concentrations. The substrate feed at the anode is wastewater and is expressed in terms of COD concentration.As can be seen from Fig. 3, the increase in both COD and initial cathode substrate concentrations (Sain and Scin) shows an overall increase in the AA production rate (QAA); there are however some variations from this general behaviour particularly for Scin. While the increase in Sain from 1 g L−1 to 5 g L−1 leads to an increase in QAA for all values of Scin, the increase in Scin from 2.5 g L−1 to 7.5 g L−1 does not always lead to an increase in QAA, mainly at lower values of Sain (<2.25 g L−1). For smaller Sain, QAA first decreases with increasing Scin up to a certain threshold Scin and then starts increasing with a further increase in Scin. This threshold Scin where the relationship between QAA and Scin changes starts decreasing as Sain increases. For the lowest Sain used in this analysis, 1 g L−1, QAA decreases as Scin is increased from 2.5 g L−1 to 5 g L−1, and then starts increasing for higher Scin values. For Sain = 1.25 g L−1, 1.5 g L−1, 1.75 g L−1 and 2 g L−1, the threshold Scin value decreases from 4 g L−1 to 2.75 g L−1. For all Sain > 2 g L−1, an increase in Scin leads to a linear increase in the AA production rate!
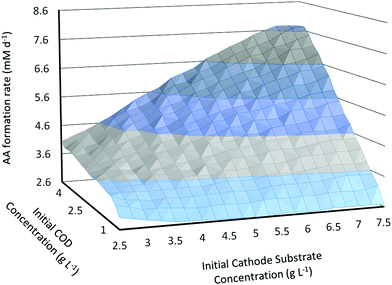 | ||
| Fig. 3 Predicted AA production rate (mM d−1) as a function of initial substrate concentrations in the anode and cathode chambers. | ||
Another important observation is that QAA reaches a plateau and shows a slight decrease at high values of both Sain and Scin. Thus a slight flattening of the surface plot in Fig. 3 is observed near the highest values of substrate concentrations. For the range of initial substrate concentrations studied in this analysis, the highest QAA = 7.75 mM d−1 is obtained for Scin = 7.25 g L−1 and Sain = 5 g L−1, whereas the lowest QAA = 2.6 mM d−1 is obtained for Scin = 5 g L−1 and Sain = 1 g L−1.
Mohanakrishna et al.34 used enriched mixed homoacetogenic bacteria as cathodic bio-catalyst and studied the influence of substrate concentration at the cathode on the acetate production rate. They also observed an increase in the acetate production rate as cathode substrate concentration was increased from 1 g L−1 to 4 g L−1. Mohanakrishna et al.34 suggested that an increase in substrate concentration leads to an increase in substrate availability, change in the biocathode reduction potential and gain in the coulombic efficiency, all of which contribute to improving the acetate production rate at higher substrate concentrations. Increased Sain also increases substrate availability for consumption at the bioanode, thus releasing more electrochemical reductive equivalents such as protons and electrons for eventual consumption at the cathode. This increased availability of reductive equivalents helps in improving the AA production rate.
An important factor that would closely determine the MES economical performance is the amount of substrate consumption achieved. It should be noted that with a bioanode, the substrate used in the anode chamber could be wastewater, which is quantified by the COD concentration. The amount of COD degraded/consumed in the bioanode could reduce the subsequent processing required to treat the wastewater. This will have major implications in terms of the energy saved and the final effective cost per kg of product. At the cathode, the amount of substrate (CO2/bicarbonate) consumed in each cycle would determine the recycling rate and would also affect the overall cost significantly. An ideal MES operation would provide 100% substrate consumption with a high product formation rate to achieve the best economic performance.
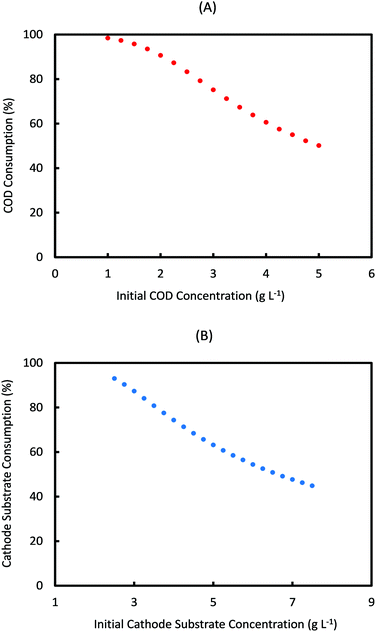
For a fed-batch system, substrate consumption is quantified per cycle of operation, whereas in a continuous system this would be determined by the flow rate of anolyte/catholyte and residence time of substrates in each electrode chamber. Fig. 4 shows the prediction of substrate consumption in one cycle, for the range of anode and cathode initial substrate concentrations used in Fig. 3. As can be seen from Fig. 4, the percentage of substrate consumed in both anode and cathode decreases with the increase in the respective substrate concentrations. This is expected as under a given cycle time, the amount of each substrate consumed is limited and when a higher concentration feed is used, more substrate will remain unconsumed. However these data are important to assess the performance of MES, by comparing with the product formation rate at these concentrations.
Based on Fig. 4, the percentage of anode substrate consumed in one cycle decreases from 100% at Sain = 1 g L−1 to 50% at Sain = 5 g L−1. Similarly the percentage of cathode substrate consumed decreases from 93% at Scin = 2.5 g L−1 to 45% at Scin = 7.5 g L−1. It should also be noted that change in Sain had a negligible influence on cathode substrate consumption, and similarly change in Scin had almost no effect on anode substrate consumption. For the specific initial substrate concentrations (Scin = 7.25 g L−1 and Sain = 5 g L−1) which show the maximum AA production rate (7.75 mM d−1), the anode and cathode substrate consumption achieved is only 50% and 46% respectively. On the other hand, the consumption achieved for initial substrate concentrations (Scin = 5 g L−1 and Sain = 1 g L−1) which predict the minimum AA production rate (2.6 mM d−1) is 98.5% and 63% respectively!
The third important factor that determines MES performance is the percentage of total charge (Coulombs) that is recovered as products or the coulombic efficiency (CE) of the system. Fig. 5 shows the variation in CE (%) as a function of initial substrate concentrations at the anode and cathode. While the x-axis in Fig. 5 represents Scin, the individual curves refer to different Sain, moving from 1 g L−1 for the top curve to 5 g L−1 for the bottommost curve. As can be seen from Fig. 5, CE decreases with the increase in both Sain and Scin, and for both, the decrease slows down at higher values as CE reaches a plateau. A similar trend of CE decreasing with increasing Scin has been previously described in the numerical study by Kazemi et al.23
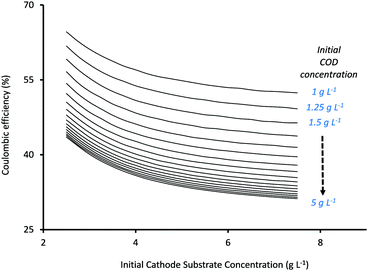 | ||
| Fig. 5 Predicted coulombic efficiency (%) as a function of initial substrate concentrations in the anode and cathode chambers. | ||
Mohanakrishna et al.34 also studied the effect of Scin on CE and found it to vary in a rather non-linear fashion. They observed that CE initially decreased from 45.55% to 39.56% as the initial substrate concentration (HCO3−) was increased from 1 g L−1 to 1.5 g L−1. However with a further increase in HCO3− concentration to 2 g L−1 and 2.5 g L−1, an average CE of 40.37% and 56.25% respectively, was observed. Their hypothesis was that the increase in bicarbonate concentration increased the conductivity of the catholyte which thereby improved the use of hydrogen for acetate production. However they mentioned that CE showed fluctuations in the different cycles of operation with different HCO3− concentrations and highlighted the need for more comprehensive studies.34
Based on the current analysis, the maximum CE of 64.63% was observed for Sain = 1 g L−1 and Scin = 2.5 g L−1, while the lowest CE (31.2%) was observed at the highest substrate concentrations of Sain = 5 g L−1 and Scin = 7.5 g L−1. The increase in substrate concentration also results in a simultaneous increase in substrate availability for secondary bacteria at both anode and cathode, and depending on the competition between the individual rates of substrate consumption of the different bacteria, it can result in reduced charge (Coulombs) recovery at the cathode (or lower CE). Thus the relationship between substrate concentrations and CE becomes very specific for each system (depending on the type of substrate and the bacterial inoculum used in the MES) and cannot be generalized. For the current analysis, a reduction in CE at higher substrate concentrations (which show better product formation rates) will result in poor energy efficiency and will effectively drive up the total operational cost of the system.
By comparing Fig. 3–5, it can be seen that there is a trade-off between product formation rate, and substrate consumption and coulombic efficiency. Similar relationship between the performance factors has been previously shown for microbial fuel cells, with power density increasing with substrate concentration but COD consumption and CE decreasing at higher concentrations.35,36 Selecting the specific initial concentrations will depend on the targeted end-use and the economic implications of the different options. The current dynamic model will serve as a good starting point for shortlisting a range of Sain and Scin values for improved performance under given operating conditions. The data from the dynamic model can be integrated with techno-economic and life cycle assessment studies for further sustainability analysis, as shown in our previous study.24
3.4 Effect of operation cycle time
In addition to substrate concentration, another important parameter that can have a significant influence on the performance of fed-batch MES systems is the operation cycle time (Ct). For the analysis so far, Ct was fixed as 3 days. Similar to flow rate in continuous systems, Ct determines the residence time of substrates in the fed-batch systems. Reducing or increasing Ct would potentially introduce changes in the AA production rate as well as the substrate consumption rates and CE. Fig. 6A and B show the change in the AA production rates as a function of different initial substrate concentrations for Ct of 2 days and 4 days, respectively. As can be seen from these figures, the effect of increasing initial substrate concentrations on QAA for Ct of 4 days (Fig. 6B) is very similar to that observed for Ct of 3 days (described in Section 3.3, Fig. 3); however the effect is very different when the Ct is reduced to 2 days (Fig. 6A). It should also be noted that the range of QAA observed with 4 days Ct for different substrate concentrations is relatively much lower than that observed for either 2 or 3 days of operation cycle time.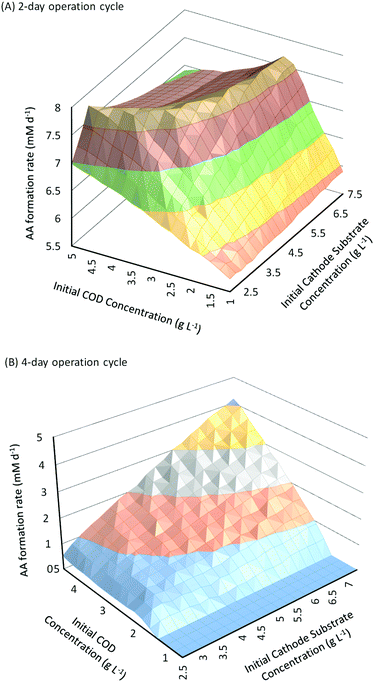 | ||
| Fig. 6 Predicted AA production rate (mM d−1) as a function of initial substrate concentrations in the anode and cathode chambers for (A) 2 day and (B) 4 day operation cycles. | ||
For a cycle time of 2 days (Fig. 6A), QAA first shows a linear increase with the increase in Sain or Scin; however such linear relationship is only valid at smaller values of substrate concentrations. For all Scin > 3.25 g L−1, when Sain is increased from 1 g L−1 to 5 g L−1, QAA first increases linearly and then reaches a plateau followed by a slight decrease. Similarly for all Sain > 1.25 g L−1, when Scin is increased from 2.5 g L−1 to 7.5 g L−1, QAA increases linearly but soon reaches a plateau after a certain threshold Scin and then begins to decrease with a further increase in Scin.
The threshold value where the increase in QAA with Sain or Scin reaches a plateau increases at higher values of Scin or Sain respectively. This leads to the unique trough observed at higher values of Sain and Scin in the surface plot shown in Fig. 6. Compared to a 3 day operation cycle, where the AA production rate varies from 2.6 mM d−1 to 7.74 mM d−1, the range of AA production rates for a 2 day operation cycle (5.7 mM d−1 to 7.76 mM d−1) is much smaller between different substrate concentrations. However this range also suggests that AA production rates are relatively high with Ct of 2 days even at low values of Sain and Scin. Maximum QAA with Ct of 2 days (7.76 mM d−1) is observed for Sain = 5 g L−1 and Scin = 3.25 g L−1.
When the operation cycle time is increased to 4 days (Fig. 6B), both Sain and Scin show a linear relationship with QAA, but the product formation rate is substantially reduced. It should also be noted that QAA is negligible (∼0) for Sain < 2 g L−1. This occurs because a longer cycle time allows a higher conversion of AA into secondary products. Thus until QAA reaches a sufficiently high value (which is obtained for Sain ≥ 2 g L−1), all the AA formed is consumed before it can be recovered at the end of the cycle. Higher Ct and in effect higher residence time is also responsible for the overall reduction in QAA (maximum of 4.3 mM d−1 obtained when Sain = 5 g L−1 and Scin = 7.5 g L−1) observed for a 4 day operation cycle.
For the range of values of Sain and Scin studied in Fig. 6, the amount of substrate consumed and the coulombic efficiency as a function of initial substrate concentrations are shown in Fig. 7 and 8, respectively, for a cycle time of 2 days and 4 days. As can be seen from Fig. 7, percentage substrate consumption for Ct of 2 days is relatively smaller than that observed for 4 days Ct for same values of Sain and Scin. This is expected as Ct decides the residence time of the substrate, and a higher residence time allows for higher consumption of substrates.
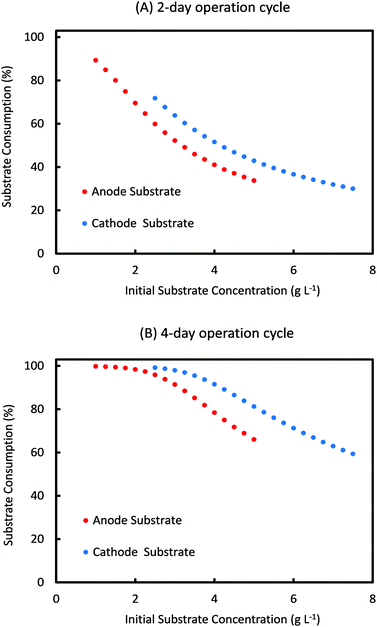 | ||
| Fig. 7 Simulation prediction of percentage substrate consumption for different initial concentrations of anode and cathode substrates for a cycle time of (A) 2 days and (B) 4 days. | ||
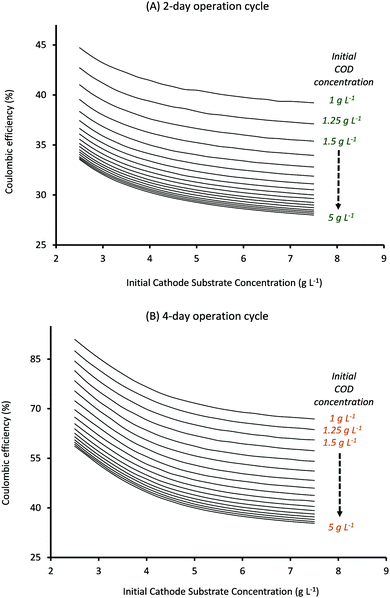 | ||
| Fig. 8 Predicted AA production rate (mM d−1) as a function of initial substrate concentrations in the anode and cathode chambers for (A) 2 day and (B) 4 day operation cycles. | ||
Also, as can be seen from Fig. 8, CE for cycle times of 2 and 4 days follows the same trend with substrate concentrations as observed for a cycle time of 3 days (Fig. 5). It should be noted that CE clearly shows a linear relationship with Ct, with the highest CE ∼ 90% being observed for lowest substrate concentrations when Ct is 4 days (Fig. 8B) while the lowest CE ∼ 28% is obtained at highest substrate concentrations when Ct is reduced to 2 days (Fig. 8A).
Comparing the results observed in Fig. 6 with that in Fig. 7 and 8, it can be seen that the specific substrate concentrations which provide the highest AA production rate with a 2 day Ct (7.76 mM d−1) show anode and cathode substrate consumption of just 33% and 60% respectively and CE of 31.5%. Thus even though reducing the cycle time can help to produce higher quantities of the product, the overall operation may not be economically feasible given the poor substrate consumption rates and the low coulombic efficiency. Optimum operating conditions (initial substrate concentrations and cycle time) can be found by selecting the parameter values that provide sufficiently high product formation rates without compromising on the substrate consumption rates. The specific criterion can be decided based on the targeted end-use. For the current system, Ct of 2 days and initial anode and cathode substrate concentration values of 1.75 g L−1 and 2.5 g L−1, respectively, provide an AA production rate of 6.02 mM d−1 (which is only ∼20% smaller than the highest product formation rate observed) and anode and cathode substrate consumption of 75% and 71% respectively with a coulombic efficiency of ∼40%. These operating conditions can be used to obtain sufficiently high product formation and substrate consumption rates with average coulombic efficiency. If product formation or COD consumption is one of the major goals, specific values that provide highest QAA or anode substrate consumption could be selected respectively. Predictions obtained from the current model, in terms of operating diagrams (plots described in Fig. 3–8), can be effectively used to obtain the optimum range of operation for a given MES system based on the specific end-use.
3.5 Cycle time controlled by substrate consumption
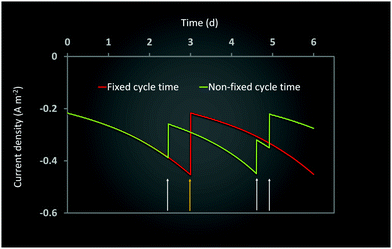
Ct determines the specific time when the feed is changed in the two electrode chambers. As the amount of substrate consumed is determined by the specific type of bacteria at the anode and cathode and their initial concentrations, the effective rates of consumption are different in the two chambers. As can be seen from Fig. 4 and 7, this often leads to one or both the substrates remaining unconsumed which then adds up to the recycling cost or may even result in increasing waste. If Ct is not fixed but is determined by the amount of substrate consumption, it can lead to increased utilization of each substrate and reduced waste. Such a mechanism can be easily implemented with the help of specific sensors which monitor the concentration of substrate in each chamber and accordingly control the replenishment. New feed can be introduced once a certain minimum consumption (for e.g. 90 or 95%) has been achieved. However while such a mechanism reduces substrate loss or recycling costs, the installation of the new sensors and the control valves will add to the capital investment. A techno-economic analysis (TEA) of the system can help to determine the difference in operating costs the new mechanism would entail. From the dynamic analysis perspective, it is interesting to understand the effect of a non-fixed Ct (which is only governed by substrate consumption) on the MES performance.Fig. 9 shows the simulation predictions of the AA production rate as a function of different initial substrate concentrations at the anode and cathode while keeping the initial concentration of other substrate fixed. For this analysis, the substrate feed in each chamber is changed after achieving 95% consumption. As can be seen from Fig. 9, there is no specific pattern observed for QAA as a function of either Sain or Scin. For the anode substrate, QAA first decreases as Sain is increased from 1 g L−1 to 2 g L−1 and then remains constant up to Sain = 4 g L−1. For higher Sain values (>4 g L−1), QAA shows a linear increase with Sain. This nonlinear pattern as seen in Fig. 9A is actually expected because the AA production rate is a function of cell current density, which undergoes fluctuation every time either anode or cathode feed is changed. Since the feed change time is not fixed, as opposed to the results described in Sections 3.3 and 3.4, the current density profile is no longer a smooth periodic curve. This difference is highlighted in Fig. 10, which compares the profile of current density as a function of time for a MES cell with fixed Ct of 3 days to a MES cell where Ct is not fixed, but the feed is replenished after achieving 95% substrate consumption in respective chambers. As can be seen from Fig. 10, for the MES cell where Ct is not fixed, the current density profile is no longer smooth and periodic but undergoes arbitrary fluctuations which occur due to feed changes.
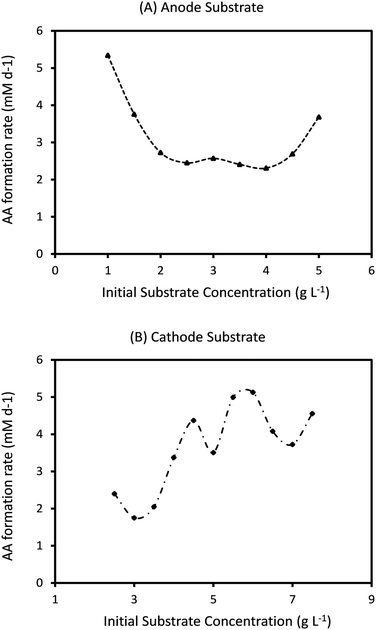 | ||
| Fig. 9 Predicted AA production rate (mM d−1) as a function of different initial substrate concentrations at (A) anode (with fixed Scin = 5 g L−1) and (B) cathode (with fixed Sain = 1.5 g L−1). | ||
The results shown in Fig. 9A and B refer to the average values of QAA obtained after 20 cycles of operation. For the specific conditions described in Fig. 9A, the highest QAA = 5.3 mM d−1 is obtained for Sain = 1 g L−1, which is much lower than the maximum QAA observed for MES operated with fixed Ct of 2 or 3 days. Also, QAA observed under the operating conditions (Sain = 1 g L−1 and Scin = 5 g L−1) which provide the maximum production rate with a non-fixed Ct (Fig. 9A) is close to 100% higher than that observed when Ct is fixed at 3 days and about 10% lower than that with Ct of 2 days. For the cathode substrate, as can be seen in Fig. 9B, with increasing Scin, QAA shows sinusoidal variation with an upward trend. The maximum QAA = 5.1 mM d−1, observed at Scin = 6 g L−1, is even lower than that obtained with changing Sain (Fig. 9A). However under the same operating conditions (Sain = 1.5 g L−1 and Scin = 6 g L−1) that provide maximum QAA when Ct is not fixed (Fig. 9B), QAA is ∼52% lower when Ct is fixed at 3 days but about 25% higher when Ct is reduced to 2 days.
Overall the results show the complex interdependence between the different operating parameters and their influence on the MES performance. Based on the current analysis, it can be seen that before an optimum set of conditions can be selected, it is important to correlate the effect of any given parameter as a function of other dependent parameters, and also how it affects the different performance factors. The problem becomes more daunting when along with the design and operational parameters, the biological factors (different for various bacterial strains) also need to be accounted.
The proposed dynamic model presented above has wide applicability in parametric studies to understand the influence of different parameters on the MES performance and can be used for multi-objective optimization. Based on the targeted end-use, specific constraints such as product formation rate above a certain value, substrate consumption rate greater than a fixed percentage, specific coulombic efficiency, initial substrate concentrations above or below a specific value depending on the feed, limitations of growth rate or substrate consumption rates depending on the inoculum, etc., can be included in the model to determine the optimum operating conditions for MES design and operation for the particular end-use.
The inclusion of bioelectrochemical kinetics and potential losses at both anode and cathode makes this model unique and an important advancement over previous modeling studies of microbial electrosynthesis systems. The one-dimensional nature of the model, though restrictive by not accounting for the spatial dynamics of the biofilm and its interaction with the substrate and the electrodes, does provide fast computation without being overly simplistic.
4 Conclusion
In this study, a detailed mathematical model is presented for the wastewater valorization and carbon dioxide reduction to carboxylic acids in a two chamber microbial electrosynthesis system. The dynamic model is used to study the effect of initial substrate concentrations of anode and cathode and the operation cycle time on the rate of product formation, substrate consumption and coulombic efficiency. While an increase in initial substrate concentrations generally improved the product formation rates, it reduced the substrate consumption as well as CE. On the other hand reducing the operation cycle time favored product formation rates but reduced the substrate consumption and CE. The dynamic model is also used to evaluate MES performance when cycle time is not fixed but is controlled by substrate consumption rate. To conclude, the proposed model can be used for effective multi-objective optimization of the different operating parameters of MES to achieve optimum performance based on the targeted end use. Integration of these dynamic simulation results with techno-economic and life cycle analysis can provide a holistic understanding of the overall sustainability of MES.Conflicts of interest
There are no conflicts to declare.Acknowledgements
Authors would like to acknowledge the financial support by the Natural Environment Research Council (NERC) UK project grant: NE/R013306/1, Engineering and Physical Sciences Research Council (EPSRC) UK project grant: EP/N009746/1 and Department of Biotechnology (DBT), India in the form of a project grant BT/PR20759/BCE/8/1218/2016.Notes and references
- K. Rabaey and R. A. Rozendal, Nat. Rev. Microbiol., 2010, 8, 706–716 CrossRef CAS PubMed.
- J. Sadhukhan, J. R. Lloyd, K. Scott, G. C. Premier, H. Y. Eileen, T. Curtis and I. M. Head, Renewable Sustainable Energy Rev., 2016, 56, 116–132 CrossRef CAS.
- Y. Jiang, H. D. May, L. Lu, P. Liang, X. Huang and Z. J. Ren, Water Res., 2019, 149, 42–55 CrossRef CAS PubMed.
- J. A. Modestra and S. V. Mohan, J. CO2 Util., 2017, 20, 190–199 CrossRef CAS.
- S. Cheng, D. Xing, D. F. Call and B. E. Logan, Environ. Sci. Technol., 2009, 43, 3953–3958 CrossRef CAS PubMed.
- Y. Gong, A. Ebrahim, A. M. Feist, M. Embree, T. Zhang, D. Lovley and K. Zengler, Environ. Sci. Technol., 2012, 47, 568–573 CrossRef PubMed.
- Y. Xiang, G. Liu, R. Zhang, Y. Lu and H. Luo, Bioresour. Technol., 2017, 233, 227–235 CrossRef CAS PubMed.
- J. Desloover, J. B. Arends, T. Hennebel and K. Rabaey, Biochem. Soc. Trans., 2012, 40, 1233–1238 CrossRef CAS PubMed.
- K. P. Nevin, T. L. Woodard, A. E. Franks, Z. M. Summers and D. R. Lovley, mBio, 2010, 1, e00103 CrossRef PubMed.
- C. W. Marshall, D. E. Ross, E. B. Fichot, R. S. Norman and H. D. May, Appl. Environ. Microbiol., 2012, 78, 8412–8420 CrossRef CAS PubMed.
- J. A. Modestra, B. Navaneeth and S. V. Mohan, J. CO2 Util., 2015, 10, 78–87 CrossRef.
- K. P. Nevin, S. A. Hensley, A. E. Franks, Z. M. Summers, J. Ou, T. L. Woodard, O. L. Snoeyenbos-West and D. R. Lovley, Appl. Environ. Microbiol., 2011, 77, 2882–2886 CrossRef CAS PubMed.
- F. Wagner, in Encyclopedia of Chemical Technology, ed. K. Othmer, John Wiley & Sons, 2000, pp. 63–64 Search PubMed.
- V. H. Agreda, Acetic acid and its derivatives, CRC Press, 1992 Search PubMed.
- P. Pal and J. Nayak, Sep. Purif. Rev., 2017, 46, 44–61 CrossRef CAS.
- Y. Jiang and R. J. Zeng, Bioresour. Technol., 2018, 269, 503–512 CrossRef CAS PubMed.
- H. Nie, T. Zhang, M. Cui, H. Lu, D. R. Lovley and T. P. Russell, Phys. Chem. Chem. Phys., 2013, 15, 14290–14294 RSC.
- F. Harnisch and C. Urban, Angew. Chem., Int. Ed., 2018, 57, 10016–10023 CrossRef CAS PubMed.
- D. Recio-Garrido, M. Perrier and B. Tartakovsky, Chem. Eng. J., 2016, 289, 180–190 CrossRef CAS.
- S. Gadkari, S. Gu and J. Sadhukhan, Chem. Eng. J., 2018, 343, 303–316 CrossRef CAS.
- S. Luo, H. Sun, Q. Ping, R. Jin and Z. He, Energies, 2016, 9, 111 CrossRef.
- R. Pinto, B. Srinivasan, A. Escapa and B. Tartakovsky, Environ. Sci. Technol., 2011, 45, 5039–5046 CrossRef CAS PubMed.
- M. Kazemi, D. Biria and H. Rismani-Yazdi, Phys. Chem. Chem. Phys., 2015, 17, 12561–12574 RSC.
- M. Shemfe, S. Gadkari, E. Yu, S. Rasul, K. Scott, I. Head, S. Gu and J. Sadhukhan, Bioresour. Technol., 2018, 255, 39–49 CrossRef CAS PubMed.
- N. S. Panikov, Microbial Growth Kinetics, Springer Science & Business Media, 1995 Search PubMed.
- B. Korth and F. Harnisch, in Bioelectrosynthesis, ed. F. Harnisch and D. Holtmann, Springer International Publishing, Cham, Switzerland, 2019, pp. 273–325 Search PubMed.
- H. V. Hamelers, A. Ter Heijne, N. Stein, R. A. Rozendal and C. J. Buisman, Bioresour. Technol., 2011, 102, 381–387 CrossRef CAS PubMed.
- M. Esfandyari, M. A. Fanaei, R. Gheshlaghi and M. A. Mahdavi, Int. J. Hydrogen Energy, 2017, 42, 21198–21202 CrossRef CAS.
- R. Pinto, B. Srinivasan, S. Uiot and B. Tartakovsky, Water Res., 2011, 45, 1571–1578 CrossRef CAS PubMed.
- O. Choi, Y. Um and B.-I. Sang, Biotechnol. Bioeng., 2012, 109, 2494–2502 CrossRef CAS PubMed.
- J. A. Nelder and R. Mead, Comput. J., 1965, 7, 308–313 CrossRef.
- L. Surhone, M. Timpledon and S. Marseken, Nelder–Mead Method: Simplex Algorithm, Optimization (Mathematics), Numerical Analysis, Unimodal Function, Heuristic, John Nelder, Simplex, Polytope, Betascript Publishing, 2010 Search PubMed.
- A. K. Mostafazadeh, P. Drogui, S. K. Brar, R. D. Tyagi, Y. Le Bihan and G. Buelna, J. Environ. Chem. Eng., 2017, 5, 940–954 CrossRef.
- G. Mohanakrishna, K. Vanbroekhoven and D. Pant, React. Chem. Eng., 2018, 3, 371–378 RSC.
- Y. Feng, X. Wang, B. E. Logan and H. Lee, Appl. Microbiol. Biotechnol., 2008, 78, 873–880 CrossRef CAS PubMed.
- T. H. Sleutels, L. Darus, H. V. Hamelers and C. J. Buisman, Bioresour. Technol., 2011, 102, 11172–11176 CrossRef CAS PubMed.
Footnote |
| † Electronic supplementary information (ESI) available. See DOI: 10.1039/c9cp01288e |
| This journal is © the Owner Societies 2019 |

