Resolving X-ray photoelectron spectra of ionic liquids with difference spectroscopy†
Coby J.
Clarke‡
 *a,
Steven
Maxwell-Hogg
a,
Emily F.
Smith
a,
Rebecca R.
Hawker
 b,
Jason B.
Harper
 b and
Peter
Licence
 *a
*a
aSchool of Chemistry, The University of Nottingham, University Park, Nottingham, UK. E-mail: Coby.clarke@imperial.ac.uk; Peter.licence@nottingham.ac.uk
bSchool of Chemistry, University of New South Wales, Sydney, Australia
First published on 28th November 2018
Abstract
X-ray photoelectron spectroscopy (XPS) is a powerful element-specific technique to determine the composition and chemical state of all elements in an involatile sample. However, for elements such as carbon, the wide variety of chemical states produce complex spectra that are difficult to interpret, consequently concealing important information due to the uncertainty in signal identity. Here we report a process whereby chemical modification of carbon structures with electron withdrawing groups can reveal this information, providing accurate, highly refined fitting models far more complex than previously possible. This method is demonstrated with functionalised ionic liquids bearing chlorine or trifluoromethane groups that shift electron density from targeted locations. By comparing the C 1s spectra of non-functional ionic liquids to their functional analogues, a series of difference spectra can be produced to identify exact binding energies of carbon photoemissions, which can be used to improve the C 1s peak fitting of both samples. Importantly, ionic liquids possess ideal chemical and physical properties, which enhance this methodology to enable significant progress in XPS peak fitting and data interpretation.
1 Introduction
X-ray photoelectron spectroscopy (XPS) gives information regarding the chemical states of elements in a sample.1–3 Different oxidation states and electronic environments can be identified and quantified for all elements (except for hydrogen and helium),4 making XPS a powerful technique for surface analysis of inorganic and organic samples. Prominent areas that utilise XPS include solid-state materials, polymers, nanoscience, and more recently, ionic liquids (ILs).5–8 When an element occupies multiple chemical states, such as the carbon 1s photoemission of organic structures, signals appear complex and unresolved. This phenomenon is inherent to XPS as the FWHM of core photoemissions are large compared to the binging energy (B.E.) ranges of most common chemical states. For this reason, peak fitting models are used to interpret the characteristic structures of convoluted photoemissions, imparting an uncertainty to the information obtained from complex spectra.9,10 Many of the fitting models described to date assign peaks by conjecture or examining vast numbers of samples relative to each other to incrementally improve peak fitting paramteres.11–17 Importantly, there is no absolute peak fitting method and expert analysts have warned that interpretation of XP spectra is likely to lead to mistakes.10 Therefore, a reliable methodology is essential to extract valuable information from complex photoemission spectra.As an ultra-high vacuum (UHV) based technique, most liquids would rapidly evaporate under XPS experimental conditions. However, the extremely low volatility of ionic liquids (ILs) have enabled the investigation of liquid phase processes (e.g. solvent–solvent and solvent–solute interactions) by XPS.18–22 Investigations of IL surfaces have also produced a wealth of information regarding the liquid–gas interface, nanostructure, and surface enrichment of solutes, primarily due to the element specific nature of XPS.23–26 Importantly, XPS studies of ILs are complimented by strong photoelectron fluxes that give rise to intense, narrow signals emitted by flat IL surfaces. Furthermore, ILs are electrically conducting, which prevents significant differential charging, and have an apparent high beam stability due to the dynamic liquid surface.27 IL XP spectra are consequently exceptionally high quality and are often superior to the XP spectra of solid organic powders.
IL chemical structures produce complex C 1s photoemission spectra because of the diverse chemical states of carbon, which occupy both electron-rich aliphatic environments and electron-poor ionic environments. The complexity of IL C 1s spectra are dictated by the cation (i.e. covalent bonding, charge delocalisation), anion (i.e. charge transfer, presence of carbon), alkyl chain lengths, and presence of functional groups.13,28–31 Hence, accurate and reliable C 1s fitting models are needed to unlock all of the information present in an XP spectrum. However, due to the lack of standard procedures, different C 1s fitting models have been developed for even the most basic IL chemical structures. For example, the C 1s region of imidazolium ILs have been fitted with 2–3 component models, which broadly account for polar and non-polar regions,32 or more complex fittings with 3+ components.21,33 While the latter can potentially provide more information, simpler models are a conservative approach aimed at minimising over interpretation of XP spectra.
Post-analysis data interpretation is problematic for any complex system with multiple chemical states and often a limiting factor for the successful application of XPS as an analytical method. Although there are numerous methodologies and tools for determining the goodness of fit for XP spectra, most serve as error analyses to identify poor peak fittings and do not indicate correct peak assignments.34–36 Peak fitting by intuition can also produce misleading results as XP spectra are a combination of initial and final state effects. XPS has significant final state effect contributions and previous publications have warned against interpreting B.E. shifts <0.5 eV in IL XP spectra in terms of atomic charges.32,37 Despite this, correlations between core-electron B.E.s and physicochemical properties (e.g. Kamlet–taft parameters)21,22,31 support the drive for accurate peak fittings, regardless of the physical interpretation of the data.
Difference spectra can be generated by subtracting one core-level XP spectrum from the same core-level spectrum of another sample. This method can provide useful information when the samples are structurally related. A relevant example by Cremer et al. used the difference between two homologous imidazolium ILs to definitively identify the C 1s photoemission of a C2-methyl group.22 By subtracting the C 1s photoemissions of [C8C1Im][A] (Note: A = mono- or poly-atomic anions) from methylated analogues [C8C1C1Im][A], the resulting difference spectra had single peaks representing the additional carbon atom of the [C8C1C1Im][A] ILs. Another example by Briggs and Fairley demonstrated the usefulness of XP difference spectra for understanding surface modification of low-density polyethylene (LDPE) thin films.15 The C 1s XP spectrum of untreated LDPE was subtracted from the C 1s spectra of a range of chemically oxidised LDPE samples. The difference spectra were used to identify changes in chemical state and the area of the photoemissions were compared to oxygen at% to assess peak fitting variables (e.g. lineshapes and FWHMs). Importantly, these overlooked experiments demonstrate that incremental structural modifications can produce consistent XP photoemissions that differ by discreet and quantifiable changes. This work develops this principle to provide the first targeted chemical functionalisation of samples for identification of XP photoemissions.
ILs are considered neoteric designer solvents as their physicochemical properties can be tuned by chemical modification to improve their functions, i.e. they are task-specific (TSILs).38 There are numerous examples of TSIL XPS investigations, most focused towards characterising the impact of functional groups on IL physical properties.20,28,31 However, some studies have sought to utilise the designer aspect of ILs to expand XPS as an analytical tool. Prominent examples include monitoring gas–liquid (e.g. CO2 capture by amines)39 or liquid phase (e.g. alkylations, dehydrogenation of organic compounds, or thermochromic transformations of organometallics)40–42 chemical processes by anchoring functional groups to the involatile IL phase. Maier et al. have discussed the details and importance of such investigation in a 2017 perspective published in the Journal of Chemical Physics.43 Here, we exploit the tunable nature of ILs to effect electronic changes in the IL cation to facilitate XPS peak fittings. The ILs presented in this work are therefore task-specific for XP spectroscopic measurements; further support that their unique properties are perfectly complimentary to XPS.
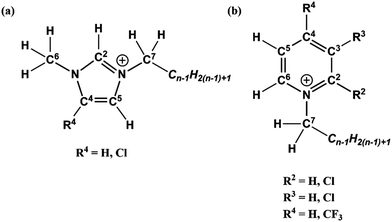
Although a wide variety of ILs have been analysed by XPS, this work investigates pyridinium, [CnPy][A], and imidazolium, [CnC1Im][A], ILs which have been a primary focus throughout the development of liquid phase XPS. Furthermore, their complex C 1s spectra arise from both aromatic and aliphatic carbon chemical states, producing photoemission peaks that spread from low (≈285.0 eV) to high (≈293.0 eV) B.E.s. By exploiting the designer aspect of ILs, targeted functionalisation of [CnPy][A] and [CnC1Im][A] with electron withdrawing groups (EWGs) such as chlorine and trifluoromethane (see Fig. 1) has been used to shift electron density from specific locations. Comparison of the TSILs XP spectra to non-functional analogues gives difference spectra that reveal the initial and final photoemission B.E.s, simultaneously improving both XP spectra fittings.
 | ||
| Fig. 1 Structures of the chlorine- and trifluoromethane-functionalised cations (left) and anions (right) presented in this work. | ||
2 Experimental
2.1 Synthesis
Full synthetic procedures and characterisation of the functionalised ILs are reported in the ESI.† The non-functionalised IL XPS data was re-used from previous projects which have published the synthesis and characterisation of the ILs to confirm sample purity. In this work, the 2-chloropyridinium salts were synthesised by N-alkylation of 2-hydroxypyridine, followed by chlorination of the N-alkylpyridone with phosphorus(V) oxychloride and subsequent anion metathesis (Scheme 1) to give N-alkyl-2-chloropyridinium bis(trifluoromethanesulfonyl)imides, [CnPy-2-Cl][NTf2] (where n = 4 or 8), which were light brown liquids at room temperature. The 3-chloropyridinium salts, [CnPy-3-Cl][A] (where n = 4 or 8, and [A] = [BF4]− or [NTf2]−), were synthesised by similar procedures to non-functionalised pyridinium ILs, i.e. alkylation of 3-chloropyridine followed by anion metathesis in water (Scheme 2), to give light brown liquids at room temperature. [C8Py-4-(CF3)][NTf2] was synthesised by alkylation of 4-(trifluoromethane)pyridine with bromooctane, followed by anion metathesis in water (Scheme 3). The chlorine-functionalised imidazolium salts, [CnC1Im-4-Cl][NTf2] (where n = 4 or 8), were synthesised by Rebecca Hawker at UNSW and full synthetic procedures and characterisation have been previously published elsewhere.44 All ILs prepared for this work have been characterised by 1H and 13C NMR, HRMS, XPS and either ion chromatography (IC) or the aqueous silver nitrate test to determine anion purity (see the ESI† for further details). | ||
| Scheme 2 Synthesis of N-alkyl-3-chloropyridinium ionic liquids, [CnPy-3-Cl][A], from 3-chloropyridine. | ||
 | ||
| Scheme 3 Synthesis of [C8Py-4-(CF3)][NTf2] by alkylation of 4-(trifluoromethane)pyridine, followed by anion metathesis in water. | ||
2.2 XPS
The difference spectra reported here are plotted on a common X-axis and the data points are aligned to allow data subtraction. This work uses the functionalised IL B.E. axis, therefore non-functionalised XP spectra are referenced to the functionalised IL XP spectra. This is achieved by setting the –CF3 signal maximum of the non-functionalised IL to the same B.E. as the functionalised ILs, or in the case of [BF4]− salts, the Cali component. All photoemissions are plotted on the functionalised IL x- and y-axes with the normalised non-functionalised IL photoemissions overlaid. Most y-axes therefore display arbitrary units and the difference spectra are generated on the functionalised IL scale. All area quantifications are relative to normalised spectra. A list of difference spectra and structural representation of the subtraction process are given in the ESI† (Fig. S2–S6). The non-functionalised XP spectra reported here have been previously published;22,27,30 the fully analysed spectra are shown in the ESI† (Fig. S25–S29) for comparative purposes. In addition, the experimental elemental compositions and nominal stoichiometries for the ILs presented in this work are displayed in the ESI† (Table S1).
3 Results
3.1 Pyridinium ILs
Survey and high resolution XP scans of [CnPy-2-Cl][NTf2] are shown in the ESI† (Fig. S11–S14); both ILs produce high quality XP spectra with no evidence of impurities or beam damage. Furthermore, all photoemission signal B.E.s (see Table 1) are consistent for both n = 4 and n = 8 samples (i.e. values are within the experimental error of ±0.1 eV), except for the changing aliphatic signal at 285.0 eV on increasing alkyl chain length (see Fig. S7, ESI†). Other than the expected changes in the C 1s region, the [CnPy-2-Cl][NTf2] photoemission B.E.s also show remarkable consistency to the [CnPy][NTf2] B.E.s. However, relative to the [CnPy][NTf2] ILs, a shift of 0.2 eV in the N 1s photoemission of the [NTf2]− anion from 399.5 eV to 399.3 eV was observed. As these values are within 0.1 eV of 399.4 eV, this observation can be considered within experimental error. However, previous work suggest that shifts of this magnitude are large enough to be a real effect and additional analyses are underway to investigate these observations. For the purpose of this work such shifts are not a primary focus and can be considered within error.| Ionic liquid | B.E./eV | |||||||||||||||
|---|---|---|---|---|---|---|---|---|---|---|---|---|---|---|---|---|
| C 1s | N 1s | O 1s | F 1s | B 1s | S 2p3/2 | Cl 2p3/2 | ||||||||||
| Cation | Anion | Caliphatic | C2 | C3 | C4 | C5 | C6 | C7 | CF3 | Cation | Anion | |||||
| a –CF3 from [NTf2]− anion. b –CF3 from [C8Py-4-(CF3)]+ cation. | ||||||||||||||||
| [C4Py]+ | [NTf2]− | 285.2 | 287.1 | 286.2 | 286.2 | 286.2 | 287.1 | 287.1 | 292.9 | 402.6 | 399.5 | 532.6 | 688.8 | 169.0 | ||
| [C8Py]+ | [NTf2]− | 285.0 | 287.1 | 286.1 | 286.1 | 286.1 | 287.1 | 287.1 | 292.9 | 402.6 | 399.5 | 532.6 | 688.8 | 169.0 | ||
| [C8Py]+ | [BF4]− | 285.0 | 286.9 | 286.0 | 286.0 | 286.0 | 286.9 | 286.9 | 402.4 | 685.9 | 194.2 | |||||
| [C4Py-2-Cl]+ | [NTf2]− | 285.1 | 288.4 | 286.1 | 286.1 | 286.1 | 287.0 | 287.0 | 292.8 | 402.6 | 399.3 | 532.6 | 688.8 | 168.9 | 201.8 | |
| [C8Py-2-Cl]+ | [NTf2]− | 285.0 | 288.5 | 286.1 | 286.1 | 286.1 | 287.0 | 287.0 | 292.9 | 402.6 | 399.3 | 532.6 | 688.8 | 168.9 | 201.9 | |
| [C4Py-3-Cl]+ | [NTf2]− | 285.3 | 287.1 | 287.6 | 286.2 | 286.2 | 287.1 | 287.1 | 293.0 | 402.7 | 399.5 | 532.7 | 688.9 | 169.0 | 201.5 | |
| [C8Py-3-Cl]+ | [NTf2]− | 285.0 | 287.1 | 287.6 | 286.1 | 286.1 | 287.1 | 287.1 | 292.9 | 402.7 | 399.5 | 532.7 | 688.9 | 169.0 | 201.5 | |
| [C8Py-3-Cl]+ | [BF4]− | 285.0 | 287.0 | 287.5 | 286.0 | 286.0 | 287.0 | 287.0 | 402.6 | 686.0 | 194.2 | 201.4 | ||||
| [C8Py-4-(CF3)]+ | [NTf2]− | 285.0 | 287.2 | 286.6 | 287.4 | 286.6 | 287.2 | 287.2 | 293.1a | 403.1 | 399.8 | 532.4 | 688.8a | 169.8 | ||
| 293.6b | 689.2b | |||||||||||||||
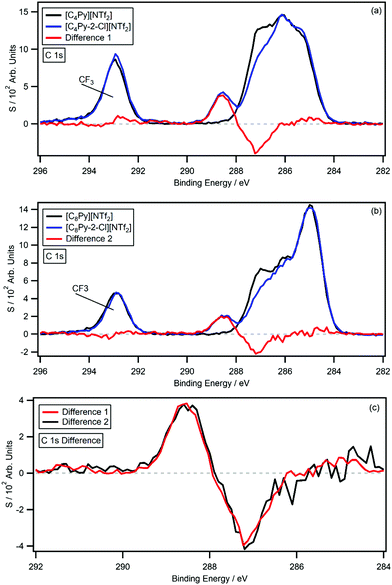
Fig. 3a and b show the C 1s photoemissions of [CnPy-2-Cl][NTf2] with the non-chlorinated [CnPy][NTf2] C 1s photoemissions overlaid on the respective plots. The difference spectra (difference 1 and 2) for both sets of ILs are also displayed on each plot; the difference was generated by subtracting the [CnPy][NTf2] C 1s photoemissions from the [CnPy-2-Cl][NTf2] C 1s photoemissions. Fig. 3c shows an overlay of the difference 1 and difference 2 normalised to the area of the positive signals. From 282 eV to 296 eV the difference spectra are flat, however both show coincident negative peaks at 287.1 eV and coincident positive peaks at 288.4 eV. This 1.3 eV shift is very large and indicates a significant loss of electron density from the C2 carbon of the pyridinium ring. Furthermore, the positive and negative peaks of the difference spectra have average areas equivalent to 0.83 and 0.85 carbon atoms, respectively (relative to their [CnPy-2-Cl][NTf2] C 1s photoemissions). Previous studies have measured an average of 10% signal loss from sp2-hybridised carbon atoms due to the shake-up/off phenomenon.30 The measured shake-up/off signals for the [CnPy-2-Cl][NTf2] ILs are 12.9% (n = 4) and 9.9% (n = 8), giving an average signal loss of 11.4%. The positive and negative signals therefore originate from a single carbon atom that has experienced shake-up/off losses, i.e. the sp2 hybridised C2 carbon atom.
The survey and high resolution XP scans of [CnPy-3-Cl][A] are shown in the ESI† (Fig. S15–S19); again, all ILs produce high quality XP spectra with no evidence of impurities or beam damage. The n = 4 and n = 8 [CnPy-3-Cl][NTf2] ILs have consistent photoemission B.E.s that are within the experimental error (Table 1), except for the aliphatic carbon signal at 285.0 eV, which increases with longer alkyl chain length (see Fig. S8, ESI†). Again, all [CnPy-3-Cl][A] photoemission B.E.s show remarkable consistency to their respective [CnPy][A] photoemission B.E.s, except for the expected changes in the C 1s regions (i.e. the C3 photoemission).
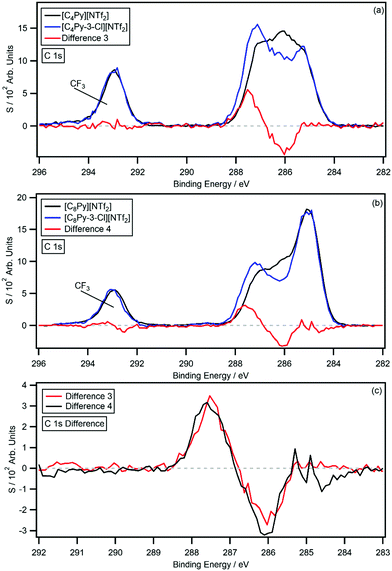
Fig. 4a and b show the C 1s photoemissions of [CnPy-3-Cl][NTf2] with the respective non-chlorinated [CnPy][NTf2] C 1s photoemissions overlaid. The difference spectra (difference 3 and 4) are also shown on each plot and Fig. 4c shows a normalised overlay for comparison; the difference spectra were generated by subtracting the [CnPy][NTf2] C 1s photoemissions from the [CnPy-3-Cl][NTf2] C 1s photoemissions. As with the [CnPy-2-Cl][NTf2] ILs, difference 3 and 4 are relatively flat from 282 eV to 296 eV, apart from coincident negative peaks at 286.1 eV and positive peaks at 287.5 eV ([C4Py-3-Cl][NTf2]) and 287.6 eV ([C8Py-3-Cl][NTf2]). Despite the 0.1 eV discrepancy for the positive peaks, the B.E. values are within the experimental error. The 1.4–1.5 eV shift is similar to that of the C2 chlorinated IL, indicating a significant reduction in electron density about the C3 carbon. Relative to the [CnPy][NTf2] C 1s photoemissions, the area of the negative peaks average to 0.91 carbon atoms, while the positive peaks average to 0.82 carbon atoms. The shake-up/off losses are 9.8% (n = 4) and 11.3% (n = 8), giving an average signal loss of 10.6%, which is similar to the average 10% shake-up/off losses measured for [CnPy][A] ILs. The signals therefore originate from a single sp2 hybridised carbon atom, i.e. the shifting C3 carbon.
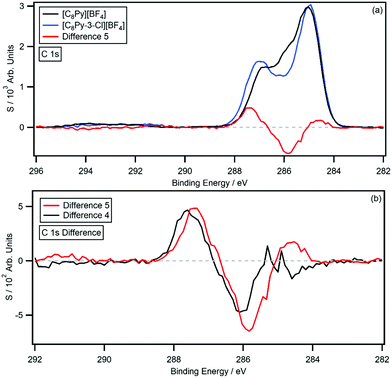
Fig. 5a shows the C 1s photoemissions of [C8Py-3-Cl][BF4] with the non-chlorinated [C8Py][BF4] C 1s photoemissions and resulting difference spectrum (difference 5); the difference was generated by subtracting the [C8Py][BF4] C 1s photoemissions from the [C8Py-3-Cl][BF4] C 1s photoemissions. Again, the difference spectrum is flat from 282 eV to 298 eV, except for a negative peak at 285.8 eV and a positive peak at 287.4 eV. The C3 carbon photoemission has therefore experienced a 1.6 eV shift, which is larger than the C2- and C3-chlorine functionalised IL. Relative to the [C8Py][BF4] C 1s photoemissions, the negative peak has an area equivalent to 0.98 carbon atoms, while the positive peak has an area equivalent to 0.86 carbon atoms. Shake-up/off losses have been experimentally determined to be 12.2%. Fig. 5b shows a comparison of difference 5 and difference 4 (the [C8Py-3-Cl][NTf2] and [C8Py][NTf2] difference spectrum); the spectra are normalised to the areas of the positive peaks.
The survey and high resolution XP scans of [C8Py-4-(CF3)][NTf2] are shown in the ESI† (Fig. S20). Again, the IL produces high quality XP spectra with no evidence of impurities in the survey scan, and no signs of beam damage from the high resolution scans. The B.E.s are summarised in Table 1 and the C 1s photoemission is displayed in Fig. 6, with the [C8Py][NTf2] C 1s photoemission overlaid for comparison. The difference spectrum (difference 6) was generated by subtracting the [C8Py][NTf2] C 1s photoemission from the [C8Py-4-(CF3)][NTf2] C 1s photoemission. Difference 6 has a relatively flat background; however, unlike the chlorine-functionalised ILs, there is an additional positive peak at 293.6 eV. This peak originates from the –CF3 carbon of the cation and integration of the peak relative to the [C8Py-4-(CF3)][NTf2] C 1s photoemission gives an area equivalent to 1.2 carbon atoms. The negative peak at 286.0 eV and the positive peak at 287.5 eV are equivalent to 1.1 and 1.5 carbon atoms, respectively. The 1.5 eV shift is similar in magnitude to the previously observed shifts; however, the carbon equivalents are higher than expected for this IL. The experimentally determined shake-up/off losses are 11.7%, close to the expected 10.0% signal loss.
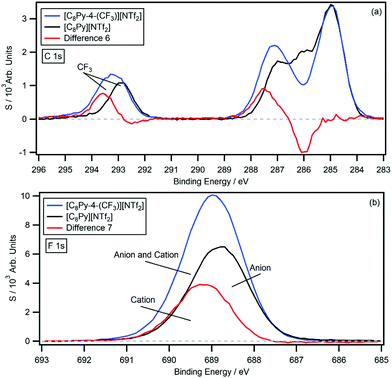 | ||
| Fig. 6 The difference (red) between the normalised (a) C 1s and (b) F 1s high resolution XP spectra of [C8Py-4-(CF3)][NTf2] (blue) and [C8Py][NTf2] (black). | ||
Given the presence of the –CF3 group of the cation, an additional difference spectrum can be generated by subtracting the [C8Py][NTf2] F 1s photoemission from the [C8Py-4-(CF3)][NTf2] F 1s photoemission. The results are displayed in Fig. 6b, which show the individual spectra and resulting difference spectrum (difference 7) with labels. Difference 7 shows a positive peak at 689.2 eV, which integrates to 3.20 fluorine atoms, relative to the [C8Py-4-(CF3)][NTf2] photoemission. This value is half that of the F 1s signal of the [NTf2]− anion, which possesses 6 fluorine atoms from the two –CF3 groups. The peak B.E. is also 0.4 eV higher than the –CF3 signal of the [NTf2]− anion at 688.8 eV, indicating that the pyridinium ring also has an electron withdrawing effect on the –CF3 group itself.
3.2 Imidazolium ILs
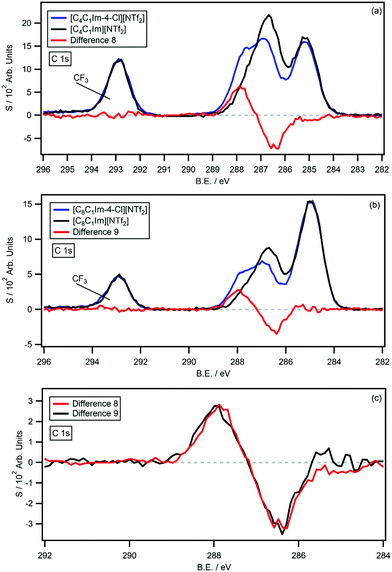
The survey and high resolution XP scans of [CnC1Im-4-Cl][NTf2] are shown in the ESI† (Fig. S21–S24); the ILs produce high quality XP spectra with no impurities or signs of beam damage. The B.E.s for [CnC1Im-4-Cl][NTf2] and the analogous non-functionalised [CnC1Im][NTf2] ILs are summarised in Table 2. The C 1s photoemissions are also displayed in Fig. 7a and b, along with the respective [CnC1Im][NTf2] C 1s photoemissions and the resulting difference spectra (difference 8 and 9). As before, difference 8 and 9 were generated by subtracting the [CnC1Im][NTf2] C 1s photoemission from the [CnC1Im-4-Cl][NTf2] C 1s photoemission. Fig. 7c also shows a normalised and overlaid plot of difference 8 and 9 for comparison. Both difference spectra are flat from 282 eV to 298 eV, apart from coincident negative peaks at 286.5 eV and coincident positive peaks at 287.9 eV. The 1.4 eV shift is similar in magnitude to the shifts measured for chlorine-functionalised pyridinium ILs, relative to their non-functionalised analogues. The negative and positive difference peaks integrate to average values of 0.87 and 0.83 carbon atoms, relative to their [CnC1Im-4-Cl][NTf2] C 1s photoemissions. The experimental shake-up/off losses are 16.8% (n = 4) and 22.2% (n = 8), giving an average signal loss of 19.8%. This value is close to the experimentally determined average of 20.0% for sp2 hybridised carbons of imidazolium ILs.27| Ionic liquid | B.E./eV | |||||||||||||
|---|---|---|---|---|---|---|---|---|---|---|---|---|---|---|
| C 1s | N 1s | O 1s | F 1s | S 2p3/2 | Cl 2p3/2 | |||||||||
| Cation | Anion | Caliphatic | C2 | C4 | C5 | C6 | C7 | CF3 | Cation | Anion | ||||
| [C1C4Im]+ | [NTf2]− | 285.2 | 287.7 | 286.6 | 286.6 | 287.0 | 287.0 | 293.0 | 402.1 | 399.5 | 532.7 | 688.9 | 169.0 | |
| [C1C8Im]+ | [NTf2]− | 285.0 | 287.7 | 286.6 | 286.6 | 287.0 | 287.0 | 293.0 | 402.1 | 399.5 | 532.7 | 688.8 | 169.0 | |
| [C1C4-4-ClIm]+ | [NTf2]− | 285.2 | 287.9 | 287.9 | 286.7 | 287.0 | 287.0 | 293.0 | 402.3 | 399.5 | 532.7 | 688.9 | 169.0 | 201.9 |
| [C1C8-4-ClIm]+ | [NTf2]− | 285.0 | 287.7 | 287.9 | 286.7 | 286.9 | 286.9 | 292.9 | 402.3 | 399.5 | 532.7 | 688.9 | 168.9 | 201.9 |
4 Discussion
4.1 Difference spectra
The difference spectra reported herein were generated by subtracting the C 1s photoemissions of non-functionalised IL from chlorine or trifluoromethane functionalised analogues. The data subtraction procedure produces flat backgrounds, with clear negative and positive peaks, which indicate the original and final photoemission B.E.s of the EWG-bound carbon. Although most difference spectra show remarkable consistency, some irregularities in negative peak shapes around 285.0 eV were observed in several cases (e.g. difference 5). The source is most likely small traces of aliphatic carbon that were not apparent in the individual HR C 1s scans. Aliphatic carbon is a common surface contaminant and difference spectra will be extremely sensitive to low levels of contamination as sample photoemissions effectively cancel out. Sample sputtering of IL surfaces can remove surface impurities; post acquisition difference spectra of identical samples could potentially reveal trace levels of surface contamination for future measurements. Fortunately, the data presented here is extremely high quality, with very low levels of aliphatic carbon. This is reflected in the resulting difference spectra which are of remarkable quality.The quantitative nature of XPS enables the number of carbon equivalents in difference spectra to be calculated. Errors are minimised as the XP spectra all originate from the same element (i.e. RSFs are not needed) and peak areas are measured relative to normalised photoemission spectra. The difference spectra of the chlorine functionalised ILs (relative to their non-functional ILs) all show signal loss from shake-up/off processes, with an average value of 0.88 ± 0.06 carbons. Interestingly, difference 6 show higher integrals with larger error, i.e. an average value of 1.27 ± 0.17 carbons relative to the [C8Py-4-(CF3)][NTf2] photoemission. The imidazolium IL difference spectra (difference 8 and 9) show higher signal losses of 0.85 carbons (averaged value), which is slightly lower than the 20% signal loss previously measured.27 The measured values support the single carbon assignments and provide further evidence that shake-up/off losses have been accurately calculated for both pyridinium and imidazolium IL C 1s photoemissions.
Chlorine functionalisation of [CnPy][NTf2] and [CnC1Im][NTf2] ILs produces a B.E. shift of +1.4(±0.1) eV, while C3 functionalisation of [C8Py][BF4] produces a larger shift of +1.6 eV. Further experiments are needed to determine whether a set B.E. shift is produced by each EWG; however, the results presented here are consistent for ILs with pyridinium and imidazolium cations with [NTf2]− counterions. Likewise, the B.E. shift for the C4 C 1s photoemission upon –CF3 functionalisation (i.e. the shift in the [CnPy][NTf2] and [C8Py-4-(CF3)][NTf2] difference spectrum) is +1.4 eV, suggesting that the two EWGs have similar electron withdrawing effects when measured by XPS. These B.E. shifts are far larger than can be described by final state effects alone and are therefore largely a result of electron withdrawal from the carbon electronic environment by covalent bonding to the EWGs. Fortunately, the large B.E. shift provides two resolved photoemission signals with similar lines shapes to the GL(30) peaks common to XPS. Weaker EWGs may produce overlapped signals and require peak fitting themselves.
Parallel to the C 1s difference spectra, the F 1s photoemission of the trifluoromethane functionalised [C8Py-4-(CF3)][NTf2] IL was subtracted from the F 1s photoemission of [CnPy][NTf2], to reveal the exact B.E. of the –CF3 fluorine (difference 7). However, it is important to note that this difference spectrum is not produced by shifting electron density, it is simply a deconstruction of coincident photoemission peaks (i.e. the coincident [NTf2]− –CF3 and [C8Py-4-(CF3)]+ –CF3 signals). Nevertheless, this result further highlights the power of difference spectra for determining exact B.E. values and shows the process in not limited to C 1s core photoemissions.
4.2 Significance of the data
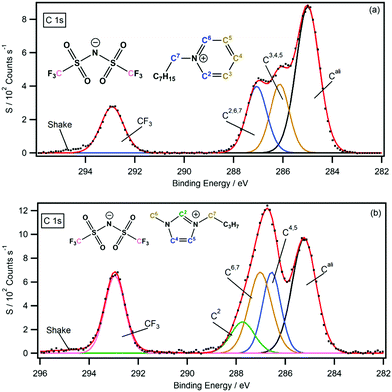
For the non-functional pyridinium ILs, B.E.s provided by the difference spectra support previous peak assignments and strengthen the C 1s peak fitting model previously presented by our group (Fig. 8a).30 The symmetry of the pyridinium cation and the shape of their C 1s photoemission spectra make this assignment far easier than other cationic systems. In comparison, the EWG-functionalised pyridinium C 1s signals are not spread across a large B.E. range, and assignment of the coincident signals between 286–288 eV is far harder because of the lack of features (i.e. single peak maxima). Fortunately, the difference spectra for both function and non-functional pyridinium ILs provide accurate B.E. signals that can be used to build precise C 1s peak fitting models. Importantly, the information obtained from the analytical procedure can benefit both C 1s spectra under consideration. The fully fitted C 1s spectra for all pyridinium salts are presented in the ESI.†For the non-functional imidazolium ILs, the negative C4 peak position (286.5 eV) indicates the position of the signal before chlorine functionalisation. The C 1s B.E. shows that previous peak assignments are incorrect, and a new peak fitting model is required (see Fig. 8b). In this model, the C4 and C5 photoemissions appear at lower B.E.s than the C6 and C7 carbon photoemission signals, suggesting that most of the positive charge is spread about the NCN portion of the imidazolium ring and around the N–C carbons of the pendant alkyl chains. The back of the imidazolium ring (i.e. the C4 and C5 carbons) therefore has a higher electron density than previously thought (through XPS interpretations). Further investigations are currently underway to investigate whether this new observation is in fact related to electron density or is a result of final state effects. Regardless of the interpretation, the new data obtained from the difference spectra has led to a refinement in the C 1s fitting model. Furthermore, the accurate B.E.s of the chlorine functionalised imidazolium salts have been presented and fully peak fitted XP spectra are presented in the ESI.†
5 Conclusions
The difference spectra reported herein demonstrate that targeted functionalisation of ILs with EWGs such as chlorine and trifluoromethane can produce B.E.s shifts large enough to clearly show initial and final peak positions. The exact C2, C3, and C4 C 1s photoemission B.E.s of the functional and non-functional pyridinium ILs presented in this work have now been experimentally determined, along with the C4 C 1s photoemissions of the functional and non-functional imidazolium ILs. The obtained B.E. values have confirmed previous pyridinium C 1s peak fitting models and enabled refinement of the imidazolium peak fitting models. The accurate C 1s peak fittings of the functional pyridinium and imidazolium salts have been presented; without difference spectroscopy peak assignments would likely be incorrect due to the lack of defining features in each spectrum. Furthermore, quantification of the difference spectra supports previous shake-up/off losses of sp2 hybridised carbons by directly measuring the photoemission signals, as opposed to indirect measurement of the shake-up signal which is subject to data analysis error (e.g. choice of background).Overall, this work demonstrates that difference spectroscopy can significantly enhance XPS analysis, providing more reliable information than previously though possible. High quality XP spectra are required to produce high quality difference spectra. For this reason, and in combination with robust charge correction procedures, this work demonstrates that ILs are ideal small molecules for XPS difference spectroscopy.
Conflicts of interest
There are no conflicts to declare.Acknowledgements
CJC would like to thank Dr Kevin Lovelock for helpful advice and discussions. C. J. C. and P. L. thank EPSRC for support EP/D073014/1, EP/K005138/1.References
- K. Siegbahn, University of Uppsala, 1981.
- N. S. McIntyre, in Practical Surface Analysis in Auger and X-ray Photoelectron Spectroscopy, ed. D. Briggs and M. P. Seah, 1983 Search PubMed.
- C. S. Fadley, X-ray photoelectron spectroscopy: Progress and perspectives, J. Electron Spectrosc. Relat. Phenom., 2010, 178–179, 2–32 CrossRef CAS.
- N. Stojilovic, Why can’t we see hydrogen in X-ray photoelectron spectroscopy?, J. Chem. Educ., 2012, 89, 1331–1332 CrossRef CAS.
- D. R. Penn, Quantitative chemical analysis by ESCA, J. Electron Spectrosc. Relat. Phenom., 1976, 9, 29–40 CrossRef CAS.
- A. Paul Pijpers and R. J. Meier, Core level photoelectron spectroscopy for polymer and catalyst characterisation, Chem. Soc. Rev., 1999, 28, 233–238 RSC.
- H. Siegbahn and K. Siegbahn, ESCA applied to liquids, J. Electron Spectrosc. Relat. Phenom., 1973, 2, 319–325 CrossRef CAS.
- H. Siegbahn, Electron spectroscopy for chemical analysis of liquids and solutions, J. Phys. Chem., 1985, 89, 897–909 CrossRef CAS.
- K. Axis, Peak Fitting in XPS, Casa XPS, 2006, 1–29 Search PubMed.
- J. Walton, P. Wincott, N. Fairley and A. Carrick, Peak Fitting with CasaXPS: a Casa Pocket Book, Acolyte Science, Knutsford, 2010 Search PubMed.
- R. K. Blundell and P. Licence, Quaternary ammonium and phosphonium based ionic liquids: a comparison of common anions, Phys. Chem. Chem. Phys., 2014, 16, 15278–15288 RSC.
- D. S. Mitchell, PhD thesis, The University of Nottingham, 2014.
- A. R. Santos, R. K. Blundell and P. Licence, XPS of guanidinium ionic liquids: a comparison of charge distribution in nitrogenous cations, Phys. Chem. Chem. Phys., 2015, 17, 11839–11847 RSC.
- H. Estrade-Szwarckopf, XPS photoemission in carbonaceous materials: A “defect” peak beside the graphitic asymmetric peak, Carbon, 2004, 42, 1713–1721 CrossRef CAS.
- D. Briggs and N. Fairley, XPS of chemically modified low-density polyethylene surfaces: observations on curve-fitting the C 1s spectrum, Surf. Interface Anal., 2002, 33, 283–290 CrossRef CAS.
- G. Nansé, E. Papirer, P. Fioux, F. Mgguet and A. Trbssaud, Fluorination Of Carbon Blacks: An X-Ray Photoelectron Spectroscopy Study: I. A Literature Review Of Xps Studies Of Fluorinated Carbons. XPS Investigation Of Some Reference Compounds, Carbon, 1997, 35, 175–194 CrossRef.
- K. Artyushkova and J. E. Fulghum, Quantification of PVC-PMMA polymer blend compositions by XPS in the presence of x-ray degradation effects, Surf. Interface Anal., 2001, 31, 352–361 CrossRef CAS.
- E. F. Smith, I. J. V. Garcia, D. Briggs and P. Licence, Ionic liquids in vacuo; solution-phase X-ray photoelectron spectroscopy, Chem. Commun., 2005, 5633–5635 RSC.
- F. Maier, T. Cremer, C. Kolbeck, K. R. J. Lovelock, N. Paape, P. S. Schulz, P. Wasserscheid and H.-P. Steinrück, Insights into the surface composition and enrichment effects of ionic liquids and ionic liquid mixtures, Phys. Chem. Chem. Phys., 2010, 12, 1905–1915 RSC.
- M. Currie, J. Estager, P. Licence, S. Men, P. Nockemann, K. R. Seddon, M. Swadźba-Kwaśny and C. Terrade, Chlorostannate(II) ionic liquids: Speciation, lewis acidity, and oxidative stability, Inorg. Chem., 2013, 52, 1710–1721 CrossRef CAS PubMed.
- A. W. Taylor, S. Men, C. J. Clarke and P. Licence, Acidity and basicity of halometallate-based ionic liquids from X-ray photoelectron spectroscopy, RSC Adv., 2013, 3, 9436 RSC.
- T. Cremer, C. Kolbeck, K. R. J. Lovelock, N. Paape, R. Wolfel, P. S. Schulz, P. Wasserscheid, H. Weber, J. Thar, B. Kirchner, F. Maier and H. P. Steinruck, Towards a Molecular Understanding of Cation-Anion Interactions-Probing the Electronic Structure of Imidazolium Ionic Liquids by NMR Spectroscopy, X-ray Photoelectron Spectroscopy and Theoretical Calculations, Chem. – Eur. J., 2010, 16, 9018–9033 CrossRef CAS PubMed.
- V. Lockett, R. Sedev, S. Harmer, J. Ralston, M. Horne and T. Rodopoulos, Orientation and mutual location of ions at the surface of ionic liquids, Phys. Chem. Chem. Phys., 2010, 12, 13816–13827 RSC.
- K. R. J. Lovelock, I. J. Villar-Garcia, F. Maier, H. P. Steinrück and P. Licence, Photoelectron spectroscopy of ionic liquid-based interfaces, Chem. Rev., 2010, 110, 5158–5190 CrossRef CAS.
- C. Kolbeck, I. Niedermaier and A. Deyko, K. R. J. Lovelock, N. Taccardi, W. Wei, P. Wasserscheid, F. Maier and H. P. Steinrück, Influence of substituents and functional groups on the surface composition of ionic liquids, Chem. – Eur. J., 2014, 20, 3954–3965 CrossRef CAS PubMed.
- C. Kolbeck, T. Cremer, K. R. J. Lovelock, N. Paape, P. S. Schulz, P. Wasserscheid, F. Maier and H. P. Steinrück, Influence of different anions on the surface composition of ionic liquids studied using ARXPS, J. Phys. Chem. B, 2009, 113, 8682–8688 CrossRef CAS PubMed.
- I. J. Villar-Garcia, E. F. Smith, A. W. Taylor, F. Qiu, K. R. J. Lovelock, R. G. Jones and P. Licence, Charging of ionic liquid surfaces under X-ray irradiation: the measurement of absolute binding energies by XPS, Phys. Chem. Chem. Phys., 2011, 13, 2797–2808 RSC.
- A. W. Taylor and P. Licence, X-Ray Photoelectron Spectroscopy of Ferrocenyl- and Ferrocenium-Based Ionic Liquids, ChemPhysChem, 2012, 13, 1917–1926 CrossRef CAS.
- T. Hammer, M. Reichelt and H. Morgner, Influence of the aliphatic chain length of imidazolium based ionic liquids on the surface structure, Phys. Chem. Chem. Phys., 2010, 12, 11070–11080 RSC.
- S. Men, D. S. Mitchell, K. R. J. Lovelock and P. Licence, X-ray Photoelectron Spectroscopy of Pyridinium-Based Ionic Liquids: Comparison to Imidazolium- and Pyrrolidinium-Based Analogues, ChemPhysChem, 2015, 16, 2211 CrossRef CAS PubMed.
- B. B. Hurisso, K. R. J. Lovelock and P. Licence, Amino acid-based ionic liquids: using XPS to probe the electronic environment via binding energies, Phys. Chem. Chem. Phys., 2011, 13, 17737–17748 RSC.
- R. M. Fogarty, R. Rowe, R. P. Matthews, M. T. Clough, C. R. Ashworth, A. Brandt, P. J. Corbett, R. G. Palgrave, E. F. Smith, R. A. Bourne, T. W. Chamberlain, P. B. J. Thompson, P. A. Hunt and K. R. J. Lovelock, Atomic charges of sulfur in ionic liquids: experiments and calculations, Faraday Discuss., 2018, 206, 183–201 RSC.
- S. Caporali, U. Bardi and A. Lavacchi, X-ray photoelectron spectroscopy and low energy ion scattering studies on 1-buthyl-3-methyl-imidazolium bis(trifluoromethane) sulfonimide, J. Electron Spectrosc. Relat. Phenom., 2006, 151, 4–8 CrossRef CAS.
- R. Hesse, T. Chassé, P. Streubel and R. Szargan, Error estimation in peak-shape analysis of XPS core-level spectra using UNIFIT 2003: how significant are the results of peak fits?, Surf. Interface Anal., 2004, 36, 1373–1383 CrossRef CAS.
- J. M. Conny and C. J. Powell, Standard test data for estimating peak parameter errors in x-ray photoelectron spectroscopy III. Errors with different curve-fitting approaches, Surf. Interface Anal., 2000, 29, 856–872 CrossRef CAS.
- B. Singh, A. Diwan, V. Jain, A. Herrera-Gomez, J. Terry and M. R. Linford, Uniqueness plots: A simple graphical tool for identifying poor peak fits in X-ray photoelectron spectroscopy, Appl. Surf. Sci., 2016, 387, 155–162 CrossRef CAS.
- R. M. Fogarty, R. P. Matthews, C. R. Ashworth, A. Brandt-Talbot, R. G. Palgrave, R. A. Bourne, T. Vander Hoogerstraete, P. A. Hunt and K. R. J. Lovelock, Experimental validation of calculated atomic charges in ionic liquids, J. Chem. Phys., 2018, 148, 193817 CrossRef.
- C. J. Clarke, W.-C. Tu, O. Levers, A. Bröhl and J. P. Hallett, Green and Sustainable Solvents in Chemical Processes, Chem. Rev., 2018, 118, 747–800 CrossRef CAS PubMed.
- I. Niedermaier, M. Bahlmann, C. Papp, C. Kolbeck, W. Wei, S. Krick Calderón, M. Grabau, P. S. Schulz, P. Wasserscheid, H. P. Steinrück and F. Maier, Carbon dioxide capture by an amine functionalized ionic liquid: Fundamental differences of surface and bulk behavior, J. Am. Chem. Soc., 2014, 136, 436–441 CrossRef CAS.
- T. Matsuda, N. Taccardi, J. Schwegler, P. Wasserscheid, H.-P. Steinrück and F. Maier, Vacuum Surface Science Meets Heterogeneous Catalysis: Dehydrogenation of a Liquid Organic Hydrogen Carrier in the Liquid State, ChemPhysChem, 2015, 16, 1873–1879 CrossRef CAS.
- C. Kolbeck, I. Niedermaier, N. Taccardi, P. S. Schulz, F. Maier, P. Wasserscheid and H.-P. Steinrück, Monitoring of Liquid-Phase Organic Reactions by Photoelectron Spectroscopy, Angew. Chem., Int. Ed., 2012, 51, 2610–2613 CrossRef CAS PubMed.
- B. May, M. Hönle, B. Heller, F. Greco, R. Bhuin, H.-P. Steinrück and F. Maier, Surface-Induced Changes in the Thermochromic Transformation of an Ionic Liquid Cobalt Thiocyanate Complex, J. Phys. Chem. Lett., 2017, 8, 1137–1141 CrossRef CAS PubMed.
- F. Maier, I. Niedermaier and H.-P. Steinrück, Perspective: Chemical reactions in ionic liquids monitored through the gas (vacuum)/liquid interface, J. Chem. Phys., 2017, 146, 170901 CrossRef CAS PubMed.
- R. R. Hawker, J. Panchompoo, L. Aldous and J. B. Harper, Novel Chloroimidazolium-Based Ionic Liquids: Synthesis, Characterisation and Behaviour as Solvents to Control Reaction Outcome, Chempluschem, 2016, 81, 574–583 Search PubMed.
Footnotes |
| † Electronic supplementary information (ESI) available. See DOI: 10.1039/c8cp06701e |
| ‡ Current address: Department of Chemical Engineering, Imperial College London, London, UK. |
| This journal is © the Owner Societies 2019 |


