Simple and accurate isochoric differential scanning calorimetry measurements: phase transitions for pure fluids and mixtures in nanopores
Xingdong
Qiu
 a,
Sugata P.
Tan
 b,
Morteza
Dejam
 a and
Hertanto
Adidharma
 *a
*a
aDepartment of Petroleum Engineering, College of Engineering and Applied Science, University of Wyoming, 1000 E. University Ave., Laramie, WY 82071-2000, USA. E-mail: adidharm@uwyo.edu
bPlanetary Science Institute, Tucson, AZ 85719-2395, USA
First published on 21st November 2018
Abstract
Various types of nanopores are encountered in many different engineering and science applications. Due to incomplete understanding of the phase behavior of fluids in nanosize confined space, the improvement of such applications has been largely based on experience and empirical approaches. Therefore, experimental studies on the phase behavior of confined fluids that are simple but accurate are still urgently needed. We recently developed a new isochoric procedure using a Differential Scanning Calorimeter (DSC) to measure the onset of vapor–liquid phase transitions, which has been successfully used in experiments measuring the vapor pressures of pure substances and the dew points of a bulk mixture in the absence of nanopores [Qiu et al., Phys. Chem. Chem. Phys., 2018, 20, 26241–26248]. It is the purpose of this work to extend the new method to confined fluids. To demonstrate the superior ability of the new method, we measure the capillary condensation of CO2 and the dew points of a binary methane/ethane gas mixture confined in SBA-15 with different pore diameters.
1. Introduction
Different types of nanoporous media are encountered in many different practical applications, including catalysis,1 carbon dioxide sequestration,2 drug delivery,3 enhanced coalbed methane recovery,4 pollution control,5 and separation,6 as well as hydrocarbon production from shale and other tight formations.7 At the moment, due to an incomplete understanding of the phase behavior of fluids in nanosize confined space, the improvement of such applications has been largely based on experience and empirical approaches.To improve our understanding, in fact, the phase behavior of confined fluids has been investigated using simulations, theoretical methods, and experiments. As inferred from literature studies, simulations and theoretical studies have been performed quite extensively,8,9 and several equations of state have also been developed and used to analyze the phase behavior of confined fluids,10–13 but due to a serious lack of experimental data, it is hard for most of this work to be validated. To make things worse, due to urgent needs, scientists and engineers are compelled to provide mere predictions without experimental evidence.9
Most experimental studies on confined pure compounds that have been done are based on the adsorption–desorption experiments using different porous media.14–18 In addition to these experiments, other experimental methods have also been used, for example, neutron scattering,19 small-angle X-ray scattering (SAXS),20 positron annihilation spectroscopy,21 micro/nanofluidic chip,22 and differential scanning calorimetry (DSC).23 Experiments for fluid mixtures in confined space, on the other hand, are done less often due to their more complex nature. Consequently, several important features such as the dew points and critical points of confined fluid mixtures have hardly or even never been experimentally explored at all, the fact of which makes the fundamental understanding of such systems far from complete.
There have been a few studies to date that dealt with the measurement of phase transition for mixtures in nanopores. Recently, Cho et al.24 and Liu et al.25 applied the conventional P/V isotherm using a PVT cell to locate the bubble points of confined binary mixtures: n-decane/methane and n-octane/methane in SBA-15 and SBA-16 for the former, and nitrogen/n-butane for the latter. Though both research groups applied similar methods, with some different details, they reached opposite conclusions. Compared to the bubble point in the bulk, the confined bubble point was found at lower pressures by Cho et al. but higher pressures by Liu et al. Adsorption experiments have also been done as early as that by Yun et al.5 using an open-flow apparatus at constant pressures and compositions for the adsorption and capillary condensation of methane/ethane in MCM-41. More recently, using gravimetric adsorption–desorption experiments, Barsotti et al.26 investigated the capillary condensation of binary and ternary mixtures of CO2, n-pentane, and isopentane in MCM-41.
For other methods, Goh et al. investigated the phase separation of binary n-hexane/perfluorohexane in nanoporous glass using light scattering,27 while Valiullin and Furó used nuclear magnetic resonance (NMR) to investigate the phase separation of hexane/nitrobenzene also in nanoporous glasses.28 Alam et al. isobarically measured the capillary condensation of binary argon/nitrogen in 4 nm Vycor glass using positron annihilation spectroscopy at various compositions.29 Recently, Luo et al. studied the phase behavior of hydrocarbon mixtures in nanopores at atmospheric pressure using isobaric DSC measurements.30 However, in the isobaric procedure using DSC, i.e., an extension of ASTM E1782 (Standard Test Method for Determining Vapor Pressure by Thermal Analysis), the vaporization and escape of sample through a pinhole in the lid of the sample pan change the mixture composition before reaching the bubble point of the fluids in the pore. This method obviously will not work if the mixture contains very volatile components and it would be hard, if not impossible, to accurately measure the phase transition of mixtures at high pressures due to the dissolution of the inert gas used. Furthermore, it also suffers from difficulties in determining several measurement parameters, i.e., the size of the test sample and the size of the pinhole, both of which should also be optimized together with the scanning rate.
In summary, experimental studies on the phase behavior of confined fluids that are simple and accurate are still urgently needed. We recently developed a new simple isochoric procedure using a Differential Scanning Calorimeter (DSC) to measure the onset of vapor–liquid phase transitions, which has been successfully used in experiments measuring the vapor pressures of pure substances and the dew points of a bulk mixture in the absence of nanopores.31 It is the purpose of this work to extend the new method to confined fluids. To demonstrate the superior ability of the new method, we measure the capillary condensation of CO2 and the dew points of a binary methane/ethane (CH4/C2H6) gas mixture confined in SBA-15 with different pore diameters.
The article is organized as follows. First, Materials and the experimental procedure, including Characterization of SBA-15 and Capillary condensation measurements, are explained. Thereafter, results for the Capillary condensation measurements of carbon dioxide and Dew-point measurements of a gas mixture (CH4/C2H6), both in SBA-15, are discussed. Finally, our Conclusions and remarks are presented.
2. Materials and experimental procedure
In this work, SBA-15 mesoporous silicas with three different pore diameters are purchased from Sigma Aldrich (referred to as samples S1 and S2) and Advanced Chemicals Supplier (referred to as sample S3), and used without further treatment. The CO2 gas is UHP grade with a purity greater than 99.97%, purchased from United States Welding, Inc. The UHP-grade gas mixture of CH4 and C2H6 is purchased from Airgas and Air Liquide, with a mole percentage of 15 ± 0.3% CH4 and 85 ∓ 0.3% C2H6. For pore characterization purposes, the UHP-grade nitrogen gas is purchased from United States Welding, Inc., with a purity greater than 99.9%.2.1. Characterization of SBA-15
SBA-15 mesoporous silicas with different pore diameters are characterized using BET (Brunauer, Emmett and Teller) analysis. The surface properties of the adsorbents are obtained using an automated surface area and pore size analyzer (QUADRASORB evo, Quantachrome Instruments). To ensure the reliability and repeatability of the BET test, a sample preparation procedure before the analysis is implemented and described as follows. Firstly, a sample mass is measured using an analytical balance (TE214S, Sartorius). Generally, the amount of sample should be sufficient for the subsequent analysis and according to the operating manual provided by Quantachrome Instruments, a total area of at least 2–50 m2 is recommended. In this work, ca. 100 mg of SBA-15 is used. Then, the sample is degassed under vacuum conditions (till 2 × 10⁻² Torr) while being heated to 200 °C for 5 hours using a sample preparation unit (FloVac Degasser, Quantachrome Instruments) to remove (desorb) the moisture and other volatile contaminants that would otherwise interfere with the analysis. After preparation, the sample is cooled to a cryogenic temperature of 77.35 K, and exposed to nitrogen gas.Fig. 1(a) shows the nitrogen adsorption–desorption isotherms of three different SBA-15 samples. The isotherm is recorded as the volume of gas adsorbed versus relative pressure (P/P0), which is the ratio of the gas pressure to its saturation pressure. These isotherms are of type IV adsorption isotherm with a H1-type hysteresis loop typical of mesoporous materials with uniform pore structure (i.e., cylindrical channels in a hexagonal arrangement). Since each isotherm has a well-defined plateau at high P/P0, it is possible to obtain an unambiguous assessment of the mesopore total volume.32 The total pore volume is calculated as the amount (volume) of nitrogen adsorbed at a relative pressure of ca. 0.99. As seen in Fig. 1(a), the total pore volume of S3 is much higher than those of S1 and S2. The BET specific surface areas of SBA-15 samples are obtained from the adsorption isotherms in the relative pressure range of 0.1–0.2.
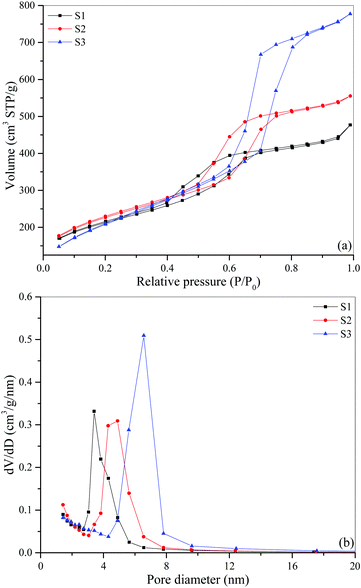 | ||
| Fig. 1 (a) Nitrogen adsorption–desorption isotherms of three different SBA-15 samples, (b) BJH desorption pore size distributions of three different SBA-15 samples. | ||
The pore size distribution is determined from the desorption branch of the isotherm using the BJH (Barrett–Joyner–Halenda) method. The steepness of each of the isotherms in the pore-filling step indicates distinct degrees of mesopore uniformity (broad or narrow pore size distribution), which is consistent with the BJH pore size distribution plot in Fig. 1(b). As shown in Fig. 1(b), all samples also have micropores, i.e., pores with size smaller than about 2 nm, as we expect SBA-15 to have. Since the capillary condensation in SBA-15 occurs mainly in mesopores,4,33,34 the BJH pore diameter (DBJH) reported in this work corresponds to the peak of the BJH pore size distribution of the mesopores. Table 1 summarizes the characterization results. As indicated in the IUPAC technical report,35 however, the pore size evaluated by the BJH method generally underestimates the actual pore size about 20–30%. The discrepancy in pore sizes estimated using different methods is not of our concern here, because we are only interested in the order of sizes, which is S1 < S2 < S3 in our case. It is well known that smaller mesopore size provides larger changes in the phase transition of the confined fluids, the fact of which will be confirmed later in our results. More exact pore size should be obtained using an advanced approach such as Non-Local Density Functional Theory (NLDFT) as recommended by IUPAC.35
| Sample | S BET/m2 g−1 | V total/cm3 g−1 | D BJH/nm |
|---|---|---|---|
| Note: SBET, multipoint BET surface area; Vtotal, total pore volume; DBJH, pore diameter, obtained from the BJH method desorption branch. | |||
| S1 | 746.7 | 0.738 | 3.408 |
| S2 | 803.1 | 0.859 | 4.892 |
| S3 | 772.6 | 1.202 | 6.563 |
2.2. Capillary condensation measurements
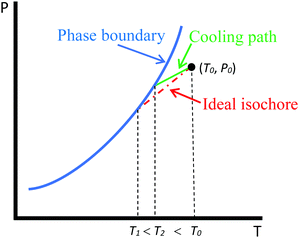
The capillary condensation of CO2 and the dew points of a gas mixture (methane/ethane) in SBA-15 mesoporous silicas with different pore diameters are measured using an isochoric DSC cooling procedure introduced in our previous work.31 The test principles, procedure, and apparatus needed can be found in the paper. The only difference is that for tests containing adsorbent, a certain amount of SBA-15 is first introduced into the test vessel using a small spatula. The adsorbent used in our test is kept in a drying oven at 120 °C for at least 24 hours before the test.As noted in our previous work,31 the cooling paths of our DSC procedure in the one-phase region are in general different from the ideal isochores due to the non-uniformity of temperature outside the test vessel. Fig. 2 shows a generic P–T diagram for a bulk fluid depicting the cooling path of the DSC measurement compared to the ideal isochore. With the current setup of apparatus, the uniform density in the test system that is initially achieved at (T0, P0) cannot be maintained after the cooling process starts. The lower temperature in the test vessel causes the non-uniformity within the system, with denser vapor in the vessel. This in turn makes the cooling path in the P–T diagram deviate from the ideal isochore and shift to higher densities following the local condition in the test vessel. As the vessel contains vapor with a higher density than that at the initial condition, the condensation occurs earlier at a higher temperature T2 as indicated in Fig. 2. If the temperature was uniform throughout the system, the condensation should have occurred at T1 on the ideal isochore. Nonetheless, this is not an issue for this method as far as the measurement of phase transition is concerned, as shown in our previous work31 and later in this work.
3. Results and discussion
3.1. Capillary condensation measurements of carbon dioxide in SBA-15
The capillary condensation of CO2 in SBA-15 samples is measured using the isochoric dew-point measurement.31Fig. 3 shows a typical thermogram of such a measurement, which clearly displays a small exothermic peak due to the phase transition occurring in the pores and a larger exothermic peak due to the bulk condensation. Before the phase transition occurs in the pores, the pressure of the test vessel decreases gradually because of the decreasing temperature in the closed system. When condensation occurs within the pores, heat is released from the test sample, leading to a small exothermic peak in the heat flow curve, and the pressure of the system decreases more quickly to a lower level. As the cooling process continues, again, the pressure decreases gradually due to the decreasing temperature in the system. When the bulk condensation eventually starts to occur, the pressure again decreases faster and at the same time a larger amount of heat is released, leading to a sharp increase of the heat flow curve. Note that in a single run, the isochoric DSC procedure is able to measure both capillary and bulk condensation. Along a cooling path, the phase transition of confined fluids in nanopores is encountered first before that of the bulk fluid.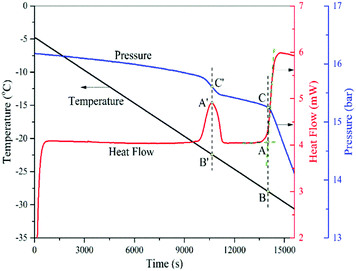 | ||
| Fig. 3 A typical thermogram of the measurement of capillary condensation in SBA-15 and bulk condensation of CO2. | ||
As usual, the onset of the bulk phase transition is determined from the intersection point between the baseline and the tangent line of the rising part (the almost linear part) of the exothermic peak (point A). Drawing a vertical line through point A gives us the corresponding temperature (point B) and pressure (point C), which are the condensation temperature and vapor pressure, respectively. It is not surprising that point C is the pressure at which the slope of the pressure curve changes abruptly.
On the other hand, for capillary condensation, unlike the determination of the bulk phase transition, we do not take the intersection point between the heat flow baseline and the tangent line of the rising part of the peak to define the capillary condensation because such an intersection point gives us the conditions of condensation that occurs in the smallest mesopores only, not the entire mesopores that have an effective diameter corresponding to the peak of pore size distribution, i.e., DBJH. Therefore, instead we take the vertical dashed line that passes through the maximum of the thermogram peak A′ to give us the temperature (point B′) and pressure (point C′) of the condensation. For the record, the maximum of this thermogram peak occurs simultaneously with the largest time rate of change of the system pressure during the capillary condensation, which indicates that with the amount of adsorbent and cooling rate used, there is no apparent time lag between the heat flow and pressure measurements.
As described in our previous work,31 in the DSC measurements of bulk-phase boundaries, a slow scanning rate is needed so that the system can be assumed at equilibrium throughout the process, and thus the recorded pressures corresponding to the controlled temperatures represent the equilibrium pressures. In that work, we used a scanning rate of 0.03 °C min−1, although we also indicated that a scanning rate of up to 0.1 °C min−1 would still be satisfactory for bulk-phase measurements.
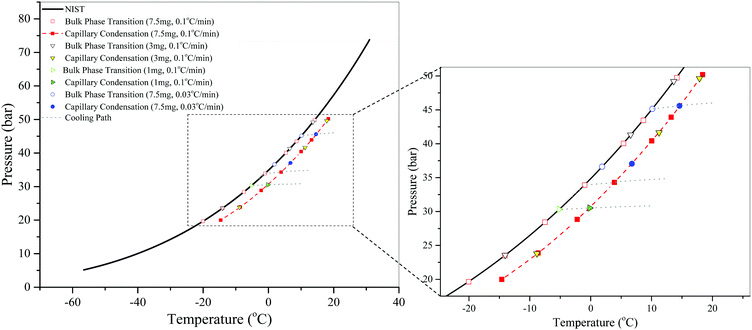
Here, we also cautiously investigate the effect of scanning rate on measurements in the presence of the adsorbent. Measurements with S3 using two different cooling rates are shown in Fig. 4. We find that using these cooling rates, the measured vapor pressures of bulk CO2 are in agreement with the NIST data and the measured conditions for capillary condensation are consistent and fall on the same curve. It turns out that a lower scanning rate does not improve the accuracy of the measurements. Note that the ability of the procedure to measure the bulk phase transition provides us with a robust way of verifying the accuracy of the measurements. Therefore, for faster measurements, the higher scanning rate of 0.1 °C min−1 is used to generate the data for all SBA-15 samples.
Meanwhile, as shown in Fig. 4, the amount of adsorbent used in these measurements does not have any effect on the capillary condensation, which is not true for confined mixtures as discussed later.
Fig. 5 shows the results of the isochoric DSC measurements of the capillary condensation in SBA-15 samples and bulk condensation of CO2, which also demonstrates that the phase transition in the pores occurs at a higher temperature than that in the bulk on a cooling path, as expected. In other words, the phase transition boundary of the fluid in the nanopores is below that of the bulk fluid on the phase diagram. Again, it should also be noted that the bulk vapor pressures obtained using the isochoric dew-point measurements are in an excellent agreement with the NIST data. These results also confirm that the phase transition curve of fluids confined in a smaller pore is below that in a larger pore on the phase diagram. For comparison, the results of Morishige et al.15 and Barsotti et al.26 using MCM-41 are included in Fig. 5. The capillary condensation in SBA-15 is quite different from that of MCM-41, the fact of which could be attributed to the existence of micropores in SBA-15.
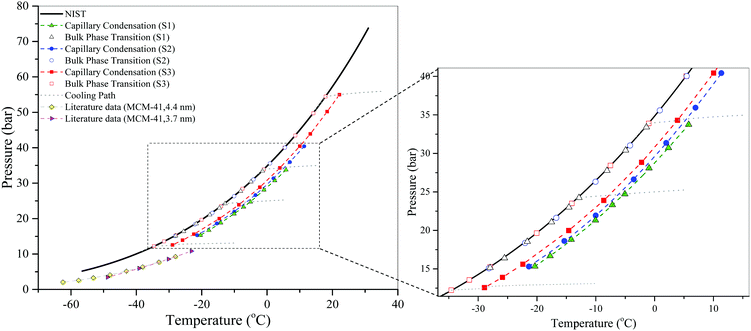 | ||
| Fig. 5 Isochoric DSC measurements of the capillary condensation in SBA-15 and bulk condensation of CO2. Literature data of the capillary condensation of CO2 in MCM-41 (4.4 nm and 3.7 nm) are taken from Morishige et al.15 and Barsotti et al.,26 respectively. The dashed lines are just a guide to the eye. The cooling paths are shown only for some measurements for clarity. | ||
3.2. Dew-point measurements of a gas mixture (CH4/C2H6) in SBA-15
In the experimental investigation of the phase transition of a mixture in nanopores, one obvious difficulty is that we cannot measure the real composition of the mixture in the pores. Therefore, it becomes a common practice to report the conditions of confined phase transition based on the composition of the bulk mixture surrounding the pores, which is measureable. Thus, the dew point of the confined mixture here is defined as the onset of phase transition in the pores at a fixed composition of the surrounding bulk gas mixture.The same isochoric procedure as that for pure fluids is applied to measure the dew points of a CH4/C2H6 gas mixture in nanopores at a bulk composition of 15 ± 0.3% CH4/85 ∓ 0.3% C2H6. Fig. 6 shows a typical thermogram for such a measurement. The thermogram analysis of this dew-point measurement is also the same as that of the capillary condensation measurement of CO2.
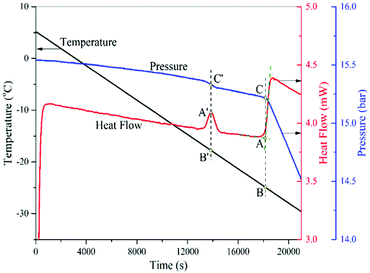 | ||
| Fig. 6 A typical thermogram of the capillary condensation in SBA-15 and bulk condensation of a gas mixture (CH4/C2H6). | ||
It is well known that the presence of nanopores may alter the bulk gas composition by selective adsorption. Consequently, the measured phase transition in the pores would not represent that of the confined mixture surrounded by a bulk having the initial composition. Since the bulk composition is not monitored in our experiments, we further require that the bulk composition change is also negligible during and after the capillary condensation, so that the subsequent bulk condensation that occurs upon further cooling can be compared with that of the bulk without the adsorbent. A match between them provides evidence that the bulk composition is effectively unchanged. One way to minimize the alteration of the bulk composition is to employ a small amount of the adsorbent.
The suitable amount of adsorbent is system-specific, thus varies for different fluids and adsorbents. If a relatively large amount of adsorbent is used, the thermogram peak at the dew point of the gas mixture in the pores will be obviously higher, and thus easy to identify, but the bulk gas composition will significantly change due to the selective adsorption in the pores during the cooling process. On the other hand, if a smaller amount of adsorbent is used, the change in the bulk gas composition is negligible, but the thermogram peak might not be detectable. Therefore, a compromise is needed, i.e., an optimum amount that can introduce both the detectable thermogram peak and negligible change in bulk composition.
Fig. 7 shows the effect of the amount of S3 used on the measured dew points of the confined and bulk mixtures. Even an adsorbent amount as little as 2.5 mg changes the bulk gas composition appreciably. The presence of nanopores shifts the measured bulk dew points to lower temperatures because ethane is preferentially adsorbed during the process, and the measured dew points of the confined mixtures do not represent those surrounded by the 15 ± 0.3% CH4/85 ∓ 0.3% C2H6 bulk gas mixture. With 1.3 mg of adsorbent, on the other hand, even after capillary condensation, the change in the bulk gas composition is not noticeable, i.e., the original bulk dew points can still be reproduced. Therefore, we use 1.3 mg of adsorbent to generate accurate data for S3. In a similar manner, accurate data are generated by using adsorbent amounts of 2.2 and 2.0 mg for S1 and S2, respectively.
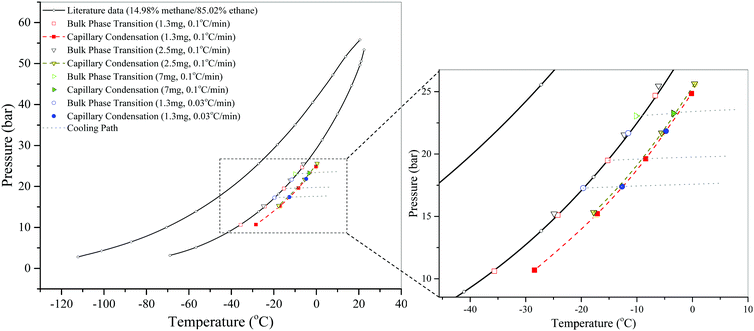 | ||
| Fig. 7 The effects of scanning rate and the amount of adsorbent used on the DSC measurements of dew points of a CH4/C2H6 gas mixture in SBA-15 (S3) at a bulk composition of 15 ± 0.3% CH4/85 ∓ 0.3% C2H6. Literature data of bulk bubble and dew points are taken from Bloomer et al.36 The dashed lines are just a guide to the eye. The cooling paths are shown only for some measurements for clarity. | ||
Fig. 7 also shows the effects of scanning rate on the DSC measurements of dew points of the CH4/C2H6 gas mixture in 1.3 mg of S3 at a bulk composition of 15 ± 0.3% CH4/85 ∓ 0.3% C2H6. We find that the measured bulk dew points using two different scanning rates fall on the dew-point curve obtained from the literature.36 Similar to capillary condensation measurements of CO2, a lower scanning rate than 0.1 °C min−1 does not improve the accuracy of the measurements of this system, and thus, a higher scanning rate of 0.1 °C min−1 is used to generate the data for measurements with any SBA-15 sample.
Fig. 8 shows the results of the dew-point measurements. We find that, similar to the capillary condensation of pure fluids, the dew-point curve of the fluid mixtures confined in nanopores is also below that of the surrounding bulk fluid, and the curve is even lower for smaller pores on the phase diagram.
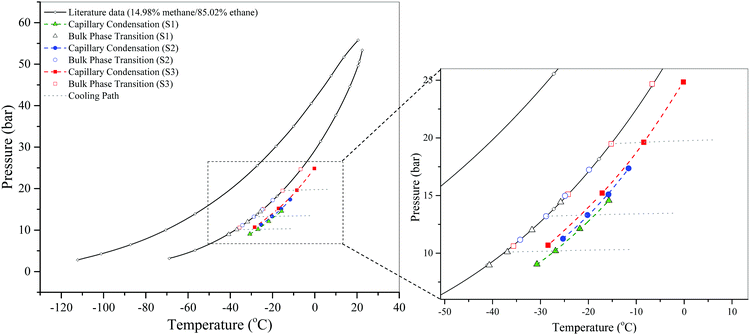 | ||
| Fig. 8 Isochoric DSC measurements of the dew points of a CH4/C2H6 gas mixture in SBA-15 at a bulk composition of 15 ± 0.3% CH4/85 ∓ 0.3% C2H6 and its corresponding bulk dew points. Literature data of bulk bubble and dew points are taken from Bloomer et al.36 The dashed lines are just a guide to the eye. The cooling paths are shown only for some measurements for clarity. | ||
4. Conclusions and remarks
The recently developed isochoric DSC procedure has been successfully extended to measure the phase transition of a pure fluid and a fluid mixture in nanopores. As in the case of bulk-phase transition,31 the procedure introduces simple and accurate measurements of CO2 capillary condensation and the dew points of a methane/ethane gas mixture in three different SBA-15 samples. The results of this work confirm that the phase transition boundaries of the fluids in nanopores are below those of the bulk fluids and that the boundaries of fluids in a smaller pore are below those in a larger pore on the phase diagram.For all measurements, we find that a scanning rate of 0.1 °C min−1 is sufficiently low to ensure equilibrium conditions during the cooling process. A lower scanning rate does not improve the accuracy of the measurements. In the measurements of dew points of the fluid mixtures in the pores, the change in the bulk gas composition due to selective adsorption and capillary condensation can be mitigated using a suitable amount of adsorbent that varies for different fluids and adsorbents. For measurements of dew points of a CH4/C2H6 gas mixture in S1, S2, and S3 at a bulk composition of 15 ± 0.3% CH4/85 ∓ 0.3% C2H6, accurate data can be obtained by using 2.2, 2.0, and 1.3 mg, respectively.
The unique ability of the procedure to measure the bulk phase transition simultaneously with that of the confined fluids provides us with a robust way of verifying the accuracy of the measurements, which in turn allows us to determine the proper scanning rate and the effective amount of adsorbent to be used in the experiments. Since we can accurately measure the phase transition of fluids in nanopores, as the next step of our work, we are experimentally measuring other features, such as the critical points of confined fluids in nanopores, and will present them in subsequent publications. The procedure applied in this work is part of a provisional US patent application recently filed.37
Conflicts of interest
There are no conflicts to declare.Acknowledgements
Morteza Dejam is gratefully appreciative of the financial support from the Department of Petroleum Engineering in the College of Engineering and Applied Science at the University of Wyoming.References
- G. Ye, X. Zhou, W. Yuan and M.-O. Coppens, AIChE J., 2016, 62, 451–460 CrossRef CAS.
- Y. Belmabkhout, R. Serna-Guerrero and A. Sayari, Chem. Eng. Sci., 2009, 64, 3721–3728 CrossRef CAS.
- M. Thommes and K. A. Cychosz, Adsorption, 2014, 20, 233–250 CrossRef CAS.
- G. Y. Gor, O. Paris, J. Prass, P. A. Russo, M. M. L. Ribeiro Carrott and A. V. Neimark, Langmuir, 2013, 29, 8601–8608 CrossRef CAS PubMed.
- J. Yun, T. Düren, F. J. Keil and N. A. Seaton, Langmuir, 2002, 18, 2693–2701 CrossRef CAS.
- W. G. Shim, J. W. Lee and H. Moon, Sep. Sci. Technol., 2006, 41, 3693–3719 CrossRef CAS.
- T. W. Teklu, N. Alharthy, H. Kazemi, X. Yin, R. M. Graves and A. M. AlSumaiti, SPE Reservoir Eval. Eng., 2014, 17, 1–8 Search PubMed.
- L. D. Gelb, K. E. Gubbins, R. Radhakrishnan and M. Sliwinska-Bartkowiak, Rep. Prog. Phys., 1999, 62, 1573–1659 CrossRef CAS.
- E. Barsotti, S. P. Tan, S. Saraji, M. Piri and J.-H. Chen, Fuel, 2016, 184, 344–361 CrossRef CAS.
- L. Travalloni, M. Castier, F. W. Tavares and S. I. Sandler, Chem. Eng. Sci., 2010, 65, 3088–3099 CrossRef CAS.
- B. Nojabaei, R. T. Johns and L. Chu, SPE Reservoir Eval. Eng., 2013, 16, 281–289 CrossRef CAS.
- S. P. Tan and M. Piri, Fluid Phase Equilib., 2015, 393, 48–63 CrossRef CAS.
- D. R. Sandoval, W. Yan, M. L. Michelsen and E. H. Stenby, Energy Fuels, 2018, 32, 2819–2833 CrossRef CAS.
- C. G. V. Burgess, D. H. Everett and S. Nuttall, Pure Appl. Chem., 1989, 61, 1845–1852 CAS.
- K. Morishige, H. Fujii, M. Uga and D. Kinukawa, Langmuir, 1997, 13, 3494–3498 CrossRef CAS.
- K. Morishige and M. Shikimi, J. Chem. Phys., 1998, 108, 7821–7824 CrossRef CAS.
- P. A. Russo, M. M. L. R. Carrott and P. J. M. Carrott, New J. Chem., 2011, 35, 407–416 RSC.
- K. Morishige, T. Kawai and S. Kittaka, J. Phys. Chem. C, 2014, 118, 4664–4669 CrossRef CAS.
- N. Floquet, J. P. Coulomb, P. L. Llewellyn, G. André, R. Kahn and D. Recherche, Stud. Surf. Sci. Catal., 2007, 160, 71–78 CrossRef CAS.
- M. Erko, D. Wallacher, G. H. Findenegg and O. Paris, J. Phys.: Condens. Matter, 2012, 24, 284112 CrossRef CAS.
- D. G. Jones and H. M. Fretwell, J. Phys.: Condens. Matter, 2003, 15, 4709–4715 CrossRef CAS.
- B. Bao, J. Riordon, F. Mostowfi and D. Sinton, Lab Chip, 2017, 17, 2740–2759 RSC.
- S. Luo, H. Nasrabadi and J. L. Lutkenhaus, AIChE J., 2016, 62, 1772–1780 CrossRef CAS.
- H. Cho, M. H. Bartl and M. Deo, Energy & Fuels, 2017, 31, 3436–3444 CrossRef CAS.
- Y. Liu, H. A. Li and R. Okuno, J. Pet. Sci. Eng., 2018, 160, 442–451 CrossRef CAS.
- E. Barsotti, S. Saraji, S. P. Tan and M. Piri, Langmuir, 2018, 34, 1967–1980 CrossRef CAS.
- M. C. Goh, W. I. Goldburg and C. M. Knobler, Phys. Rev. Lett., 1987, 58, 1008–1011 CrossRef CAS PubMed.
- R. Valiullin and I. Furó, J. Chem. Phys., 2003, 116, 1072–1076 CrossRef.
- M. A. Alam, A. P. Clarke and J. A. Duffy, Langmuir, 2000, 16, 7551–7553 CrossRef CAS.
- S. Luo, J. L. Lutkenhaus and H. Nasrabadi, J. Pet. Sci. Eng., 2018, 163, 731–738 CrossRef CAS.
- X. Qiu, S. P. Tan, M. Dejam and H. Adidharma, Phys. Chem. Chem. Phys., 2018, 20, 26241–26248 RSC.
- F. Rouquerol, J. Rouquerol and K. Sing, Adsorption by Powders & Porous Solids, Academic Press, London, 1999 Search PubMed.
- S. T. Moerz, K. Knorr and P. Huber, Phys. Rev. B: Condens. Matter Mater. Phys., 2012, 85, 075403 CrossRef.
- T. Hofmann, D. Wallacher, J. Perlich, S. K. Vayalil and P. Huber, Langmuir, 2015, 32, 2928–2936 CrossRef PubMed.
- M. Thommes, K. Kaneko, A. V. Neimark, J. P. Olivier, F. Rodriguez-Reinoso, J. Rouquerol and K. S. W. Sing, Pure Appl. Chem., 2015, 87, 1051–1069 CAS.
- O. T. Bloomer, D. C. Gami and J. D. Parent, Inst. Gas Technol., Chicago, Res. Bull., 1953, 22, 1–39 Search PubMed.
- H. Adidharma, S. P. Tan, M. Dejam and X. Qiu, Novel Isochoric Measurement of the Onset of Vapor-Liquid Phase Transition in Bulk and Nanopores Using Differential Scanning Calorimetry, US Pat., 62722476, 2018 Search PubMed.
| This journal is © the Owner Societies 2019 |

