Interfacial structure and electrochemical stability of electrolytes: methylene methanedisulfonate as an additive†
Yamin
Wang
 ,
Xiaoying
Yu
,
Yingchun
Liu
,
Xiaoying
Yu
,
Yingchun
Liu
 and
Qi
Wang
 *
*
Department of Chemistry, Zhejiang University, Hangzhou 310027, People's Republic of China. E-mail: qiwang@zju.edu.cn; Fax: +86 571 87951895
First published on 14th November 2018
Abstract
The mechanism responsible for widening the electrochemical stability window of methylene methanedisulfonate (MMDS)-containing electrolytes compared to conventional carbonate electrolytes is suggested based on molecular dynamics (MD) simulations and density functional theory (DFT) calculations. We find that MMDS has a stronger reduction ability and higher affinity for the electrode surface than solvents, and these behaviors provide an important condition for priority decomposition of the additive. The addition of MMDS could reduce the probability of finding solvent–ion complexes at the electrolyte–electrode interface, which is especially beneficial for the stability of the solvent electrochemical window. This knowledge of the local electrolyte composition and structure at the surface plays a significant role in advancing our understanding of the relationships between interface structure and battery cycling performance, and expanding the operating windows of electrochemical devices.
1 Introduction
Lithium ion batteries (LIBs) dominate energy storage for portable electronics and are penetrating automotive and grid-storage applications. Further progress depends not only on the development of new high capacity electrodes, but also on tailoring electrolytes (either to be thermodynamically stable with the electrodes or to form a stable passivation layer).1 Electrolyte stability with electrodes has been recognized as the key property dictating the success of next generation battery chemistry.1 The use of electrolyte functional additives is one of the most effective and economical methods for enhancing the capacity retention and the cycling performance of high voltage LIBs,2,3 which can not only decrease electrolyte decomposition at the cathode, but also affect transition metal dissolution and modify the solid electrolyte interphase (SEI, stable passivation layer) at the anode.4,5 Among the various electrolyte additives, MMDS as a functional additive singly or in combination with others has been proven to dramatically improve the electrochemical performance of high-voltage LIBs,4–7 in terms of their extremely high coulombic efficiency, excellent storage properties, low impedance and superior long term cycling in electrochemical experiments.8Ex situ analytical techniques (SEM, TEM, FTIR, etc.) have demonstrated that MMDS would help to form a stable passivation film, which would overcome the capacity fading of the cathode at elevated temperature, and effectively suppress the decomposition of the electrolyte solvents.4,9 Interestingly, the redox stability of electrolytes can be related, at least in part, to the electric double layer (EDL) structure of electrolytes at the electrode surfaces where the redox processes take place.10 However, little is known about the EDL structure of MMDS-containing electrolytes, which forms the motivation for the work presented in this manuscript.In this work, density functional theory (DFT) calculations and molecular dynamics (MD) simulations were used to probe the impact of MMDS on electrolytes, including an investigation of the influence of the electrode potential on the electrolyte–electrode interface. Given the complications present in the experimental characterization techniques, it was anticipated that the close synergy between atomistic computational modelling and experiments could play a significant role in advancing our understanding of the relationships between the interface structure and battery cycling performance.11
2 Computational details
2.1 Quantum chemistry calculations
The energy levels of the highest occupied molecular orbital (HOMO) and the lowest unoccupied molecular orbital (LUMO) of the solvent molecules were calculated using the Gaussian 03 programs package. Their structures were fully optimized using the B3LYP method at the 6-311+G(d,p) basis set.2.2 Molecular dynamics simulations
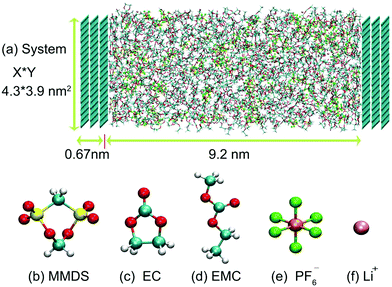
MD simulations were performed on the simulated cell consisting of electrolytes and electrodes. The compositions and image snapshots of the simulated cell are shown in Table 1 and Fig. 1, respectively. The electrolytes consist of ethylene carbonate:ethyl methyl carbonate (EC:EMC)/LiPF6 doped with MMDS or not, in which EC and EMC are base solvents and MMDS is an additive. This is one of the most commonly used formulations in lithium ion batteries.8,12 Three-layer graphite electrodes were fixed during the simulation. The distance between the electrodes was adjusted to yield the bulk electrolyte density in the middle of the simulation cell. The asymmetry direction of the system, that is the direction perpendicular to the electrode surface, is our chosen z-axis. The equilibration was performed for 5 ns, followed by application of potential and 30 ns production runs in a canonical ensemble at 300 K using the GROMACS 5.0 software package.13–15 The ensemble temperature was controlled using V-rescale16 at fixed time steps of 1 fs. Non-bonded interactions were truncated using a cutoff of 1.2 nm and electrostatic interactions were dealt with by employing the particle-mesh Ewald.17,18 To calculate the mixed Lennard-Jones potential parameters, standard Lorentz–Berthelot mixing rules were used. The trajectories from 20.0 ns to 30.0 ns were used for further analysis.| System | MMDS | EC | EMC | Li+ | PF6− |
|---|---|---|---|---|---|
a EC![[thin space (1/6-em)]](https://www.rsc.org/images/entities/char_2009.gif) : :![[thin space (1/6-em)]](https://www.rsc.org/images/entities/char_2009.gif) EMC = 3 EMC = 3![[thin space (1/6-em)]](https://www.rsc.org/images/entities/char_2009.gif) : :![[thin space (1/6-em)]](https://www.rsc.org/images/entities/char_2009.gif) 7 (by wt), 1.2 mol L−1 of LiPF6, with 5 wt% MMDS (in MMDS-containing system) or 0 wt% MMDS (in baseline system). The molar masses of EC, EMC, MMDS, and LiPF6 are 88.06, 104.10, 188.18, and 151.91, respectively, in units of g mol−1. These ratios (EC 7 (by wt), 1.2 mol L−1 of LiPF6, with 5 wt% MMDS (in MMDS-containing system) or 0 wt% MMDS (in baseline system). The molar masses of EC, EMC, MMDS, and LiPF6 are 88.06, 104.10, 188.18, and 151.91, respectively, in units of g mol−1. These ratios (EC![[thin space (1/6-em)]](https://www.rsc.org/images/entities/char_2009.gif) : :![[thin space (1/6-em)]](https://www.rsc.org/images/entities/char_2009.gif) EMC = 3 EMC = 3![[thin space (1/6-em)]](https://www.rsc.org/images/entities/char_2009.gif) : :![[thin space (1/6-em)]](https://www.rsc.org/images/entities/char_2009.gif) 7 by wt, 5 wt% additive, 1.2 mol L−1 LiPF6) are the most commonly used formulations in lithium ion batteries. 7 by wt, 5 wt% additive, 1.2 mol L−1 LiPF6) are the most commonly used formulations in lithium ion batteries.
|
|||||
| MMDS-containing | 24 | 300 | 592 | 100 | 100 |
| Baseline | 0 | 316 | 624 | 100 | 100 |
The force field parameters of Li+ and PF6− were adapted from the work by Tenney et al.19 The van der Waals interaction parameters for the carbon of the graphite electrode were taken from the work of Cornell et al.20 To develop force fields for EC, EMC, and MMDS, we followed the methodology of the previous work (EC:DMC, LiPF6),19 in which an energy-minimized ab initio structure was first generated using Gaussian 03. From the results of this calculation, the open source Antechamber21 suite of force field tools was used to assign initial bonded and non-bonded force field parameters from the generalized AMBER force field (GAFF),22 in which atomic point charges were calculated from the ab initio results via Antechamber using the restrained electrostatic potential (RESP) method. The key force field parameters can be found in the ESI† (see key force field parameters). Some physical properties, including density and the radial distribution functions, were compared with the reported experimental and simulation data. As shown in Table 2, the densities in this work agree well with the experimental data (from SciFinder). As for radial distribution functions, the position of the first Li–O (carbonyl oxygen atom) peak at 2.02 Å in this work (see Fig. 5a) is in close agreement with the separation of 2.04 Å derived from neutron scattering experiments.23 The first Li–P peak at 3.24 Å in this work is also consistent with the reported results calculated by ab initio molecular dynamics (AIMD) at 3.3 Å24 and molecular dynamics (MD) at 3.2 Å.19 The RDF for Li–P is shown in Fig. S1 (ESI†). These agreements show that conventional MD are reasonable to describe correctly the short-range microscopic structure of the system. It is also confirmed that microscopic structures could be well modeled using conventional MD.19,25–27
Different electrical potentials were created by uniformly assigning partial charges to the innermost layers of the electrodes, the two innermost layers carry the same surface charge with opposite signs to keep the neutrality of the simulation system, and the potential was calculated using the Poisson equation.28–30 40 production-run trajectories for each kind of system were run (two kinds of system: MMDS-containing and baseline electrolytes), each trajectory at a different applied potential between the two electrodes ranging from −3 V to 2 V (0 to 5 V vs. Li/Li+). The electrode potential (URPZC) is defined as the potential drop across the EDL relative to the potential of zero charge (the equation is as follows, and the representative examples of Poisson potential for MMDS-containing electrolytes are shown in Fig. S2 of the ESI†).
| URPZC = UEDL − PZC = φelectrode − φbulk − PZC |
3 Results and discussion
3.1 Oxidation–reduction stability of solvent molecules
The HOMO and LUMO energy levels of EC, EMC and MMDS were calculated at the B3LYP/6-311+G(d) level. Based upon molecular orbital theory, the higher the HOMO of a molecule, the easier it is to oxidize. In contrast, a molecule with a lower energy level LUMO should be a better electron acceptor and more likely to be reduced. As depicted in Table 3, the three HOMO energy levels of the three molecules are not much different, and so neither are the corresponding oxidizing abilities. However, the LUMO energy of MMDS is −1.497 eV, which is much lower than that of EC or EMC, therefore, the reduction ability of the additive MMDS is stronger than that of the solvent. The simulation results are consistent with the electrochemical experimental data that MMDS could decompose prior to the solvents during the first charge process.5,32 In addition, ex situ analytical techniques (SEM, TEM, FTIR, etc.) demonstrate that MMDS is supposed to participate in the formation process of the thin and highly conductive SEI films,5,7,9 as the S element is found on the electrode surface, corresponding to sulfur compound MMDS. The synergy between simulation and experiment could better explain the phenomenon that the additive could decompose prior to the solvents and participate in the formation process of the SEI film.| Molecules | HOMO (eV) | LUMO (eV) |
|---|---|---|
| MMDS | −9.332 | −1.497 |
| EC | −8.778 | −0.072 |
| EMC | −8.855 | −0.068 |
3.2 Microstructure at electrolyte–electrode interfaces
![[thin space (1/6-em)]](https://www.rsc.org/images/entities/char_2009.gif) :
:![[thin space (1/6-em)]](https://www.rsc.org/images/entities/char_2009.gif) DMC (3
DMC (3![[thin space (1/6-em)]](https://www.rsc.org/images/entities/char_2009.gif) :
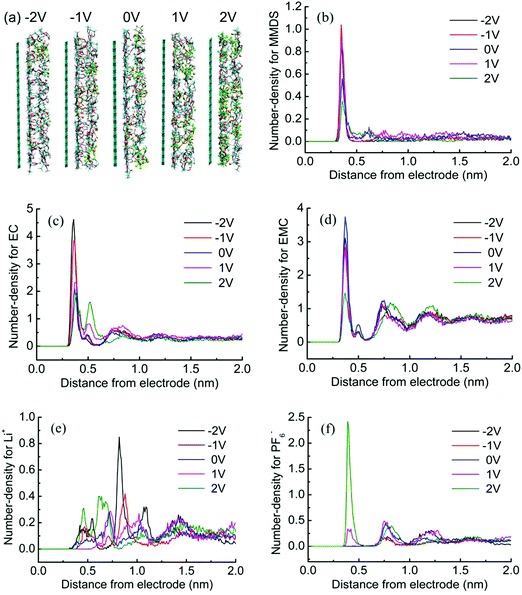
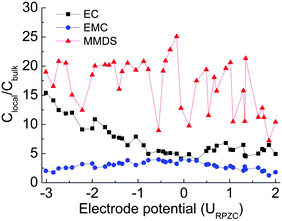
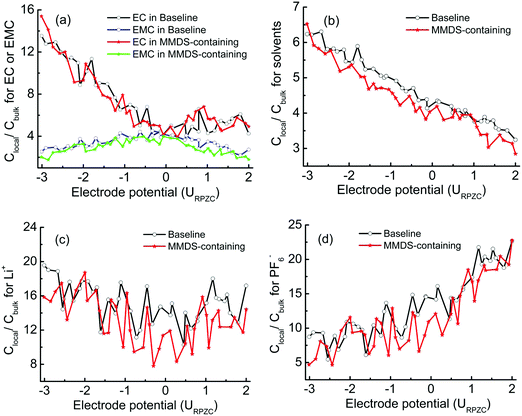
:![[thin space (1/6-em)]](https://www.rsc.org/images/entities/char_2009.gif) 7)/LiPF6 system,30 (the similar behavior between EMC and DMC at the electrode surface is attributed to the similar structures). Another reported experiment also confirmed this prediction, reporting a strong preferential adsorption of EC molecules on the LiCoO2 surface compared to linear carbonates. These linear carbonates in mixed electrolyte solutions play important roles in the bulk properties of the electrolyte solutions, such as the viscosity and melting point.33 Importantly, the Clocal/Cbulk of MMDS in Fig. 3 is much higher than that of any of the solvents no matter what the electrode potential is, suggesting that MMDS has more affinity for the surface where the redox processes take place.10 This is incorporated with the analysis in Section 3.1 showing that the reduction ability of MMDS is much stronger than that of the solvents and the additive is supposed to participate in the formation process of the thin and highly conductive SEI films.5,7,9 The preferential adsorption of MMDS further explains the phenomenon that additive MMDS would decompose prior to the solvents in the experiment.5,32 This behavior is expected to be especially beneficial for the formation of solid–electrolyte interphase (SEI) films.
7)/LiPF6 system,30 (the similar behavior between EMC and DMC at the electrode surface is attributed to the similar structures). Another reported experiment also confirmed this prediction, reporting a strong preferential adsorption of EC molecules on the LiCoO2 surface compared to linear carbonates. These linear carbonates in mixed electrolyte solutions play important roles in the bulk properties of the electrolyte solutions, such as the viscosity and melting point.33 Importantly, the Clocal/Cbulk of MMDS in Fig. 3 is much higher than that of any of the solvents no matter what the electrode potential is, suggesting that MMDS has more affinity for the surface where the redox processes take place.10 This is incorporated with the analysis in Section 3.1 showing that the reduction ability of MMDS is much stronger than that of the solvents and the additive is supposed to participate in the formation process of the thin and highly conductive SEI films.5,7,9 The preferential adsorption of MMDS further explains the phenomenon that additive MMDS would decompose prior to the solvents in the experiment.5,32 This behavior is expected to be especially beneficial for the formation of solid–electrolyte interphase (SEI) films.
3.3 Impact of MMDS on solvent–ion complex and on the electrochemical stability of electrolytes
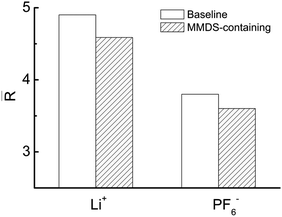
The most widely considered descriptors for electrolyte stability are orbital energy and vertical redox stability of the isolated solvent molecule (free molecule). However, deviations are always observed when compared with the experimental measured data;34–37 the values from the experiment are often lower than expected as solvent stability is strongly related to its coordination circumstances (solvent–Li+ complex, solvent–PF6− complex).1 HF-formation was found in oxidation of the solvent–PF6− complex, lowering the oxidation potential, see Fig. S7 (ESI†) by Borodin et al.37 (the oxidation potential of the EC–PF6− complex is decreased to 5–5.2 V, which is almost 2 V lower than that of isolated EC at the level of G4MP2 and ε = 20. The oxidation potential of the EMC–PF6− complex is decreased to 5.9 V, which is 1.4 V lower than that of isolated EMC, see Tables 1 and 4 in ref. 37 at the level of M05-2X/cc-pvTz and ε = 20). The importance of including the Li+ cation in the calculations of reduction stability for the solvent was also investigated; the presence of the Li+ cation near the solvent polarizes it and increases its reduction potential, making it more susceptible towards reduction.36 Therefore, the formation of solvent–ion complexes could shrink the electrochemical stability window of the electrolytes.In order to quantify the contribution of the solvent–ion complexes, a cutoff at the first valley of the corresponding pair distribution function is introduced (within the first coordination shell of the ions), as shown in Fig. 5. The cutoffs are 0.28 nm and 0.54 nm for solvent–Li+ and solvent–PF6− complexes, respectively. The significant solvation effects predict the high participation rate of mixed solvents in coordinating with ions. Next, the number of solvent–ion complexes at the surface within 1.7 nm is counted. This process is assisted by a user-coding Python program. Fig. 6 shows the number of solvent–Li+ and solvent–PF6− complexes at different electrode potentials in each system. The values for the complex in MMDS-containing electrolytes are lower than those in baseline electrolytes. Here solvent–Li+ exhibits a rapid decrease with the electrode potential from negative to positive, contrary to solvent–PF6−. The changing rate for solvent–Li+ is faster than that of solvent–PF6−, suggesting that the impact of the potential on the reduction stability of solvent is greater than that on the oxidation stability. Finally, the ratio (R) of solvent partitioning in the complex at every electrode potential is obtained, and it is calculated via normalizing the number of solvent–ion complexes by the sum of solvent molecules. Fig. 7 shows the averaged ratio (![[R with combining macron]](https://www.rsc.org/images/entities/i_char_0052_0304.gif) ) for solvent–Li+ complexes and solvent–PF6− complexes. The values of
) for solvent–Li+ complexes and solvent–PF6− complexes. The values of ![[R with combining macron]](https://www.rsc.org/images/entities/i_char_0052_0304.gif) in MMDS-containing electrolytes are lower than those in baseline electrolytes for the two complexes. The lower coordination ratio is expected to be especially beneficial for the stability of MMDS-containing electrolytes (as mentioned above, the formation of solvent–ion complexes could shrink the electrochemical stability window of the electrolytes). The smaller the ratio of solvents participating in the formation of solvent–Li+ or solvent–PF6− complexes, the less solvents are reduced or oxidized.
in MMDS-containing electrolytes are lower than those in baseline electrolytes for the two complexes. The lower coordination ratio is expected to be especially beneficial for the stability of MMDS-containing electrolytes (as mentioned above, the formation of solvent–ion complexes could shrink the electrochemical stability window of the electrolytes). The smaller the ratio of solvents participating in the formation of solvent–Li+ or solvent–PF6− complexes, the less solvents are reduced or oxidized.
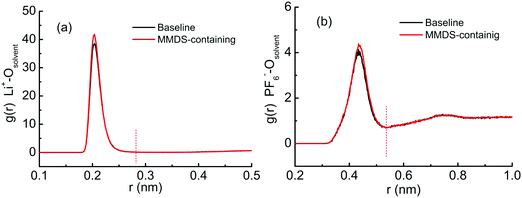 | ||
| Fig. 5 Radial distribution function for Li+ or PF6− ions with solvent carbonyl oxygen atoms in baseline and MMDS-containing electrolytes. | ||
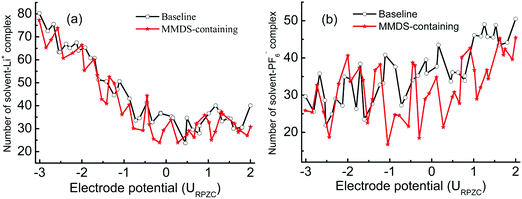 | ||
| Fig. 6 Number of solvent–ion complexes as a function of the electrode potential at the surface within 1.7 nm. | ||
4 Conclusion and remarks
This report shows the impact of additive MMDS on the electrolyte stability using a combination of DFT calculations and MD simulations of electrolyte structure in bulk and at the interfaces. It provides important insight into the control mechanisms for manipulating the electrolytes’ reduction–oxidation stability and interphasial chemistry. The stronger reduction ability and higher affinity for the electrode surface of MMDS than that of the solvents provide an important condition for priority decomposition of the additive. Incorporated with the characterization of ex situ analytical techniques, this behavior is expected to be especially beneficial for the formation of solid–electrolyte interphase (SEI) films. Finally, this work further extends our understanding of the stability of MMDS-containing electrolytes. As the use of MMDS could reduce the probability of finding solvent–ion complexes at the surface where the redox processes take place, it is suggested that this would be beneficial for the stability of solvents and for widening the electrochemical stability window of MMDS-containing electrolytes.Analogously, this investigation was extended to FEC-containing electrolytes. However, there is no significant difference in orbital energy and the affinity for the surface between additive FEC and the solvents (see Table S1 in ESI†), which is dissimilar to MMDS-containing electrolytes. This may result from the difference in their structures (see Fig. S4 for the structures of these molecules, ESI†). MMDS contains more and stronger electron-withdrawing groups (two sulfuryl) than FEC (one carbonyl), and these functional groups are closely related to the adsorption/coordination.38–40 Therefore, we consider that the mechanism of additive MMDS responsible for improving the cycling performance of high voltage LIBs is different from that of FEC, as discussed in our previous work.41
Conflicts of interest
There are no conflicts to declare.Acknowledgements
This work was financially supported by the National Natural Science Foundation of China (Grant No. 21673206 and 21676232).References
- O. Borodin, X. Ren, J. Vatamanu, C. A. von Wald, J. Knap and K. Xu, Acc. Chem. Res., 2017, 50, 2886–2894 CrossRef CAS PubMed.
- K. Xu, Chem. Rev., 2004, 104, 4303–4418 CrossRef CAS PubMed.
- S. Z. Sheng, J. Power Sources, 2006, 162, 1379–1394 CrossRef.
- R. Wang, X. Li, B. Zhang, Z. Wang and H. Guo, J. Alloys Compd., 2015, 648, 512–520 CrossRef CAS.
- R. Wang, X. Li, Z. Wang and H. Guo, J. Solid State Electrochem., 2016, 20, 19–28 CrossRef CAS.
- Z. Zhang, Y. Yang and F. Bian, J. Energy Chem., 2014, 23, 383–390 CrossRef.
- S. Mai, M. Xu and Y. Wang, Int. J. Electrochem. Sci., 2014, 6294–6304 Search PubMed.
- D. Y. Wang, J. Xia, L. Ma, K. J. Nelson, J. E. Harlow, D. Xiong, L. E. Downie, R. Petibon, J. C. Burns, A. Xiao, W. M. Lamanna and J. R. Dahn, J. Electrochem. Soc., 2014, 161, A1818–A1827 CrossRef.
- T. Huang, M. Wu, W. Wang, Y. Pan and G. Fang, J. Power Sources, 2014, 262, 303–309 CrossRef CAS.
- L. Xing, J. Vatamanu, O. Borodin, G. D. Smith and D. Bedrov, J. Phys. Chem. C, 2012, 116, 23871–23881 CrossRef CAS.
- R. Jorn, R. Kumar, D. P. Abraham and G. A. Voth, J. Phys. Chem. C, 2013, 117, 3747–3761 CrossRef CAS.
- L. Ma, J. Self, M. Nie, S. Glazier, D. Y. Wang, Y. Lin and J. R. Dahn, J. Power Sources, 2015, 299, 130–138 CrossRef CAS.
- E. Lindahl, B. Hess and D. van der Spoel, J. Mol. Model., 2001, 7, 306–317 CrossRef CAS.
- H. Berendsen, D. Vanderspoel and R. Vandrunen, Comput. Phys. Commun., 1995, 91, 43–56 CrossRef CAS.
- D. Van der Spoel, E. Lindahl, B. Hess, G. Groenhof, A. E. Mark and H. Berendsen, J. Comput. Chem., 2005, 26, 1701–1718 CrossRef CAS PubMed.
- G. Bussi, D. Donadio and M. Parrinello, J. Chem. Phys., 2007, 126, 14101 CrossRef PubMed.
- U. Essmann, L. Perera, M. L. Berkowitz, T. Darden, H. Lee and L. G. Pedersen, J. Chem. Phys., 1995, 103, 8577–8593 CrossRef CAS.
- T. Darden, D. York and L. Pedersen, J. Chem. Phys., 1993, 98, 10089–10092 CrossRef CAS.
- C. M. Tenney and R. T. Cygan, J. Phys. Chem. C, 2013, 117, 24673–24684 CrossRef CAS.
- W. D. Cornell, P. Cieplak, C. I. Bayly, I. R. Gould, K. M. Merz, D. M. Ferguson, D. C. Spellmeyer, T. Fox, J. W. Caldwell and P. A. Kollman, J. Am. Chem. Soc., 1995, 117, 5179–5197 CrossRef CAS.
- J. Wang, W. Wang, P. A. Kollman and D. A. Case, J. Mol. Graphics Modell., 2006, 25, 247–260 CrossRef CAS PubMed.
- J. M. Wang, R. M. Wolf, J. W. Caldwell, P. A. Kollman and D. A. Case, J. Comput. Chem., 2004, 25, 1157–1174 CrossRef CAS PubMed.
- Y. Kameda, Y. Umebayashi, M. Takeuchi, M. A. Wahab, S. Fukuda, S. Ishiguro, M. Sasaki, Y. Amo and T. Usuki, J. Phys. Chem. B, 2007, 111, 6104–6109 CrossRef CAS PubMed.
- O. Borodin and G. D. Smith, J. Phys. Chem. B, 2009, 113, 1763–1776 CrossRef CAS PubMed.
- J. M. Vicent-Luna, J. M. Ortiz-Roldan, S. Hamad, R. Tena-Zaera, S. Calero and J. A. Anta, Chem. Phys. Chem., 2016, 17, 2473–2481 CrossRef CAS PubMed.
- N. Takenaka, Y. Suzuki, H. Sakai and M. Nagaoka, J. Phys. Chem. C, 2014, 118, 10874–10882 CrossRef CAS.
- X. Liu, S. Zhang, G. Zhou, G. Wu, X. Yuan and X. Yao, J. Phys. Chem. B, 2006, 110, 12062–12071 CrossRef CAS PubMed.
- S. Li, M. Zhu and G. Feng, J. Phys.: Condens. Matter, 2016, 28, 464005 CrossRef PubMed.
- S. Li, G. Feng and P. T. Cummings, J. Phys.: Condens. Matter, 2014, 26, 284106 CrossRef PubMed.
- J. Vatamanu, O. Borodin and G. D. Smith, J. Phys. Chem. C, 2012, 116, 1114–1121 CrossRef CAS.
- J. Vatamanu and O. Borodin, J. Phys. Chem. Lett., 2017, 8, 4362–4367 CrossRef CAS PubMed.
- N. N. S. L. Jian Xia, J. Electrochem. Soc., 2014, 161, A84–A88 CrossRef.
- L. Yu, H. Liu, Y. Wang, N. Kuwata, M. Osawa, J. Kawamura and S. Ye, Angew. Chem., Int. Ed., 2013, 52, 5753–5756 CrossRef CAS PubMed.
- H. Yoshitake, Functional Electrolytes Specially Designed for Lithium-Ion Batteries, Springer New York, New York, 2009, pp. 343–366 Search PubMed.
- K. Abe, T. Hattori, K. Kawabe, Y. Ushigoe and H. Yoshitake, J. Electrochem. Soc., 2007, 154, A810–A815 CrossRef CAS.
- O. Borodin, M. Olguin, C. E. Spear, K. W. Leiter and J. Knap, Nanotechnology, 2015, 26, 354003 CrossRef PubMed.
- O. Borodin, W. Behl and T. R. Jow, J. Phys. Chem. C, 2013, 117, 8661–8682 CrossRef CAS.
- Y. Li, M. Liao and J. Zhou, J. Phys. Chem. C, 2018, 122, 22965–22974 CrossRef CAS.
- B. K. Daas, G. Koley and T. S. Sudarshan, Sens. Transducers J., 2017, 216, 29–37 CAS.
- R. M. Geronia, A. C. Serraon, A. A. B. Padama and J. D. Ocon, ECS Trans., 2017, 77, 607–620 CrossRef CAS.
- Y. Wang, D. Li, X. Yu, C. Shang, Y. Liu and Q. Wang, Phys. Chem. Chem. Phys., 2018, 20, 19885–19891 RSC.
Footnote |
| † Electronic supplementary information (ESI) available. See DOI: 10.1039/c8cp06548a |
| This journal is © the Owner Societies 2019 |

