Spin glass like transition and the exchange bias effect in Co3O4 nanoparticles anchored onto graphene sheets
S.
Sarkar
,
A.
Mondal
,
N.
Giri
and
R.
Ray
*
Department of Physics, Jadavpur University, Kolkata 700 032, India. E-mail: juphyruma@gmail.com; Fax: +91 (033) 24138917; Tel: +91 (033) 2457-2629
First published on 27th November 2018
Abstract
We have synthesized Co3O4 nanoparticles having 40 nm average size, which are anchored on reduced graphene oxide. X-ray diffraction, FESEM, TEM and Raman spectroscopy are performed for the characterization. The temperature dependence of field cooled (FC) and zero field cooled (ZFC) magnetization curves exhibits antiferromagnetic (AFM) transition around ∼30 K, as observed for bulk Co3O4. The exchange bias effect is observed below ∼30 K. A significant change in the exchange bias effect is noted around ∼8 K, which is close to a spin-glass-like transition. The spin-glass-like phase has been confirmed by the memory effects observed by different experimental protocols. The possible origin of exchange bias is discussed in the manuscript.
1. Introduction
Over the past few decades, synthesis and characterization of magnetic metal oxide nanoparticles has been the subject of intense research due to their technological applications in diverse fields such as magnetic storage,1 magnetic recording,2 and magnetic sensors3 and in different areas of medical science like MRI and drug delivery.4 Magnetic nanoparticles display different characteristic features, which are noticeably different from their bulk counterpart.5 For example, magnetic metal oxide nanoparticles having a significantly different magnetic anisotropy of core and shell structure may show the exchange bias effect (EB). The exchange bias effect typically appears due to the pinning mechanism at the interface between two magnetic components with significantly different anisotropy.6 The displacement of the magnetic hysteresis loop is the typical manifestation of the EB effect. Numerous reports of the EB phenomenon in AFM metal oxide nanoparticles like NiO,7,8 CuO,9 γ-Fe2O3, Fe3O4,10,11 Cr2O37 and Co3O412,13 are found in recent years. These establish the evidence of distinguishable surface magnetic anisotropy from that of the core. The nature of surface magnetic anisotropy is proposed to be different in different cases. For example, for NiO7,8 and γ-Fe2O3,10 a frustrated magnetic shell has been suggested, whereas a spin glass component has been suggested in the shell of γ-Fe2O314 and Fe3O415 nanoparticles. The presence of a weak ferromagnetic (FM) component has been suggested at the surface of AFM CuO nanoparticles.9 Recently, a disordered glassy magnetic phase at the particle surface has been proposed in La1/3Sr2/3FeO3.16Recently, graphene, one-atom-thick with sp2-hybridized carbon structure and two-dimensional single sheet morphology, has triggered tremendous research interest owing to its remarkable electrical, optical and mechanical properties.17,18 Functionalized graphene sheets are realized by converting a fraction of the sp2 graphenic carbons to sp3 carbons, which covalently bind with polymers,19 chemicals20 and nanostructures.21,22 Of these, graphene–magnetic nanoparticle composites are gaining great attention owing to their multifunctional and unified properties.
Here, we report the EB effect observed in magnetic Co3O4 nanoparticles which are anchored on reduced graphene oxide (rGO). Integration of nanoparticles (NPs) and graphene into nanocomposites has recently become a field of intense research19–22 due to their new and/or enhanced functionalities that cannot be achieved by either component alone, and therefore holds great promise for a wide variety of applications in catalysis, optoelectronic materials, MRI, drug delivery, etc.23 This composite is analogous to those magnetic nanoparticles embedded in non-magnetic metals where it has been proposed that the RKKY interaction is suppressed by the magnetostatic dipole interactions for particles larger than ∼1 nm.24 The conductivity mechanism of 2D graphene is distinctly different from that of a metal.25 In addition to the dipole–dipole interaction between the Co3O4 nanoparticles, the possible magnetic interaction mediated through semi-metallic graphene may show a synergistic effect. To observe the graphene mediated interaction a diluted magnetic system has been chosen where 5% volume fraction of Co3O4 is anchored on the reduced graphene oxide (rGO) sheet.
2. Experimental
2.1. Synthesis of Co3O4 nanoparticles
Co3O4 nanoparticles are synthesized by the sol–gel citrate precursor technique. 3.722 g of cobalt acetate tetrahydrate (Co(CH3COO)2·4H2O) powder is dissolved in 15 ml of diluted nitric acid to form cobalt nitrate solution. A suitable amount of citric acid is added to the solution and stirred for 6 hours at 343 K to ensure the formation of metal citrates. The amount of citric acid is chosen to ensure that all the metal ions form metal citrates by considering that only two of the citrate ions take part in chemical bonding with metal ions.26,27 The solution is gently and slowly evaporated for a long time to obtain dried citrate precursor powder. The precursor powder is then ground and heated at 773 K for 3 h in air to form well-crystallized oxides. During this process a number of gases, viz. CO and CO2, organic products, water vapour, etc., evolve as a result of decomposition of mainly citrates.262.2. Synthesis of the Co3O4@rGO composite
The Co3O4 nanoparticles are used in the synthesis of the Co3O4@rGO nanocomposite with 5% volume fraction of Co3O4. GO is typically synthesized following modified Hummers’ method. 0.1 g of as-prepared GO powder is then sonicated in 50 ml of ethanol for 1 hour. Then, 0.2804 g of Co3O4 nanopowder and 50 ml of deionised water are added to the GO solution and stirred for 30 min to get a homogeneous mixture. After that the temperature of the mixture solution is increased to 100 °C and 5 ml of Hydrazine Hydrate solution (80%) is added dropwise to reduce GO to rGO. Stirring at 100 °C is continued for about 12 hours which is followed by centrifugation and washing by ethanol and distilled water. This step is repeated several times. Then the collected precipitate is dried at 60 °C for 6 hours and the desired 5% Co3O4@rGO composite is formed. Calculation of the volume fraction of Co3O4 in the composite requires the reduction yield of GO to rGO. The yield of rGO by hydrothermal reduction of GO has been estimated to be around 50%. The weight fraction of Co3O4 in the nanocomposite can be determined by the following equation:where mGO and mCo3O4 represent the mass of GO and Co3O4, respectively. The weight fraction of Co3O4 is transformed into the volume fraction by using the densities of rGO (2.26 g per c.c) and Co3O4 (6.11 g per c.c). Here the density of rGO is assumed to be close to that of natural graphite.
2.3. Characterization
Samples are characterized at room temperature by using an X-ray diffractometer (model: Bruker D8 Advance) using Cu Kα radiation of wavelength 1.5406 Å. The morphology of the nanoparticles is studied by field emission scanning electron microscopy (FE-SEM) (model: JSM-7610F, JEOL) and tunneling electron microcopy (TEM) (model: JEM-2100F, JEOL). Raman spectroscopy is studied using a SPEX-1403 laser Raman spectrometer with excitation by a 514.5 nm argon laser line in the back-scattering geometry. Magnetization is measured in the temperature range 2–300 K, in a commercial SQUID magnetometer (Quantum Design, MPMS-5).3. Results and discussion
3.1. Structure and morphology: XRD, FESEM, TEM studies
The X-ray diffraction patterns (XRD) measured at room temperature in the 2θ range of 10°–80° for the Co3O4@rGO nanocomposite are illustrated in Fig. 1. All lines are unambiguously indexed for different (hkl) planes (JCPDS No. 43-1003) corresponding to cubic spinel structured Co3O4. No characteristic peak for rGO is observed in the XRD pattern of Co3O4/rGO composites. The signature of rGO has been confirmed from Raman spectroscopy studies as discussed later. The particle size (D) and microstrain (ε) of Co3O4 nanoparticles are estimated by using Williamson and Hall's28 modified Scherrer's formula given byβ![[thin space (1/6-em)]](https://www.rsc.org/images/entities/char_2009.gif) cos cos![[thin space (1/6-em)]](https://www.rsc.org/images/entities/char_2009.gif) θ = 0.89λ/D + 2ε θ = 0.89λ/D + 2ε![[thin space (1/6-em)]](https://www.rsc.org/images/entities/char_2009.gif) sin sin![[thin space (1/6-em)]](https://www.rsc.org/images/entities/char_2009.gif) θ, θ, | (1) |
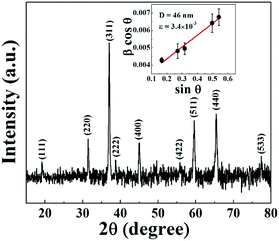 | ||
| Fig. 1 X-ray diffraction pattern of the Co3O4@rGO composite. The inset shows the Williamson–Hall plot. | ||
Taking under consideration the prominent XRD peaks having uniquely defined FWHM a linear fit of β![[thin space (1/6-em)]](https://www.rsc.org/images/entities/char_2009.gif) cos
cos![[thin space (1/6-em)]](https://www.rsc.org/images/entities/char_2009.gif) θ versus sin
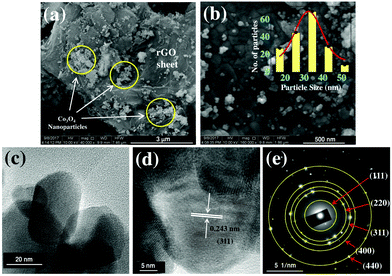
θ versus sin![[thin space (1/6-em)]](https://www.rsc.org/images/entities/char_2009.gif) θ plot is shown in the inset of Fig. 1. The average particle size and the microstrain of Co3O4 nanoparticles are estimated to be 46 nm and 3.4 × 10⁻³, respectively. The morphology and size of Co3O4 nanopaticles are investigated from FESEM and TEM images. Fig. 2a displays the rGO sheet acting like a substrate on which Co3O4 nanoparticles are dispersed. The size distribution of the well anchored nanoparticles follows Gaussian distribution (inset of Fig. 2b) with the maximum number of particles in the range 30–35 nm. The TEM image of Co3O4 implanted on the rGO sheet as shown in Fig. 2c indicates the morphology of the particles having a maximum number of particles of size ∼25–35 nm. The interplanar spacing as in Fig. 2d is found to be 0.243 nm which can be assigned to Co3O4(311) planes. Selected area electron diffraction (SAED) patterns are depicted in Fig. 2e, where rings correspond to different diffraction planes as observed in the XRD pattern.
θ plot is shown in the inset of Fig. 1. The average particle size and the microstrain of Co3O4 nanoparticles are estimated to be 46 nm and 3.4 × 10⁻³, respectively. The morphology and size of Co3O4 nanopaticles are investigated from FESEM and TEM images. Fig. 2a displays the rGO sheet acting like a substrate on which Co3O4 nanoparticles are dispersed. The size distribution of the well anchored nanoparticles follows Gaussian distribution (inset of Fig. 2b) with the maximum number of particles in the range 30–35 nm. The TEM image of Co3O4 implanted on the rGO sheet as shown in Fig. 2c indicates the morphology of the particles having a maximum number of particles of size ∼25–35 nm. The interplanar spacing as in Fig. 2d is found to be 0.243 nm which can be assigned to Co3O4(311) planes. Selected area electron diffraction (SAED) patterns are depicted in Fig. 2e, where rings correspond to different diffraction planes as observed in the XRD pattern.
3.2. Spectroscopic characterization: Raman spectroscopy
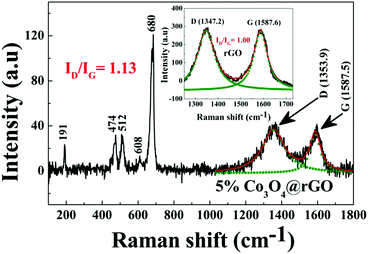
Spectroscopic characterization of the Co3O4/rGO nanocomposite has been performed by Raman spectroscopy. Raman active carbonaceous materials are expected to show two characteristic main peaks, the so-called D- and G-band, at around 1350 cm−1 and 1600 cm−1. Fig. 3 shows a broad D band (∼1353 cm−1), a comparatively sharp G band (∼1587 cm−1) along with all the fundamental Raman vibration of Co3O4 at 474 cm−1 corresponding to Eg mode, and the bands at 191, 512, and 608 cm−1 corresponding to F2g mode.29 The D band is due to the defects as well as disordered atomic arrangement caused by the sp3 carbon atom and its intensity is directly proportional to the amount of defects or disorders present in the sample. The intensity of the G-band is proportional to the amount of ordered graphitic (sp2) carbon contained in the sample.30,31Fig. 3 illustrates that the ratio of which is a measure of disorder is significantly larger compared to that (1.00) of rGO as reported by Sarkar et al.32 This may refer to the enhancement of the defects induced in the graphene sheet due to the anchoring of Co3O4 on the rGO sheet.
3.3. Magnetic properties
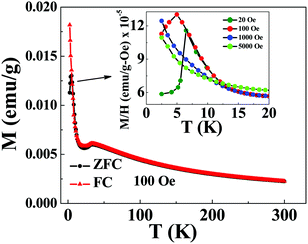
After exhibiting the AFM peak at TN, FC magnetization increases sharply with lowering of temperature till 2 K, whereas the sharp increase of ZFC magnetization with decreasing temperature is followed by a peak around 5 K (Tsg) as shown in the inset of Fig. 4. This sharp increase of FC and ZFC may indicate the presence of a ferromagnetic (FM) component. This FM component may be ascribed to the uncompensated (UC) spins at the surface of the AFM core of Co3O4 nanoparticles which are dispersed on the rGO sheet. To characterize the peak (Tsg) in ZFC magnetization, the M–T measurement has been performed at different magnetic fields of ∼20 Oe, 100 Oe, 1 kOe and 5 kOe as shown in the inset of Fig. 4. ZFC magnetization performed at 20 Oe exhibits a peak at a slightly higher temperature compared to that of at 100 Oe, whereas it does not exhibit any peak down to 2 K for 5 kOe and 1 kOe measuring field. Such a strong dependence of ZFC peak position on the magnetic field designates the presence of a metastable state. This metastable state may be assigned to the re-entrant spin glass (SG) phase as discussed later in Section 3.3.2.
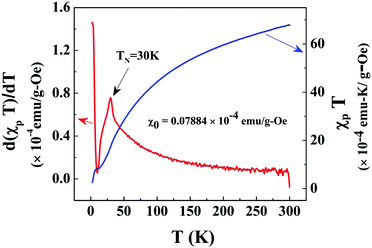
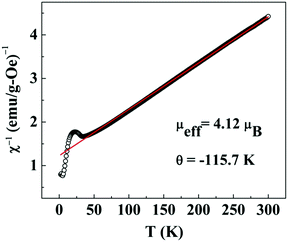
In the high temperature region, i.e. T ≫ TN, the plot of χ−1versus T (Fig. 6) is fitted with the modified Curie–Weiss law χ = χ0 + C/(T − θ), where C = Nμeff2/3kBT and  , θ is the Curie–Weiss temperature and χ0 is the temperature-independent contribution. The best fitted line as shown in Fig. 6 evaluates μeff = 4.12μB, θ = −115.7 K and χ0 = 7.08 × 10⁻⁶ emu g−1 Oe−1. Co3O4 exhibits a normal spinel structure with the occupation of 8 Co2+ tetrahedral ions and 16 Co3+ octahedral ions per unit cell. Its magnetic moment arises due to Co2+ ions only, since Co3+ ions have no permanent magnetic moment as a consequence of the splitting of 3d levels in the octahedral crystal field and 3d6 electrons are paired in t2g levels. The value of μeff = 4.12μB is larger than the spin only μeff = 3.87μB with S = 3/2. This mismatch may be due to spin–orbit coupling contribution. The large negative value of θ predicts the antiferromagnetic exchange interaction between Co2+ ions.
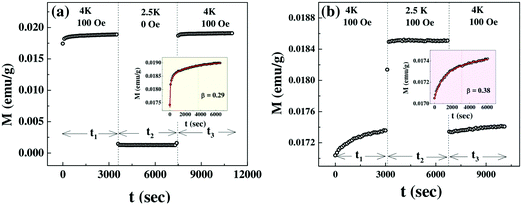
Both plots clearly depict the return of magnetization to nearly the same value after the temporary halt at the lower temperature of 2.5 K. This is a clear confirmation of the memory effect. To further elucidate this effect the magnetization obtained during the aging periods t1 and t3 is plotted sequentially in the inset of Fig. 7a and b, leaving out the intermittent time evolution for t2. Both plots display that the magnetization within the time period t3 appears as a perfect continuation to the curve measured during t1. Thus the system recollects its initial configuration as it returns to the initial temperature in both cases.
The time evolution of magnetization resulting from slow relaxation is shown in the inset of Fig. 7a and b. It can be approximated by the stretched exponential function36
| M(t) = M0 + Mg[1 − exp(−(t/t0))β] |
The ZFC relaxation experiment (Fig. 8) under the same protocol has been repeated at 16 K which is much above the temperature Tsg with 12 K as an intermediate temperature. The absence of the memory phenomenon as clearly demonstrated in the inset of Fig. 8 is expected as it is far above the spin glass transition temperature Tsg.
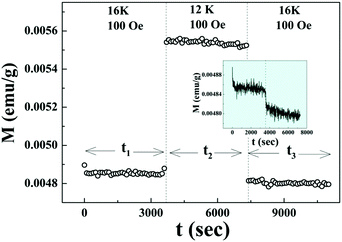 | ||
| Fig. 8 Magnetic relaxation at 16 K and 100 Oe for t1 and t3 after cooling down from 300 K in ZFC mode with an intermediate measurement time t2 in zero field quench at 12 K. | ||
There have been several reports39,40 on the magnetic properties of bare Co3O4 nanoparticles exhibiting superparamagnetic block state exhibiting memory effects in the FC protocol. But the aging and memory effects in the ZFC protocol which confirm the spin glass behavior of Co3O4 nanoparticles are rarely found in the literature. Here, the magnetic properties of Co3O4 anchored onto the graphene sheet differ remarkably from that of bare Co3O4 nanoparticles, which indicates that graphene is a potential substrate for AFM nanoparticles to exhibit their intrinsic magnetic properties.
 and
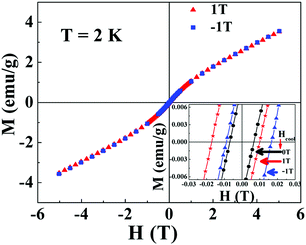
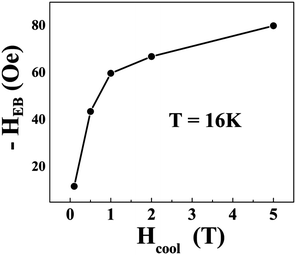
and  respectively, where Hc+ (Hc−) represents the positive (negative) coercive field. Fig. 10 represents isothermal hysteresis loops at some representative temperatures measured in FC mode under Hcool = 1 T. The thermal variation of the exchange bias field (HE) and the coercive field (Hc) is shown in Fig. 11. The exchange bias field increases rapidly below TN with lowering of temperature and remains almost constant in the temperature range 12 ≤ T ≤ 25 K. Below 8 K, as illustrated in the plot, HE becomes significantly small. This decrease of HE might be involved with the spin-glass phase as revealed from the memory effect. Unlike other exchange bias systems,41 the nature of thermal variation of coercive field Hc is different from that of HE. The coercive field drastically decreases with the increase of temperature from 2 K and becomes almost temperature independent in the temperature range 12 ≤ T ≤ 300 K. This kind of different trends of HE and Hc has also been reported recently by S. Ye et al.42 The explanation of the different trends of HE and Hc requires more involved experiment as well theoretical understanding. The cooling field (Hcool) dependence of the EB effect at 16 K is investigated here. A systematic variation of HE as a function of Hcool is depicted in Fig. 12. In the case of a small cooling field, HE increases sharply with Hcool. With the further increase of Hcool till 5 T, the exchange bias field increases very slowly. The rapid increase of HE with Hcool is attributed to the alignment of pinned FM spins toward the direction of Hcool. When all the pinned spins are aligned, the increase of Hcool cannot contribute more to the increase of HE.
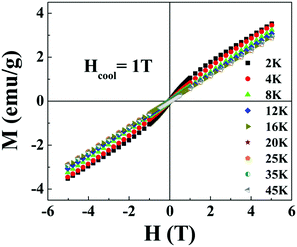 | ||
| Fig. 10 Magnetic hysteresis loops measured at different temperatures T where 2 ≤ T ≤ 45 K after cooling the sample under Hcool = 1 T. | ||
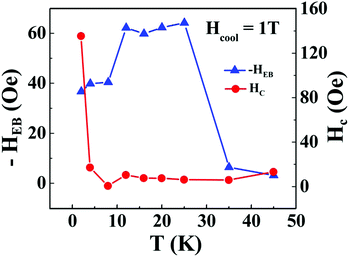 | ||
| Fig. 11 Thermal variation of exchange bias field (HE) and coercivity (HC) of the Co3O4@rGO composite measured under cooling field Hcool = 1 T. | ||
4. Summary and conclusions
Co3O4 nanoparticles synthesized by the sol–gel citrate precursor technique have been used for the production of the Co3O4@rGO nanocomposite having 5% volume fraction of Co3O4. Structural and morphological characterization performed by X-ray diffraction, FESEM and TEM reveals the dispersion of cubical spinel structured Co3O4 nanoparticles of ∼40 nm average size on the graphene sheet. Spectroscopic characterization performed by Raman spectroscopy illustrates the enhancement of the defects induced in the graphene sheet which ascertains the anchoring of Co3O4 on the rGO sheet. The temperature dependence of both field cooled (FC) and zero field cooled (ZFC) magnetization curves exhibits antiferromagnetic (AFM) transition around ∼30 K. The exchange bias field (∼65 Oe) remains almost constant in the temperature range 12 ≤ T ≤ 25 K, which might be attributed to the AFM core and uncompensated (UC) surface spins, as typically observed for the magnetic nanoparticles.41 Interestingly, this nanocomposite undergoes SG phase transition around 5 K which is indicated by the manifestation of a peak in the ZFC magnetization vs temperature plot. The relaxation dynamics of magnetization satisfying a stretched exponential form supports SG phase. This glassy magnetic phase below 5 K has also been established by relaxation memory studies performed in the ZFC protocol which is commonly accepted as an experimental fingerprint for SG behavior. The significant change of the exchange bias field near the SG transition indicates that the SG phase is involved in the observed exchange bias effect. The unusual observation of re-entrant spin glass in Co3O4 nanoparticles is rare and it might have occurred due to graphene mediated exchange interactions. This needs to be confirmed by further experimental and theoretical studies.Conflicts of interest
There are no conflicts to declare.Acknowledgements
The authors would like to thank DST, Govt. of India, for developing instrumental facilities like Advance X-ray powder diffractometer (Bruker D8) and FE-SEM (JEOL, JSM-7610F) under FIST programme at Jadavpur University. The authors would like to acknowledge SINP, Kolkata, for providing the instrumental facilities like SQUID vibrating sample magnetometer (Quantum Design). S. Sarkar, A. Mondal and N. Giri wish to thank DST for the INSPIRE fellowship scheme.References
- N. A. Frey, S. Peng, K. Cheng and S. Sun, Magnetic nanoparticles: synthesis, functionalization, and applications in bioimaging and magnetic energy storage, Chem. Soc. Rev., 2009, 38, 2532–2542 RSC.
- A. Moser, K. Takano, D. T. Margulies, M. Albrecht, Y. Sonobe, Y. Ikeda, S. Sun and E. E. Fullerton, Magnetic recording: advancing into the future, J. Phys. D: Appl. Phys., 2002, 35, R157–R167 CrossRef CAS.
- S. Laurent, D. Forge, M. Port, A. Roch, C. Robic, L. Vander Elst and R. N. Muller, Magnetic Iron Oxide Nanoparticles: Synthesis, Stabilization, Vectorization, Physicochemical Characterizations, and Biological Applications, Chem. Rev., 2008, 108(6), 2064–2110 CrossRef CAS.
- B. Chertok, B. A. Moffat, A. E. David, F. Yu, C. Bergemann, B. D. Ross and V. C. Yang, Iron Oxide Nanoparticles as a Drug Delivery Vehicle for MRI Monitored Magnetic Targeting of Brain Tumors, Biomaterials, 2008, 29(4), 487–496 CrossRef CAS.
- E. Erdem, Electron beam curing of CoFe2O4 nanoparticles, Hybrid Mater., 2014, 1, 62–70 Search PubMed.
- J. Nogués and I. K. Schuller, Exchange bias, J. Magn. Magn. Mater., 1999, 192, 203–232 CrossRef.
- Sk. Sabyasachi, S. Majumdar and S. Giri, Nanocrystallite interface effect and exchange bias phenomenology in Cr2O3 and NiO nanoparticles, Solid State Commun., 2011, 151, 1515–1519 CrossRef CAS.
- M. P. Proenca, C. T. Sousa, A. M. Pereira, P. B. Tavares, J. Ventura, M. Vazquez and J. P. Araujo, Size and surface effects on the magnetic properties of NiO nanoparticles, Phys. Chem. Chem. Phys., 2011, 13, 9561–9567 RSC.
- A. Punnoose, H. Magnone, M. S. Seehra and J. Bonevich, Bulk to nanoscale magnetism and exchange bias in CuO nanoparticles, Phys. Rev. B: Condens. Matter Mater. Phys., 2001, 64, 174420 CrossRef.
- T. N. Shendruk, R. D. Desautels, B. W. Southern and J. Van. Lierop, The effect of surface spin disorder on the magnetism of γ-Fe2O3 nanoparticle dispersions, Nanotechnology, 2007, 18, 455704 CrossRef.
- G. Salazar-Alvarez, J. Qin, V. Sepelák, I. Bergmann, M. Vasilakaki, K. N. Trohidou, J. D. Ardisson, W. A. A. Macedo, M. Mikhaylova, M. Muhammed, M. D. Baró and J. Nogués, Cubic versus Spherical Magnetic Nanoparticles: The Role of Surface Anisotropy, J. Am. Chem. Soc., 2008, 130, 13234–13239 CrossRef CAS.
- M. J. Benitez, O. Petracic, E. L. Salabas, F. Radu, H. Tüysüz, F. Schüth and H. Zabel, Evidence for Core–Shell Magnetic Behavior in Antiferromagnetic Co3O4 Nanowires, Phys. Rev. Lett., 2008, 101, 097206 CrossRef CAS.
- P. Dutta, M. S. Seehra, S. Thota and J. Kumar, A comparative study of the magnetic properties of bulk and nanocrystalline Co3O4, J. Phys.: Condens. Matter, 2008, 20, 015218 CrossRef.
- H. Wang, T. Zhu, K. Zhao, W. N. Wang, C. S. Wang, Y. J. Wang and W. S. Zhan, Surface spin glass and exchange bias in Fe3O4 nanoparticles compacted under high pressure, Phys. Rev. B: Condens. Matter Mater. Phys., 2004, 70, 092409 CrossRef.
- B. Martínez, X. Obradors, Ll. Balcells, A. Rouanet and C. Monty, Low Temperature Surface Spin-Glass Transition in γ-Fe2O3 Nanoparticles, Phys. Rev. Lett., 1998, 80, 181–184 CrossRef.
- Sk. Sabyasachi, M. Patra, S. Majumdar and S. Giri, Glassy magnetic phase driven by short-range charge and magnetic ordering in nanocrystalline La1/3Sr2/3FeO3−δ: Magnetization, Mössbauer, and polarized neutron studies, Phys. Rev. B: Condens. Matter Mater. Phys., 2012, 86, 104416 CrossRef.
- K. S. Novoselov, Nobel Lecture: Graphene: Materials in the Flatland, Rev. Mod. Phys., 2011, 83, 837–849 CrossRef CAS.
- A. K. Geim, Nobel Lecture: Random walk to graphene, Rev. Mod. Phys., 2011, 83, 851–862 CrossRef CAS.
- T. Ramanathan, A. A. Abdala, S. Stankovich, D. A. Dikin, M. Herrera-Alonso, R. D. Piner, D. H. Adamson, H. C. Schniepp, X. Chen, R. S. Ruoff, S. T. Nguyen, I. A. Aksay, R. K. Prud'Homme and L. C. Brinson, Functionalized Graphene Sheets for Polymer Nanocomposites, Nat. Nanotechnol., 2008, 3, 327–331 CrossRef CAS.
- S. Stankovich, D. A. Dikin, G. H. B. Dommett, K. M. Kohlhaas, E. J. Zimney, E. A. Stach, R. D. Piner, S. T. Nguyen and R. S. Ruoff, Graphene-Based Composite Materials, Nature, 2006, 442, 282–286 CrossRef CAS.
- Y. Si and E. T. Samulski, Exfoliated Graphene Separated by Platinum Nanoparticles, Chem. Mater., 2008, 20, 6792–6797 CrossRef CAS.
- X. Wang, S. Tabakman and H. Dai, Atomic Layer Deposition of Metal Oxides on Pristine and Functionalized Graphene, J. Am. Chem. Soc., 2008, 130, 8152–8153 CrossRef CAS PubMed.
- K. Jasuja, J. Linn, S. Melton and V. Berry, Microwave-Reduced Uncapped Metal Nanoparticles on Graphene: Tuning Catalytic, Electrical, and Raman Properties, J. Phys. Chem. Lett., 2010, 1, 1853 CrossRef CAS.
- R. Skomoski, RKKY interactions between nanomagnets of arbitrary shape, Europhys. Lett., 1999, 48, 455–460 CrossRef.
- A. H. Castro Neto, F. Guinea, N. M. R. Peres, K. S. Novoselov and A. K. Geim, The electronic properties of graphene, Rev. Mod. Phys, 2009, 81, 109–162 CrossRef CAS.
- S. Prasad and N. S. Gajbhiye, Magnetic studies of nanosized nickel ferrite particles synthesized by the citrate precursor technique, J. Alloys Compd., 1998, 265, 87–92 CrossRef CAS.
- R. N. Panda, J. C. Shih and T. S. Chin, Magnetic properties of nano-crystalline Gd- or Pr-substituted CoFe2O4 synthesized by the citrate precursor technique, J. Magn. Magn. Mater., 2003, 257, 79–86 CrossRef CAS.
- G. K. Williamson and W. H. Hall, X-ray line broadening from filed aluminium and wolfram, Acta Metall., 1953, 1, 22–31 CrossRef CAS.
- V. Hadjiev, M. Iliev and I. Vergilov, The Raman spectra of Co3O4, J. Phys. C: Solid State Phys., 1988, 21, L199–L201 CrossRef.
- R. Genc, M. O. Alas, E. Harputlu, S. Repp, N. Kremer, M. Castellano, S. G. Colak, K. Ocakoglu and E. Erdem, High-Capacitance Hybrid Supercapacitor Based on Multi-Colored Fluorescent Carbon-Dots, Sci. Rep., 2017, 7, 11222 CrossRef PubMed.
- A. Bateni, E. Erdem, S. Repp, S. Acar, I. Kokal, W. Häßler, S. Weber and M. Somer, Electron paramagnetic resonance and Raman spectroscopy studies on carbon-doped MgB2 superconductor nanomaterials, J. Appl. Phys., 2015, 117, 153905 CrossRef.
- S. Sarkar, A. Mondal, K. Dey and R. Ray, Defect driven tailoring of colossal dielectricity of Reduced Graphene Oxide, Mater. Res. Bull., 2016, 74, 465–471 CrossRef CAS.
- S. R. Gawali, A. C. Gandhi, S. S. Gaikwad, J. Pant, T. Chan, C.-L. Cheng, Y.-R. Ma and S. Yun Wu, Role of cobalt cations in short range antiferromagnetic Co3O4 nanoparticles: a thermal treatment approach to affecting phonon and magnetic properties, Sci. Rep., 2018, 8, 249 CrossRef.
- M. Sasaki, P. E. Jönsson, H. Takayama and H. Mamiya, Aging and memory effects in superparamagnets and superspin glasses, Phys. Rev. B: Condens. Matter Mater. Phys., 2005, 71, 104405 CrossRef.
- Y. Sun, M. B. Salamon, K. Garnier and R. S. Averback, Memory Effects in an Interacting Magnetic Nanoparticle System, Phys. Rev. Lett., 2003, 91, 167206 CrossRef PubMed.
- M. Ulrich, J. García-Otero, J. Rivas and A. Bunde, Slow relaxation in ferromagnetic nanoparticles: indication of spin-glass behavior, Phys. Rev. B: Condens. Matter Mater. Phys., 2003, 67, 024416 CrossRef.
- S. Biswas, Sk. Sabyasachi, A. Bhaumik and R. Ray, Magnetic Memory Effects in Fe/γ-Fe2O3 Nanostructures, IEEE Trans. Magn., 2014, 50(3), 2301107 Search PubMed.
- S. Sarkar, A. Mondal, K. Dey and R. Ray, Magnetic memory in nanocrystalline α-Fe2O3 embedded in reduced graphene oxide, RSC Adv., 2015, 5, 81260–81265 RSC.
- T. Mousavand, T. Naka, K. Sato, S. Ohara, M. Umetsu, S. Takami, T. Nakane, A. Matsushita and T. Adschiri, Crystal size and magnetic field effects in Co3O4 antiferromagnetic nanocrystals, Phys. Rev. B: Condens. Matter Mater. Phys., 2009, 79, 144411 CrossRef.
- V. Bisht and K. P. Rajeev, Unusual superparamagnetic behavior of Co3O4 nanoparticles, arXiv:1008.5245v2 [cond-mat.mes-hall] 2 Sep 2010.
- S. Giri, M. Patra and S. Majumdar, Exchange bias effect in alloys and compounds, J. Phys.: Condens. Mater., 2011, 23, 073201 CrossRef CAS.
- S. Ye, S. P. Pati, Y. Shiokawa, M. Al-Mahdawi, T. Nozaki and M. Sahashi, Observation of perpendicular exchange bias in an Ir-doped Fe2O3/Co ultrathin film system, Phys. Chem. Chem. Phys., 2017, 19, 8188–8193 RSC.
| This journal is © the Owner Societies 2019 |


