The effect of nanoconfinement on the glass transition temperature of ionic liquids†
Yuchen
Zuo
,
Yuanzhong
Zhang
,
Rundong
Huang
and
Younjin
Min
 *
*
Department of Polymer Engineering, University of Akron, Akron, Ohio, 44325, USA. E-mail: ymin@uakron.edu; younjinmin@gmail.com
First published on 23rd November 2018
Abstract
This work is concerned with investigating the glass transition behavior of ionic liquids as a function of nanoconfinement. The glass transition temperature was found to increase with a decrease in confinement length, below a critical confinement of 40–50 nm and 80–90 nm for 1-butyl-3-methylimidazolium tetrafluoro-borate and 1-methyl-3-octylimidazolium tetrafluoro-borate between alumina surfaces, respectively.
Ionic liquids (ILs), which are organic salts consisting entirely of ions with a melting point below 100 °C, have recently received increasing attention from the scientific community owing to their intriguing properties such as negligibly low vapor pressure, fire resistance, tuneable polarity and phase behavior, excellent chemical and thermal stability, and wide electrochemical windows.1,2 These beneficial properties of ILs have resulted in their implementation and consideration in catalysis, chemical separation, hazardous chemical storage and transportation, battery technologies, supercapacitors, fuel cells, dye sensitized solar cells, thermo-electrochemical devices, lubrication, thermal storage, and carbon dioxide capture and separation, and their applications continue to expand.3,4 Many of these applications involve the utilization of IL thin films or nanoconfined ILs rather than a bulk solvent. For instance, when used as electrolytes, the ILs are used to transport ions across the nanoporous channels of electrodes.5 IL lubricants are utilized to protect sliding surfaces against wear and damage and to decrease the coefficient of friction at varying loads, some of which can result in surface separation less than a few hundred nanometers.6,7 In IL-based dye-sensitized solar cells, the photoanode involves a nanostructured wide band-gap semiconductor which is coated with a monolayer of an organometallic or organic dye in a thin film geometry.8,9 ILs mediate the electron transport between the active nanostructured surface and the cathode.
The glass transition temperature (Tg), the onset of extensive molecular mobility and long-range transport, is an important property influencing the function, performance, and operational range of thin film devices. Glass transitions are often characterized with very sluggish liquid dynamics induced by the formation of cooperatively rearranging regions (CRRs) with reduced local entropy.10–12 The length scale of CRRs has been calculated/measured to be in the order of 1–4 nm via the random first-order transition theory of glasses,11 nuclear magnetic resonance (NMR) studies,10 and the atomic force microscopy (AFM) technique monitoring polarization fluctuations.13
Prior studies with simple fluids and polymers revealed that Tg under nanoconfined geometries deviates from that under bulk conditions.14–18 The critical characteristic length below which there exists a difference between Tg under confined and bulk conditions signifies the onset of the breakdown of continuum behaviors in glass transition. For simple organic liquids, the critical confinement giving rise to noticeable shifts in Tg (>1 °C) ranges from several to several tens of nanometres (<75 nm).19–21 For polymers, confinement levels below 100 nm tend to result in deviations in the glass transition temperature compared to the bulk.22,23 Such deviations are ascribed to a combination of phenomena: the increased relative contribution of the interfacial effects (i.e., liquid–solid or liquid–gas interface associated with confinement) to the free energy of the system;24 the overlap of the density distribution function of molecules/macromolecules leading to structural frustrations and orientational transitions to minimize the potential of mean force under nanoconfinement;25 changes in the size of CRRs under confinement;21 and confinement-induced entropy loss.26 As the film thickness and confinement length scale decrease, a decrease or increase in the glass transition temperature has been observed in the literature for various simple fluids and polymers,22,25 governed by the interplay among the above-mentioned effects. While there exists a large body of literature on the nanoconfinement effects on the glass transition temperature of simple fluids and polymers, similar studies focusing on ILs are lacking.
This work is aimed at determining the confinement length scale below which the glass transition temperature deviates from the one measured in bulk for ILs and whether ILs exhibit a depression or an enhancement in the glass transition temperature under nanoconfined geometries and gaining insights into the interfacial processes controlling the critical confinement length for ILs. To this end, we have relied on nanoporous templates of very systematically varied pore sizes in modulated differential scanning calorimetry (MDSC) studies with two types of ionic liquids (1-butyl-3-methylimidazolium tetrafluoroborate, [C4mim+][BF4−] and 1-methyl-3-octyl-imidazolium tetrafluoroborate, [C8mim+][BF4−]).
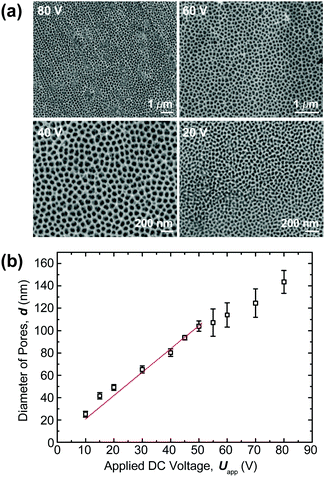
To derive unambiguous correlations between the nanoconfinement level (pore size) and Tg, it is crucial to utilize templates with narrow size distribution having a small coefficient of variation (i.e., the ratio of the standard deviation to the mean). For this purpose, porous anodic alumina (PAA) membranes were prepared using a two-step anodization process27 (see ESI† for details). Fig. 1a shows the scanning electron microscopy (SEM) micrographs of nanoporous templates as a function of bias DC voltage. A linear relationship between the applied voltage and the mean pore diameter was observed below 50 V while a sublinear behavior became noticeable at the higher voltages (Uapp > 50 V) (Fig. 1b). Such a linear trend can be explained via electric field enhanced electrochemical reactions at the electrolyte/alumina and alumina/aluminium interfaces.28 For large electric fields, ionic mobility is sterically hindered by the crowding effect,29 which may account for the sublinear behavior.
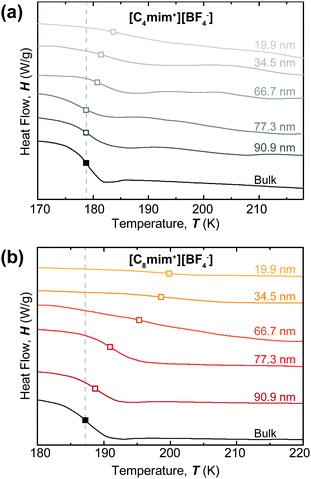
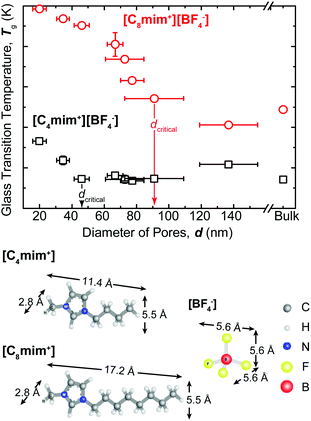
After preparing nanoporous templates of systematically varied sizes, we filled these nanotemplates with [C4mim+][BF4−] or [C8mim+][BF4−] for thermal characterization using MDSC. The Tg under bulk conditions was measured to be 178.7 ± 0.2 K and 187.2 ± 0.2 K for [C4mim+][BF4−] and [C8mim+][BF4−], respectively (Fig. 2). The Tg shifted to higher temperatures when the degree of nanoconfinement increased (the pore size decreased) for both types of ILs. The shift in Tg was more pronounced for the case of [C8mim+][BF4−]. To better understand the relationship between Tg and the confinement length, the glass transition temperature was determined from the first derivative of the MDSC curves shown in Fig. 2 and plotted against the pore diameter (Fig. 3).
The maximum shift in Tg was 4.3 K for [C4mim+][BF4−] while it was 12.5 K for [C8mim+][BF4−]. The critical distance below which the nanoconfined ILs deviated from bulk ILs in terms of the glass transition temperature (dcritical) was about 40–50 nm and 80–90 nm for [C4mim+][BF4−] and [C8mim+][BF4−], respectively.
The increase in the glass transition temperature can be attributed to the strong attractive interactions between alumina, which bears a positive surface potential in polar solvents, and charged building blocks of ILs, i.e. [BF4−]. The attractive interactions favour a closer packing of molecules (i.e., more ordered configuration) in the proximity to the confining surfaces to minimize the free energy of the system. The fact that for a given degree of confinement, the larger shifts were observed in Tg of [C8mim+][BF4−] compared to that of [C4mim+][BF4−] is presumably owing to the size effect ([C8mim+] is 17.2 Å × 5.5 Å versus [C4mim+] 11.4 Å × 5.5 Å. See Fig. 3). When confined into the spacing corresponding to several numbers (layers) of ion pairs between solid surfaces, ILs can behave very differently from the bulk, exhibiting oscillatory forces induced by the overlap of the density distribution function.30–33 The decay distance of oscillatory forces increases with increasing molecular dimension. Hence, for a fixed length scale, the larger molecules can experience a stronger orientational organization upon confinement. However, the critical confinement length below which the continuum behavior of Tg breaks down is still much larger than the range of oscillatory forces. It is reasonable to consider another length scale controlling the molecular ordering of ILs near the charged surface: i.e. the Debye length. In our recent studies with surface forces apparatus, we measured the Debye length of [C4mim+][BF4−] or [C8mim+][BF4−] to be 13.3 ± 1.0 nm and 19.2 ± 0.5 nm, respectively (manuscript under review). Given that the dcritical corresponds to only a few multiples of the Debye length, it is likely that the Debye length has stronger control over the critical confinement distance.
We also note that some prior publications reported that there are two glass transition temperatures for nanoconfined supercooled fluids: one is associated with the confined molecules located at distances greater than the range of oscillations in the radial distribution function away from the surface and another is associated with the confined molecules located at distances that are smaller than the range of oscillations in the radial distribution function away from the surface.34,35 For most ionic liquids, the range of oscillations in the radial distribution function away from the surface is less than 5 nm.35,36 The minimum confinement gap (i.e. the pore size of a PAA membrane), we used in this study is about 20 nm. Hence, the amount of confined molecules present “in the interfacial region near the confining surface, displaying the interfacial effects” becomes relatively small compared to that of the molecules present “away from the confining surface, lacking the interfacial effects”. Hence, considering this relative mass/volume ratio of ILs presents near and away from the confining surfaces, it would be challenging to clearly distinguish and assign two separate Tg peaks in this study.
Our key findings can be summarized as follows: The glass transition temperature of ILs increases with a decrease in confinement length. The smaller molecules experience smaller confinement-induced shifts in the glass transition temperature for a given degree of confinement. The critical confinement length below which there exists a deviation in the glass transition temperature under confined and bulk conditions is about 40–50 nm and 80–90 nm for [C4mim+][BF4−] and [C8mim+][BF4−], respectively, between the confining porous anodic alumina surfaces.
Conflicts of interest
There are no conflicts to declare.Acknowledgements
Y. M., R. H., Y. Z., and Y. C. acknowledge funding from the National Science Foundation (NSF-CBET Award No. 1511626) and the American Chemical Society (ACS PRF Award No. 55789-DNI10).Notes and references
- T. D. Ho, C. Zhang, L. W. Hantao and J. L. Anderson, Anal. Chem., 2013, 86, 262–285 CrossRef PubMed.
- T. Torimoto, T. Tsuda, K. Okazaki and S. Kuwabata, Adv. Mater., 2010, 22, 1196–1221 CrossRef CAS PubMed.
- D. R. MacFarlane, N. Tachikawa, M. Forsyth, J. M. Pringle, P. C. Howlett, G. D. Elliott, J. H. Davis, M. Watanabe, P. Simon and C. A. Angell, Energy Environ. Sci., 2014, 7, 232–250 RSC.
- G. G. Eshetu, M. Armand, H. Ohno, B. Scrosati and S. Passerini, Energy Environ. Sci., 2016, 9, 49–61 RSC.
- M. Galiński, A. Lewandowski and I. Stępniak, Electrochim. Acta, 2006, 51, 5567–5580 CrossRef.
- F. Zhou, Y. Liang and W. Liu, Chem. Soc. Rev., 2009, 38, 2590–2599 RSC.
- H. Kamimura, T. Kubo, I. Minami and S. Mori, Tribol. Int., 2007, 40, 620–625 CrossRef CAS.
- S. Ito, S. M. Zakeeruddin, P. Comte, P. Liska, D. Kuang and M. Grätzel, Nat. Photonics, 2008, 2, 693 CrossRef CAS.
- F. Fabregat-Santiago, J. Bisquert, E. Palomares, L. Otero, D. Kuang, S. M. Zakeeruddin and M. Grätzel, J. Phys. Chem. C, 2007, 111, 6550–6560 CrossRef CAS.
- U. Tracht, M. Wilhelm, A. Heuer, H. Feng, K. Schmidt-Rohr and H. W. Spiess, Phys. Rev. Lett., 1998, 81, 2727 CrossRef CAS.
- J. D. Stevenson, J. Schmalian and P. G. Wolynes, Nat. Phys., 2006, 2, 268 Search PubMed.
- M. Mézard and G. Parisi, J. Phys.: Condens. Matter, 1999, 11, A157 CrossRef.
- E. V. Russell and N. E. Israeloff, Nature, 2000, 408, 695 CrossRef CAS PubMed.
- D. Hudzinskyy, A. V. Lyulin, A. R. C. Baljon, N. K. Balabaev and M. A. J. Michels, Macromolecules, 2011, 44, 2299–2310 CrossRef CAS.
- Y. Rharbi, Phys. Rev. E: Stat., Nonlinear, Soft Matter Phys., 2008, 77, 31806 CrossRef PubMed.
- R. J. Lang and D. S. Simmons, Macromolecules, 2013, 46, 9818–9825 CrossRef CAS.
- M. D. Ediger and J. A. Forrest, Macromolecules, 2013, 47, 471–478 CrossRef.
- C. J. Ellison, M. K. Mundra and J. M. Torkelson, Macromolecules, 2005, 38, 1767–1778 CrossRef CAS.
- C. L. Jackson and G. B. McKenna, J. Non-Cryst. Solids, 1991, 131, 221–224 CrossRef.
- G. Barut, P. Pissis, R. Pelster and G. Nimtz, Phys. Rev. Lett., 1998, 80, 3543 CrossRef CAS.
- S. H. Anastasiadis, K. Karatasos, G. Vlachos, E. Manias and E. P. Giannelis, Phys. Rev. Lett., 2000, 84, 915 CrossRef CAS PubMed.
- J. A. Torres, P. F. Nealey and J. J. De Pablo, Phys. Rev. Lett., 2000, 85, 3221 CrossRef CAS PubMed.
- K. Fukao and Y. Miyamoto, Phys. Rev. E: Stat. Phys., Plasmas, Fluids, Relat. Interdiscip. Top., 2000, 61, 1743 CrossRef CAS.
- M. Alcoutlabi and G. B. McKenna, J. Phys.: Condens. Matter, 2005, 17, R461 CrossRef CAS.
- J. D. McCoy and J. G. Curro, J. Chem. Phys., 2002, 116, 9154–9157 CrossRef CAS.
- P. K. Gupta and J. C. Mauro, J. Non-Cryst. Solids, 2009, 355, 595–599 CrossRef CAS.
- J. H. Yuan, F. Y. He, D. C. Sun and X. H. Xia, Chem. Mater., 2004, 16, 1841–1844 CrossRef CAS.
- Z. Su and W. Zhou, Adv. Mater., 2008, 20, 3663–3667 CrossRef CAS.
- M. S. Kilic, M. Z. Bazant and A. Ajdari, Phys. Rev. E: Stat., Nonlinear, Soft Matter Phys., 2007, 75, 21502 CrossRef PubMed.
- S. Perkin, L. Crowhurst, H. Niedermeyer, T. Welton, A. M. Smith and N. N. Gosvami, Chem. Commun., 2011, 47, 6572–6574 RSC.
- D. Wakeham, R. Hayes, G. G. Warr and R. Atkin, J. Phys. Chem. B, 2009, 113, 5961–5966 CrossRef CAS PubMed.
- Y. Min, M. Akbulut, J. R. Sangoro, F. Kremer, R. K. Prud’homme and J. Israelachvili, J. Phys. Chem. C, 2009, 113, 16445–16449 CrossRef CAS.
- J. Wu, T. Jiang, D. Jiang, Z. Jin and D. Henderson, Soft Matter, 2011, 7, 11222–11231 RSC.
- G. B. McKenna, Le J. Phys. IV, 2000, 10, Pr7-53 Search PubMed.
- R. Richert, Annu. Rev. Phys. Chem., 2011, 62, 65–84 CrossRef CAS PubMed.
- C. S. Perez-Martinez, A. M. Smith and S. Perkin, Phys. Rev. Lett., 2017, 119, 26002 CrossRef PubMed.
Footnote |
| † Electronic supplementary information (ESI) available: Materials, details of preparation of nanoporous templates, infiltration of ILs into templates, and differential scanning calorimetry measurements. See DOI: 10.1039/c8cp06479b |
| This journal is © the Owner Societies 2019 |


