CuO-Coated and Cu2+-doped Co-modified P2-type Na2/3[Ni1/3Mn2/3]O2 for sodium-ion batteries†
Rongbin
Dang
,
Qi
Li
,
Minmin
Chen
,
Zhongbo
Hu
and
Xiaoling
Xiao
 *
*
College of Materials Science and Opto-electronic Technology, University of Chinese Academy of Sciences, Beijing 100049, P. R. China. E-mail: xlxiao@ucas.ac.cn
First published on 24th November 2018
Abstract
Layered P2-type CuO-coated Na2/3[Ni1/3Mn2/3]O2 (NNMO@CuO) with excellent rate capability and cycling performance was investigated as a sodium-ion battery cathode material for the first time. The NNMO@CuO cathode material combines the advantages of CuO coating and Cu2+ doping. Transmission electron microscopy (TEM) images, TEM elemental line scan analysis and ex situ scanning electron microscopy (SEM) images show that CuO has been successfully coated on the particle surface uniformly, and that this CuO layer effectively suppresses the exfoliation of the metal oxide layers and unfavorable side reactions. Furthermore, Cu2+ is also partially incorporated into the host structure, according to the X-ray diffraction (XRD) patterns and refinement results. Although incorporated Cu2+ does not take part in the redox reactions of the battery cell, the refinement results indicate that the d-spacing of the Na+-ion diffusion layer is enlarged due to Cu2+ doping in the crystal structure, which results in better Na+ kinetics. Thus, the CuO-coated cathode material shows prominent cycling performance and rate capability. We believe that this CuO-coating and Cu2+-doping co-modification strategy provides a promising approach to designing advanced cathode materials for sodium-ion batteries.
1. Introduction
Lithium-ion batteries (LIBs) have experienced great success and have been commercialized for many applications over the past few decades.1–5 However, due to the relatively low abundance and ever-increasing cost of lithium, researchers have begun to pay lots of attention to sodium-ion batteries (SIBs) in recent years, due to the natural abundance of sodium and its similar electrochemistry to lithium.6,7 To date, many SIB cathode materials have been proposed, such as layered oxides,8 phosphates9 and Prussian blue.10In particular, layered-oxide P2-type Na2/3[Ni1/3Mn2/3]O2 (NNMO), with a high operating voltage, high capacity, low cost and ease of synthesis, has been considered to be a suitable SIB cathode material.11,12 When cycled in the range of 2.0–4.5 V, it can reversibly transfer all Na+ ions on account of the Ni2+/Ni4+ redox couple, resulting in an increased energy capacity of 160 mA h g−1.13,14 However, P2-type NNMO suffers from an undesired voltage plateau and severe capacity fading due to the P2–O2 phase transition and large volume change (more than 20%) when charged to 4.2 V.15,16 These defects greatly limit its application as a large-scale energy storage system (ESS).
In order to address these problems, cationic substitution may be an effective method to ameliorate the electrochemical properties of this material. Several researchers have doped Mg, Ti, Zn and Li into P2-type NNMO and the modified materials showed outstanding properties.14,17–19 For example, Guo et al. reported that substituting Ni2+ with Mg2+ can restrain the P2–O2 phase transition, and thus Na2/3[Ni1/3−xMgxMn2/3]O2 shows improved capacity retention.20 In some recent studies, applying a surface coating was found to be a promising strategy to enhance the electrochemical performance of P2-type NNMO. For instance, Liu et al. found that Al2O3-coated P2-type NNMO showed better cycling stability and capacity retention, as the Al2O3 layer effectively suppresses the exfoliation of the metal oxide layers and unfavorable side reactions.21
Recently, Hu et al. firstly demonstrated the invertible redox couple of Cu2+/Cu3+ in Na0.68Cu0.34Mn0.66O2 during cycling.22 Zheng et al. obtained Cu-substituted Na2/3Ni1/3−xCuxMn2/3O2 and found that both redox couples of Ni2+/Ni4+ and Cu2+/Cu3+ contributed to charge compensation and the cycling stability was significantly enhanced.15 Therefore, in this study, we choose CuO as a coating material, and hoped that CuO would not only stabilize the surface structure of the cathode material, but that some Cu2+ ions would also become incorporated into the crystal structure and take part in the redox reaction.
Here, the cathode material P2-type NNMO was modified with a CuO coating using a simple wet chemistry method for the first time. The P2-type NNMO material is air-stable and water cannot intrude into its structure, making it suitable for a wet chemistry surface coating.23 Our results show that coating with CuO can effectively hinder exfoliation of the metal oxide layer and enhance particle integrity. At the same time, X-ray diffraction (XRD) refinement results show that Cu2+ ions have been doped into the crystal structure. Surprisingly, Cu2+ ions do not take part in the redox reaction during cycling, according to the cyclic voltammetry (CV) curves and ex situ X-ray photoelectron spectroscopy (XPS) results. However, it is undeniable that the d-spacing of the Na+-ion diffusion layer is enlarged due to Cu2+ doping in the crystal structure, enhancing the Na+-ion diffusion coefficients. Thus, the CuO-coated and Cu2+-doped co-modified NNMO material exhibits excellent cycling stability and rate capability. For instance, the NNMO@CuO electrode can still deliver 63.7% of the initial capacity at a high current density of 5C, while this value is 45% for the pristine electrode.
2. Experimental
2.1. Preparation of materials
A solid-state reaction was employed to make P2-type NNMO. A mixture of stoichiometric amounts of Ni(Ac)2·4H2O, Mn(Ac)2·4H2O and NaAc·2H2O (excess 5%) was ball-milled for 5 h with acetone as the dispersant, followed by drying at 80 °C for 1 h. The mixture was heated to 500 °C for 5 h, then sintered at 950 °C for 10 h, followed by annealing at 700 °C for 10 h with a heating rate of 3 °C min−1. The mixture was then quenched to room temperature.The CuO layer (5 wt% of the total mass) was coated onto the NNMO sample via a wet chemistry approach. A stoichiometric amount of Cu(NO3)2 was added to deionized water to form a solution, and the NNMO powder was poured into the solution with continuous stirring, before the solution was evaporated to dryness. The obtained mixture was sintered at 200 °C for 10 h and 650 °C for 10 h.
2.2. Material characterization
XRD patterns were all collected using a Rigaku Smartlab diffractometer with a Cu Kα radiation source in the range of 10–80° at a rate of 10° min−1. The surface morphology of the samples was studied using scanning electron microscopy (SEM) (Hitachi SU8010) and transmission electron microscopy (TEM) (FEI Tecnai G2 F20). The elemental line scan was obtained using TEM. X-ray photoelectron spectroscopy (XPS) spectra were obtained using Al Kα X-ray radiation on a Thermo Scientific ESCALAS 250Xi.2.3. Electrochemical measurements
The electrodes were prepared by mixing active material, carbon black and poly vinylidene fluoride (PVDF) in a mass ratio of 75![[thin space (1/6-em)]](https://www.rsc.org/images/entities/char_2009.gif) :
:![[thin space (1/6-em)]](https://www.rsc.org/images/entities/char_2009.gif) 15
15![[thin space (1/6-em)]](https://www.rsc.org/images/entities/char_2009.gif) :
:![[thin space (1/6-em)]](https://www.rsc.org/images/entities/char_2009.gif) 10 on Al foil in NMP (N-methyl-2-pyrrolidione), followed by vacuum-drying at 120 °C for 12 h. Coin cells (CR2025) were assembled in an Ar-filled glove box in Na half cells with a porous glass fiber as a separator. 1 M NaClO4 in a mixture of polycarbonate (PC) with 5 vol% fluoroethylene carbonate (FEC) was used as the electrolyte. The cells were cycled on a NEWARE battery test system in the voltage range of 2.5–4.3 V at room temperature. Cyclic voltammetry (CV), electrochemical impedance spectroscopy (EIS) and potentiostatic intermittent titration technique (PITT) were conducted using an electrochemical analyzer Metrohm Autolab instrument.
10 on Al foil in NMP (N-methyl-2-pyrrolidione), followed by vacuum-drying at 120 °C for 12 h. Coin cells (CR2025) were assembled in an Ar-filled glove box in Na half cells with a porous glass fiber as a separator. 1 M NaClO4 in a mixture of polycarbonate (PC) with 5 vol% fluoroethylene carbonate (FEC) was used as the electrolyte. The cells were cycled on a NEWARE battery test system in the voltage range of 2.5–4.3 V at room temperature. Cyclic voltammetry (CV), electrochemical impedance spectroscopy (EIS) and potentiostatic intermittent titration technique (PITT) were conducted using an electrochemical analyzer Metrohm Autolab instrument.
3. Results and discussion
3.1. Characterization of materials
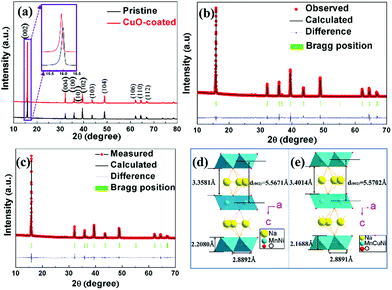
Fig. 1a shows the XRD patterns of pristine and CuO-coated cathode materials, and the main diffraction peaks agree well with the hexagonal system and P63/mmc space group.24 Fig. S1 (ESI†) exhibits the magnified XRD pattern of the NNMO@CuO sample in the range of 37°–41°; the characteristic peaks for CuO at around 38.7° can be obviously observed. Therefore, it can be concluded that CuO is formed on the surface of NNMO. Fig. 1a (inset) shows enlarged XRD patterns of the pristine and CuO-coated samples between 15 and 17°. For the NNMO@CuO sample, the low angle (002) peak shifts to the left, indicating an increase in the interplanar distance of the d(002) peak. This may be caused by the incorporation of Cu2+ ions into the host structure as dopant ions, because Cu2+ ions have a larger ionic radius of 0.73 Å compared to Ni2+ (0.69 Å) and Mn4+ (0.53 Å).The XRD data was further analyzed using Rietveld refinement to obtain the lattice parameters of the pristine NNMO and NNMO@CuO samples. The refinement results are acceptable as the Refinement factors (Rp% and Rwp%) are less than 10. The results are shown in Fig. 1b and c, Table 1 and Tables S1, S2 (ESI†). According to refined crystallographic parameters, dopant Cu2+ ions mainly occupy the transition metal (TM) ion sites. The doping with Cu2+ ions is also revealed by the increase of the lattice parameter c. The lattice parameter c for NNMO@CuO is 11.1403(9) Å, while the value for NNMO is 11.1322(9) Å. In the P2-type crystal structure, there are two prismatic sites named Naf and Nae that share face-to-face or edge-to-edge sites with MO6 octahedra.25,26 The Nae site is preferentially occupied by a larger number of Na+ ions, which could diminish the strong electrostatic repulsion between neighboring Na+ ions. The increased lattice constant c could reduce the repulsion between Na+ ions at Naf sites and adjacent TMs.15 As a result, more Na+ ions occupy the Naf sites. Berthelot et al. reported that Naf sites are more stable than Nae sites, based on a study of P2-NaxCoO2 materials.26 Thus, an increased lattice constant c can result in a more stable material structure.27 The atomic compositions and content of the NNMO and NNMO@CuO samples were analyzed using ICP tests, as shown in Table S3 (ESI†). The molar ratios of Na, Ni and Mn are close to the theoretical ratios, which are also close to the refinement results. In addition, the molar ratio of Cu is 0.075, and it is near the weight ratio of 5 wt%.
| Sample | a (Å) | c (Å) | V (Å3) | d (002) (Å) | Slab (Å) | Interslab (Å) | Fitting factors (%) |
|---|---|---|---|---|---|---|---|
| Pristine | 2.8892(2) | 11.1322(9) | 80.48(1) | 5.5661 | 2.2080 | 3.3581 | R p: 4.41 Rwp: 7.03 |
| CuO-coated | 2.8891(2) | 11.1403(9) | 80.53(1) | 5.5702 | 2.1688 | 3.4014 | R p: 4.80 Rwp: 7.27 |
The crystal structures of the pristine and CuO-coated samples were established in terms of the refinement results, as shown in Fig. 1d and e. The d-spacing of the d(002) peak (5.5702 Å) in the CuO-coated sample is larger than that of the pristine sample (5.5671 Å), in agreement with the shift of the (002) peak towards a lower angle. Furthermore, the thickness of the slabs (TMO2 sheets) and Na+-ion layers (interslabs) can be quantitatively calculated based on the crystal structure, according to the following eqn (1) and (2):
| d(002) = d(slab) + d(interslab) | (1) |
| d(slab) = 2d(002) − (1 − 2Zox)c | (2) |
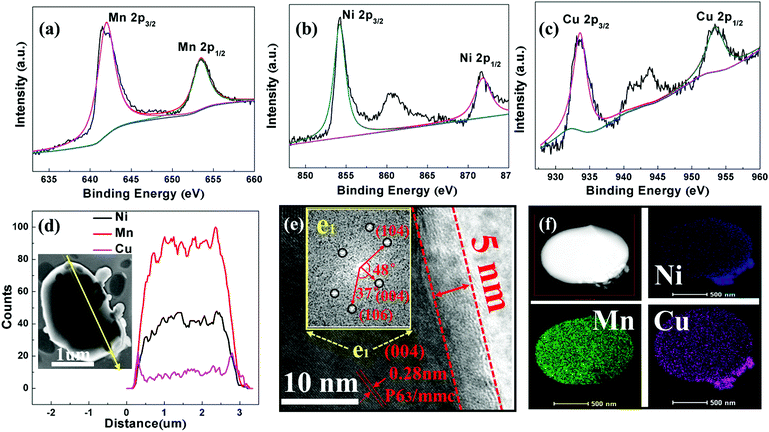
Fig. 2a–c present the fitting results of the XPS spectra of the elements Ni, Mn and Cu on the surface of the NNMO@CuO sample. The oxidation states of the TM elements are Ni (2+), Mn (4+) and Cu (2+) with binding energies of 854.3, 641.8 and 933.3 eV, respectively. The Ni 2p3/2 and Mn 2p3/2 photoelectron spectra for NNMO are shown in Fig. S2 (ESI†), and the corresponding valences of Ni and Mn are 2+ and 4+ with peaks at 854.2 and 641.8 eV, respectively. It can be concluded that CuO is perfectly formed and its presence does not influence the oxidation of Ni or Mn in the CuO@NNMO sample.
SEM and TEM were performed to survey the morphologies and surface microstructures of the prepared samples. SEM images of the as-prepared samples are presented in Fig. S3 (ESI†). All samples show plate-like hexagonal morphology with sizes ranging from 0.8 to 1.2 μm, demonstrating good crystallinity. Moreover, in Fig. S3b (ESI†), some unbonded smaller particles are seen, which may be CuO particles. This is a normal phenomenon due to the weak bonding between the CuO and NNMO host material. Fig. 2d shows the line scan of the NNMO@CuO sample. The elemental line scans of Mn and Ni show homogeneity on the particle surface, while Cu is mainly distributed on the margin of the particle, which also directly demonstrates that CuO has been coated on the surface of the NNMO material. From the TEM image of the CuO-coated sample (Fig. 2e), a CuO layer of about 5 nm is clearly observed on the NNMO surface. An interplanar spacing of 0.28 nm belonging to the (004) plane of Na2/3Ni1/3Mn2/3O2 can be observed, which is consistent with the FFTs results of the selected e1 area (inset). Fig. 2f presents the HAADF-STEM and elemental mapping images of the NNMO@CuO sample. It can be seen that Ni, Mn and Cu elements are dispersed on the particles uniformly, suggesting that the CuO layer has been successfully coated on the NNMO particle surfaces evenly.
3.2. Electrochemical performance
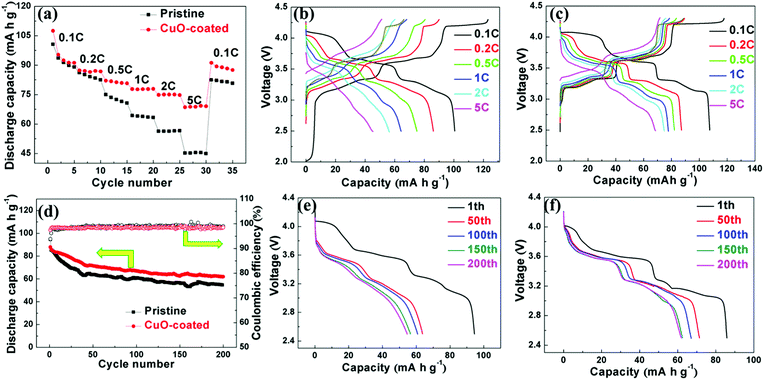
All the electrodes were galvanostatically cycled to investigate the cycling performance and rate capability between 2.5 and 4.3 V. The rate capabilities of the pristine NNMO and NNMO@CuO samples were analyzed at current densities from 0.1 to 5C (1C = 173 mA g−1), as depicted in Fig. 3a. The NNMO@CuO electrode exhibits a remarkable rate capability compared with NNMO at various rates.The NNMO sample displays specific capacities of 101, 86, 75, 64, 56 and 45 mA h g−1 at rates of 0.1, 0.2, 0.5, 1, 2 and 5C, respectively, whereas the NNMO@CuO sample exhibits improved specific capacities of 107, 87, 82, 78, 75 and 69 mA h g−1, respectively. When the rate returns to 0.1C after the rate capability tests, the discharge capacity of the pristine and CuO-coated samples are 82 and 91 mA h g−1, amounting to 82% and 85% of the initial capacity, respectively. This suggests a reversible Na+ insertion/extraction in the two samples.
Fig. 3b and c display the galvanostatic charge/discharge curves of the NNMO and NNMO@CuO electrodes corresponding to the rate capability at different current densities, clearly exhibiting the sodiation/desodiation process. The NNMO electrode shows an initial charge capacity of 123 mA h g−1, with three distinct voltage plateaus at 3.35 V, 3.7 V and 4.2 V during the first charge process.25,29 The voltage plateaus below 4.0 V are linked closely with Na+/vacancy ordering and the stacking faults result from transition metal layer gliding. The long plateau at 4.2 V is due to the reversible P2–O2 phase transition, which is the main reason behind the irreversible capacity loss.30,31 The outstanding rate capability of the NNMO@CuO electrode can be ascribed to the increased Na+-ion diffusion kinetics, which originates from the enlarged Na+-ion layers when Cu2+ is doped into the crystal structure.
Fig. 3d shows the cycling performance of the NNMO and NNMO@CuO electrodes at a rate of 0.5C. The pristine electrode suffers from severe capacity fading during the long cycles. To be specific, the pristine material delivers a discharge capacity of 54 mA h g−1 after the 200th cycle with a 57.4% retention of the initial capacity. In contrast, the CuO-coated material shows a discharge capacity of 62 mA h g−1 after the same number of cycles, with a 70.5% retention of the initial capacity. Fig. 3d also shows the coulombic efficiency of the NNMO and NNMO@CuO electrodes. The initial efficiency of the NNMO electrode is 93%, which then rises to about 100% during the subsequent cycles. By comparison, the CuO-coated electrode attains 97% initial coulombic efficiency and then rises to about 99% during the subsequent cycles. Fig. 3e and f display the discharge curves of the NNMO and NNMO@CuO electrodes corresponding to cycling performance at different cycles, which obviously exhibit capacity and voltage degradation during the cycling process. It can also be seen that the CuO-coated electrodes have better capacity retention compared with the pristine material. The CuO layer enhances particle integrity and suppresses side reactions. Meanwhile, the Cu2+ dopant improves the crystal structure stability, as it shortens the bond distance between the TM and O atoms, according to the refinement results. These energetic effects of the CuO coating and Cu2+ doping can account for the better cycling stability of the NNMO@CuO electrode.
Fig. S4 (ESI†) exhibits the cycle stability of the NNMO and NNMO@CuO electrodes at a high current density of 865 mA g−1 (5C). The NNMO@CuO presents a higher capacity of 70 mA h g−1 after 200 cycles compared with 59 mA h g−1 for the pristine NNMO. Furthermore, the initial coulombic efficiency of the CuO-coated electrode is 93% and quickly reaches about 100% in the following cycles. In contrast, the pristine electrode exhibits an initial coulombic efficiency of 90%. The enhanced reversible capacity may be due to the fact that the CuO coating and Cu2+ doping stabilizes the crystal structure and the NNMO@CuO electrode can exchange more Na+ ions at a defined current density with an increased Na+-ion diffusion coefficient.
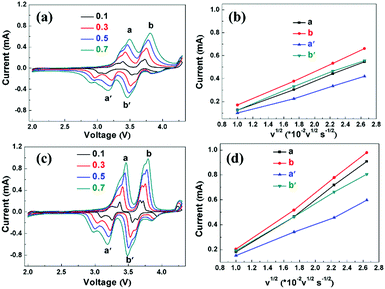
In order to study the effect of the CuO layer on the electrochemical behavior of the electrode, CV was applied to the pristine and CuO coated electrodes with Na counter electrode within the 2.5–4.3 V potential window at the rate of 0.1 mV s−1, as shown in Fig. S5a and b (ESI†). The reversible oxidation/reduction peaks at 3.5/3.2 V, 3.8/3.5 V, and 4.3/4.0 V are attributed to the sequential oxidation of Ni2+ to Ni3+ and Ni4+, respectively, which is the main source of the measured capacity.20 There is no Cu2+/Cu3+ oxidation or reduction peak detected at 4.1 V/3.9 V according to the report by Hu et al.22 Some small peaks are associated with the phase transformation during sodiation and desodiation.32,33 The difference between the oxidation and reduction peaks of Ni3+ and Ni4+ for the CuO-coated sample is slightly bigger than that of the pristine electrode, suggesting a relatively large polarization (Fig. S5c, ESI†). This may be due to the fact that the low-conductivity CuO layer hinders the migration of Na+ ions at the interface between the electrode and electrolyte. Furthermore, to confirm that the CuO-coated electrode has faster Na+ diffusion kinetics, CV curves of the NNMO and NNMO@CuO electrodes at different scan rates of 0.1, 0.3, 0.5 and 0.7 mV s−1 were obtained, as shown in Fig. 4a and c. Fig. 4b and d show the linear relationship between the marked peak current and the square root of the scanning rate (v1/2) for the NNMO and NNMO@CuO electrodes. It can be seen that the square root of the scanning rates (v1/2) has a good linear relationship with the peak current value (ip), indicating a diffusion-controlled process. Thus, the Na+ diffusion coefficient (DNa+) can be calculated by using the following equation: ip = 2.69 × 10⁵n3/2AD1/2v1/2C. In this equation, n represents the number of electrons per reaction. A and C reflect the area of the electrode and the concentration of Na+ in the lattice, respectively.34Table 2 shows the corresponding Na+ diffusion coefficient (DNa+) and the slopes of the straight lines of Ipvs. v1/2. The average DNa+ values for the NNMO and NNMO@CuO samples are 3.40 × 10⁻¹² and 7.96 × 10⁻¹² cm2 s−1, respectively. It can be concluded that the CuO-coated electrode has faster Na+ diffusion kinetics, which benefits from the enlarged Na+-ion diffusion layers. Although the CuO layer with low electronic conductivity hinders the migration of Na+ ions to some extent, the thickness of CuO layer is very thin (about 5 nm). At the same time, Cu2+ doping increases the d-spacing of Na+-ion layer and promotes the diffusion of Na+ ions. Thus, the CuO-coated and Cu2+-doped co-modified P2-type NNMO cathode material shows faster Na+ diffusion kinetics and better rate capability, which agrees with the subsequent PITT results.
| Peak | NNMO | NNMO@CuO | ||
|---|---|---|---|---|
| D Na+ (×10−12, cm2 s−1) | Slope | D Na+ (×10−12, cm2 s−1) | Slope | |
| a | 3.33 | 0.25711 | 9.93 | 0.44377 |
| b | 4.89 | 0.2984 | 11.26 | 0.47256 |
| a′ | 1.91 | 0.19462 | 3.53 | 0.26464 |
| b′ | 3.49 | 0.26341 | 7.10 | 0.37523 |
| Average | 3.40 | 7.96 | ||
3.3. Mechanism analysis
Ex situ XPS was carried out to study the oxidation states of the electrode reaction during the charge/discharge process and the results are presented in Fig. 5a–c. The Ni 2p3/2 peak changed from 856.13 eV to 857.81 eV during charging process, and the Ni 2p3/2 peak shifted back to 856.47 eV when discharged to 2.5 V, representing an oxidation process of Ni2+ → Ni4+ → Ni2+. There were hardly any peak shifts for Mn 2p3/2 (∼642.21 eV) and Cu 2p3/2 (∼934 eV), which indicates that Mn and Cu do not take part in the redox reaction during the cycling process. This is consistent with the CV results discussed above.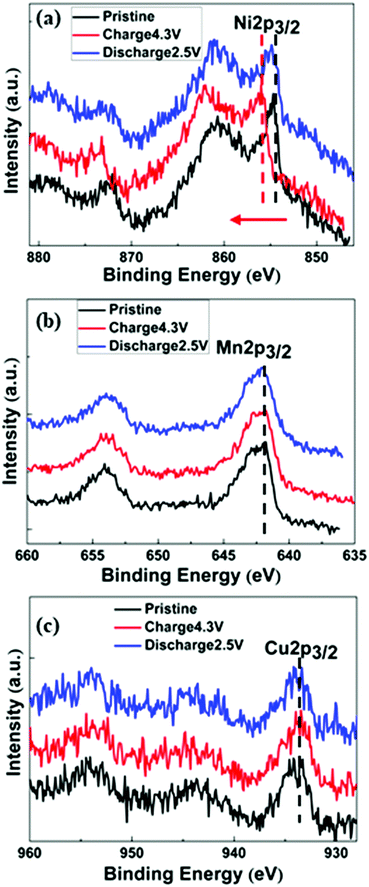 | ||
| Fig. 5 Ex situ XPS spectra during the first charge and discharge of NNMO@CuO for (a) Ni 2p3/2, (b) Mn 2p3/2, and (c) Cu 2p3/2 regions. | ||
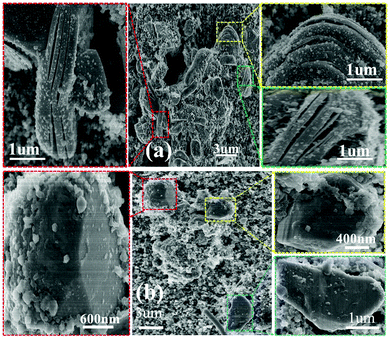
The above electrochemical performance has clearly demonstrated that the CuO layer ameliorated the electrochemical properties of the electrode material. The improved cycling stability can be ascribed to the particle stability, which can be verified by the ex situ SEM images collected after 200 cycles, as shown in Fig. 6a and b. After cycling, the pristine electrode shows obvious particle exfoliation after undergoing repeated sodiation and desodiation. This phenomenon agrees well with the work reported by Liu et al., who intensively studied the capacity decay mechanism of NNMO using SEM and TEM.21 The exfoliation phenomena are caused by the glide of the oxygen layers within the crystal structure.35,36 In contrast, the CuO-coated electrode maintains particle integrity and effectively hinders particle exfoliation during cycling. The XRD patterns of the NNMO and NNMO@CuO electrodes after 200 cycles were collected to investigate the structural changes of both the pristine and coated samples. Fig. S6b (ESI†) shows the XRD patterns of the fresh and post-cycling NNMO and NNMO@CuO electrodes. All the post-cycling XRD patterns reveal that the NNMO and NNMO@CuO electrodes maintained their P2-type structure after 200 cycles. In the enlarged XRD pattern (Fig. S6a, ESI†), the (002) peak of the post-cycling NNMO electrode drastically shifts to the left. This shift in the XRD pattern agrees well with the particle exfoliation phenomena, which is consistent with the study by Zhou and co-workers.21 This change in the XRD pattern shows that particle exfoliation is caused by lattice expansion. The (002) peaks of both the fresh and post-cycling NNMO@CuO electrodes exhibit a slight shift compared with that of the fresh NNMO electrode. This is a consequence of doping Cu2+ into the bulk structure, as discussed previously. In contrast, the XRD pattern of the post-cycling NNMO@CuO electrodes show almost no change compared with the XRD pattern of the fresh NNMO@CuO electrode. It can be concluded that the CuO layer effectively suppresses the particle exfoliation and prevents bulk structural damage from occurring during the long cycling process. The excellent cycling stability can be attributed to this particle stability.
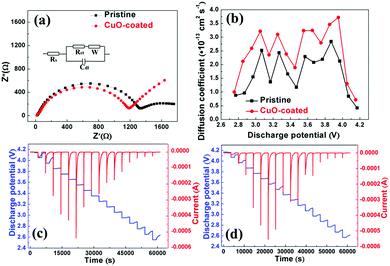
It is well known that faster Na+ diffusion is helpful for enhancing the rate capability of electrodes. Doped Cu2+ ions enlarge the d-spacing of the Na+-ion diffusion layer, according to previous XRD data analysis. For example, Li et al. studied Ni and Mg co-doped cathode materials with high rate performance and found that the enlargement of the d-spacing of the Na+-ion diffusion layer is responsible for the enhancement of the rate performance.17 EIS and PITT were also used to further verify this improved kinetic property. Fig. 7a shows the impedance spectra of pristine and CuO-coated electrodes after cycling as well as the equivalent circuit (inset). The Nyquist plots include a semicircle and a quasi-straight line, which mean charge transfer resistance (Rct) and Warburg impedance.37 The charge transfer resistance of the CuO-coated sample (1192.7 Ω) is smaller than that of the pristine sample (1378.2 Ω) (Table S4, ESI†). The NNMO@CuO electrode has a lower charge transfer resistance (Rct), which provides additional evidence that the CuO coating enhances charge transfer at the electrode/electrolyte interface. Furthermore, the CuO layer stabilizes the particle surface, consequently preventing severe damage to the SEI layer due to exfoliation of the NNMO@CuO electrode surface during prolonged cycling. The thin CuO layer hinders unwanted side reactions with the electrolyte and metal dissolution, by forming an effective protective layer on the surface of the electrode. This ultimately facilitates the smooth transfer of electrons during electrochemical cycling.
In addition, we wished to confirm that the increased d-spacings enhanced the Na+-ion diffusion coefficients. PITT was performed to further determine the Na+-ion diffusion coefficients for the pristine and CuO-coated electrodes. The cells were activated in two cycles at a rate of 0.1C between 2.5 and 4.3 V at room temperature, and then PITT was used for a potential step of 0.1 V on the discharge process. The PITT results for the NNMO and NNMO@CuO electrodes are shown in Fig. 7c and d. Assuming that Na+-ion transport obeys Fick's second law,38 the Na+-ion diffusion coefficients can be calculated by using the following equation:
4. Conclusions
In summary, NNMO@CuO has been successfully prepared using a simple method. The CuO-coated and Cu2+-doped co-modified P2-type NNMO shows better cycling stability, rate capability and discharge capacity, which can be attributed to the following reasons: (1) the CuO layer prevents particle exfoliation phenomena and enhances particle structural stability, while also hindering unwanted side reactions and reducing electrolyte decomposition at high potentials; (2) Cu2+ ions have been incorporated into the bulk structure and enlarge the d-spacing and lattice parameter c, resulting in faster Na+-ion diffusion and a more stable material structure. Thus, the CuO-coating and Cu2+-doping co-modification strategy provides a new way of designing high-performance cathode materials for sodium-ion batteries.Conflicts of interest
There are no conflicts of interest to declare.Acknowledgements
This work was supported by the Beijing Nova Program (Z141103001814065), the Youth Innovation Promotion Association CAS (2016152), and the Scientific Instrument Developing Project of the Chinese Academy of Sciences (Grant ZDKYYQ20170001).References
- M. Armand and J. M. Tarascon, Nature, 2008, 451, 652–657 CrossRef CAS PubMed.
- E. Zhao, L. Fang, M. Chen, D. Chen, Q. Huang, Z. Hu, Q.-b. Yan, M. Wu and X. Xiao, J. Mater. Chem. A, 2017, 5, 1679–1686 RSC.
- K. S. Kang, Y. S. Meng, J. Breger, C. P. Grey and G. Ceder, Science, 2006, 311, 977–980 CrossRef CAS PubMed.
- Y. K. Sun, S. T. Myung, B. C. Park, J. Prakash, I. Belharouak and K. Amine, Nat. Mater., 2009, 8, 320–324 CrossRef CAS PubMed.
- J. Xu, F. Lin, M. M. Doeff and W. Tong, J. Mater. Chem. A, 2017, 5, 874–901 RSC.
- M. D. Slater, D. Kim, E. Lee and C. S. Johnson, Adv. Funct. Mater., 2013, 23, 947–958 CrossRef CAS.
- V. Palomares, P. Serras, I. Villaluenga, K. B. Hueso, J. Carretero-Gonzalez and T. Rojo, Energy Environ. Sci., 2012, 5, 5884–5901 RSC.
- W.-L. Pang, X.-H. Zhang, J.-Z. Guo, J.-Y. Li, X. Yan, B.-H. Hou, H.-Y. Guan and X.-L. Wu, J. Power Sources, 2017, 356, 80–88 CrossRef CAS.
- B. L. Ellis, W. R. M. Makahnouk, Y. Makimura, K. Toghill and L. F. Nazar, Nat. Mater., 2007, 6, 749–753 CrossRef CAS PubMed.
- Y. Lu, L. Wang, J. Cheng and J. B. Goodenough, Chem. Commun., 2012, 48, 6544–6546 RSC.
- D. Yang, X.-Z. Liao, J. Shen, Y.-S. He and Z.-F. Ma, J. Mater. Chem. A, 2014, 2, 6723–6726 RSC.
- Z. H. Lu and J. R. Dahn, J. Electrochem. Soc., 2001, 148, A1225–A1229 CrossRef CAS.
- X. Fang, C. Shen, M. Ge, J. Rong, Y. Liu, A. Zhang, F. Wei and C. Zhou, Nano Energy, 2015, 12, 43–51 CrossRef CAS.
- X. Wua, J. Guo, D. Wang, G. Zhong, M. J. McDonald and Y. Yang, J. Power Sources, 2015, 281, 18–26 CrossRef.
- L. Zheng, J. Li and M. N. Obrovac, Chem. Mater., 2017, 29, 1623–1631 CrossRef CAS.
- D. H. Lee, J. Xu and Y. S. Meng, Phys. Chem. Chem. Phys., 2013, 15, 3304–3312 RSC.
- Z.-Y. Li, R. Gao, J. Zhang, X. Zhang, Z. Hu and X. Liu, J. Mater. Chem. A, 2016, 4, 3453–3461 RSC.
- P.-F. Wang, H.-R. Yao, X.-Y. Liu, Y.-X. Yin, J.-N. Zhang, Y. Wen, X. Yu, L. Gu and Y.-G. Guo, Sci. Adv., 2018, 4, eaar6018 CrossRef PubMed.
- J. Xu, D. H. Lee, R. J. Clément, X. Yu, M. Leskes, A. J. Pell, G. Pintacuda, X.-Q. Yang, C. P. Grey and Y. S. Meng, Chem. Mater., 2014, 26, 1260–1269 CrossRef CAS.
- P. F. Wang, Y. You, Y. X. Yin, Y. S. Wang, L. J. Wan, L. Gu and Y. G. Guo, Angew. Chem., Int. Ed., 2016, 55, 7445–7449 CrossRef CAS PubMed.
- Y. Liu, X. Fang, A. Zhang, C. Shen, Q. Liu, H. A. Enaya and C. Zhou, Nano Energy, 2016, 27, 27–34 CrossRef CAS.
- S.-Y. Xu, X.-Y. Wu, Y.-M. Li, Y.-S. Hu and L.-Q. Chen, Chin. Phys. B, 2014, 23 CAS.
- Z. H. Lu and J. R. Dahn, Chem. Mater., 2001, 13, 1252–1257 CrossRef CAS.
- H. V. Ramasamy, K. Kaliyappan, R. Thangavel, V. Aravindan, K. Kang, D. U. Kim, Y. Park, X. Sun and Y.-S. Lee, J. Mater. Chem. A, 2017, 5, 8408–8415 RSC.
- M. Guignard, C. Didier, J. Darriet, P. Bordet, E. Elkaim and C. Delmas, Nat. Mater., 2013, 12, 74–80 CrossRef CAS PubMed.
- R. Berthelot, D. Carlier and C. Delmas, Nat. Mater., 2011, 10, 74–80 CrossRef CAS PubMed.
- Y. Mo, S. P. Ong and G. Ceder, Chem. Mater., 2014, 26, 5208–5214 CrossRef CAS.
- Y. Gao, X. Wang, J. Ma, Z. Wang and L. Chen, Chem. Mater., 2015, 27, 3456–3461 CrossRef CAS.
- J.-H. Cheng, C.-J. Pan, J.-F. Lee, J.-M. Chen, M. Guignard, C. Delmas, D. Carlier and B.-J. Hwang, Chem. Mater., 2014, 26, 1219–1225 CrossRef CAS.
- S. Komaba, N. Yabuuchi, T. Nakayama, A. Ogata, T. Ishikawa and I. Nakai, Inorg. Chem., 2012, 51, 6211–6220 CrossRef CAS PubMed.
- Q. Yang, P.-F. Wang, J.-Z. Guo, Z.-M. Chen, W.-L. Pang, K.-C. Huang, Y.-G. Guo, X.-L. Wu and J.-P. Zhang, ACS Appl. Mater. Interfaces, 2018, 10, 34272–34282 CrossRef CAS PubMed.
- A. Caballero, L. Hernan, J. Morales, L. Sanchez, J. S. Pena and M. A. G. Aranda, J. Mater. Chem., 2002, 12, 1142–1147 RSC.
- P.-F. Wang, H.-R. Yao, X.-Y. Liu, J.-N. Zhang, L. Gu, X.-Q. Yu, Y.-X. Yin and Y.-G. Guo, Adv. Mater., 2017, 29 CAS.
- X.-H. Zhang, W.-L. Pang, F. Wan, J.-Z. Guo, H.-Y. Lu, J.-Y. Li, Y.-M. Xing, J.-P. Zhang and X.-L. Wu, ACS Appl. Mater. Interfaces, 2016, 8, 20650–20659 CrossRef CAS PubMed.
- J. Xu, D. H. Lee and Y. S. Meng, Funct. Mater. Lett., 2013, 6, 1330001 CrossRef.
- R. J. Clement, P. G. Bruce and C. P. Grey, J. Electrochem. Soc., 2015, 162, A2589–A2604 CrossRef CAS.
- R. Dang, M. Chen, Y. Lee, Y. Cheng, L. Xue, Z. Hu, X. Xiao and X. Huang, Electrochim. Acta, 2017, 247, 443–450 CrossRef CAS.
- E. Zhao, M. Chen, D. Chen, X. Xiao and Z. Hu, ACS Appl. Mater. Interfaces, 2015, 7, 27096–27105 CrossRef CAS PubMed.
- Z. G. Wu, J. T. Li, Y. J. Zhong, X. D. Guo, L. Huang, B. H. Zhong, D. A. Agyeman, J. M. Lim, D. H. Kim, M. H. Cho and Y. M. Kang, ACS Appl. Mater. Interfaces, 2017, 9, 21267–21275 CrossRef CAS PubMed.
Footnote |
| † Electronic supplementary information (ESI) available. See DOI: 10.1039/c8cp06248j |
| This journal is © the Owner Societies 2019 |

