Understanding the role of co-surfactants in microemulsions on the growth of copper oxalate using SAXS
Received
5th September 2018
, Accepted 27th November 2018
First published on 27th November 2018
Abstract
This study is an effort to understand the mechanism of the effect of the chain length of co-surfactants on the growth of copper oxalate inside the core of reverse micelles using small angle X-ray scattering (SAXS). In this study, we have used two different kinds of co-surfactants viz. 1-butanol (C4) and 1-octanol (C8) for the formation of the microemulsions. Time-dependent SAXS studies were carried out for these two systems. The data were analyzed using both the model-independent approach and model-dependent approach. For microemulsions containing only water inside the core of reverse micelles (no ions), the shape of the reverse micelles was observed to be ellipsoid and spherical in nature for 1-butanol and 1-octanol respectively. For a system containing copper oxalate nanostructures, the fitting was carried out using the ellipsoidal core–shell model for reverse micelles and spheres, ellipsoids and cylinders for copper oxalate nanostructures with 1-butanol as the co-surfactant. With 1-octanol as the co-surfactant, the two contributions that were used were the spherical core–shell model for reverse micelles and spheres for copper oxalate nanostructures. Based on the analysis of SAXS data, a growth mechanism has been proposed. The study discussed here could open the field of understanding the growth mechanism of complex nanostructures formed using the microemulsion route.
Introduction
Microemulsions (ME) have gained interest in recent years due to the efficient control of size, shape, and composition of nanoparticles synthesized by using them. Various parameters of ME that control the shape and size of the nanostructured material are the nature of the surfactant, the co-surfactant, the oil phase and the water to surfactant ratio (Wo). The use of these microemulsions for the synthesis of nanostructured materials and the effect of various parameters on the size and shape of these nanostructured materials have been discussed in detail by Pileni,1 Eastoe,2 Lopez-Quintela,3 Capek,4 Holmberg,5 Uskokovic,6 Lombardo,7 and Ganguli.8 Although there has been a lot of development in this field for the synthesis of nanoparticles, there is still a lack of basic understanding of the effect of these parameters on the size and shape of nanostructured materials. This lack of knowledge affects the final application of nanostructured materials as it depends on the size and morphology of the material. The spectroscopic and microscopic techniques that are used for studying the growth behavior have disadvantages over SAXS. In the former, information about the size could be extracted indirectly from changes of the optical properties whereas; in the latter, intermediate sample preparation is required. The primary barrier with these techniques for obtaining information about the formation of nanostructures is that “seeing through” the liquids for getting an insight into the chemical and physical events in the solvent during nanocrystal growth is difficult. This also leads to a challenge in understanding the relationship between structure and functionality during material applications.9 For such studies, SAXS is an ideal technique because it can deliver information on shape and size changes with the course of the reaction. Monitoring the growth of nanostructures using SAXS in liquid media becomes easier as X-rays can efficiently penetrate the liquid.10,11 We cite here a few reports from the literature wherein SAXS has been used to study the nucleation and growth behavior of nanostructured materials. The kinetics of formation of nanoparticles of Pd and Rh using the photoreduction method was studied by Harada et al.12 using SAXS. They found that the nucleation process followed an autocatalytic reduction process followed by growth of nanoparticles. They also observed a difference in the rate of formation of the two kinds of nanoparticles. Formation of oligomers of silica from tetraethylorthosilicate (TEOS) and aminopropyltrimethoxysilane (APTS) in a reverse microemulsion was studied using in situ SAXS by Lin et al.13 The authors identified four stages of the evolution of particle formation, which were referred to as induction, nucleation, diffusion growth and slow down. The nucleation and growth mechanism of SnO2 nanoparticles was studied by using in situ time-resolved SAXS and combined Raman/extended X-ray absorption fine structure (EXAFS) measurements by Caeteno et al.14 Using this combination they proposed a five-step mechanism corresponding to the prenucleation of very small nucleates followed by growth of monomers of tin-oxo clusters and cluster–cluster growth which leads to the formation of double or triple chain structures for SnO2 nanoparticles. These structures were shown to further interconnect to form SnO2 nanoparticles. SAXS and electron microscopy were used by Zhang et al.10 to study the formation of 3D assemblies of Pd nanocubes by a solvent evaporation method. They studied the relationship between the nanoparticle shape, the ligand shell, and the emergent phase behavior of nanocube assemblies. P. Calandra et al.15 carried out studies on the formation of nanostructures of AgX nanoparticles using dry dispersions of AgNO3 and KX (X = Br, Cl) nanoparticles in AOT/n-heptane solutions. Analysis of AgX/AOT composites by WAXS indicated a shift in the peak position of the (100) plane of the composite when compared with pure AOT. The authors also suggest structural disorder as observed by a lowering of the intensity of the peak. Polte et al.16 studied the growth of gold nanoparticles (AuNP) by using in situ SAXS. The studies were carried out on a homogeneous mixture formed by the continuous flow of an aqueous solution of tetrachloroauric acid and sodium borohydride. By using SAXS studies they concluded that the first step is rapid conversion of the ionic gold precursor into metallic gold nuclei, followed by particle growth via coalescence of smaller entities. A combination of SAXS and WAXS on time scales of 100 μs and 2.5 ms with a time resolution of 10 μs was used by Schiener et al.17 for study of the nucleation and growth of CdS nanoparticles. The study gave direct evidence of a two-step mechanism involving the formation of prenucleation clusters followed by nanoparticle nucleation from coalescence of the precursors. Uniform distributions of entrapped cyanamide molecules within reverse micelles of AOT/CCl4 and lecithin/CCl4 were observed by Calandra et al.18 using combined results of SAXS, FT-IR, and 1H NMR spectroscopy. Ganguli et al. have used SAXS for studying the growth mechanism of zinc oxalate nanorods synthesized using microemulsions19 wherein they observed that nanostructures with varied size and shape were formed within half an hour after the start of the reaction. They also observed an asymmetry in the I(q) vs. q curve concluding that the reverse micelles had an ellipsoidal shape. Another study by the group showed the effect of a hydrotrope on the size and shape of the microemulsion droplets.20 They observed that the size of the ellipsoid along the equatorial axis increased from 7 to 40 nm with an increase in the concentration of the hydrotrope. Though there have been studies carried out on understanding the formation of nanoparticles using microemulsions, a clear understanding of how co-surfactants (having different chain lengths) affect the size and shape of nanoparticles using microemulsions is missing. The study reported here focuses on the growth of copper oxalate nanostructures synthesized using a microemulsion method. Metal oxalates with divalent metal ions, MC2O4 (M = Mn, Co, Zn, Ni, and Cu)21–26 are interesting to study as their morphology can be easily controlled by variation of the parameters affecting the microemulsion. With divalent metal ions, the nature of the bond between the metal and the ligand results in a linear arrangement, which was reported to be the reason for the formation of a rod like morphology for these oxalates. Changes in the parameters associated with microemulsions viz. the surfactant, co-surfactant, and solvent have been shown to affect the size and shape of these oxalates.25,26 Thus, the study of this system (divalent metal oxalate) whose morphology changes drastically with changes in the co-surfactant, we felt, would be interesting to understand the effect of the co-surfactant on the growth of nanostructures formed using the microemulsion route. Another reason for choosing copper oxalate as a case study to understand the nucleation and growth behavior of nanostructures in microemulsion using SAXS was the fact that copper oxalate is important from both fundamental as well as commercial aspects. It is known that stacking of ribbons of Cu(C2O4)–Cu(C2O4) results in the formation of the orthorhombic structure of copper oxalate.27 Apart from this, copper oxalate exhibits an unusual anti-ferromagnetic property owing to its polymer-like structure which arises because of stacking of Cu(C2O4)–Cu(C2O4) ribbons.28 Copper oxalate could be used as an inorganic blue pigment in ceramics and other commercial powders such as baby blue powder28 and has the potential to be used as a single source precursor for the formation of Cu,29 Cu2O,29 and CuO.30 To the best of our knowledge, variation of the co-surfactant and study of its effect on the growth of nanostructures (copper oxalate in this case) using SAXS has not been reported so far. In the present study, the two different co-surfactants that were chosen are 1-butanol and 1-octanol. The main rationale behind the choice of these two co-surfactants is based on our previous observation26 wherein nanorods of copper oxalate were formed in a microemulsion containing CTAB as a surfactant, 1-butanol as a co-surfactant and isooctane as the oil phase. The morphology of copper oxalate changed to a cube when the co-surfactant was changed to 1-octanol. This study will further add to the field of microemulsions and give insight into how the chain length of the co-surfactant influences the growth
of particles and finally their shape.
Results and discussion
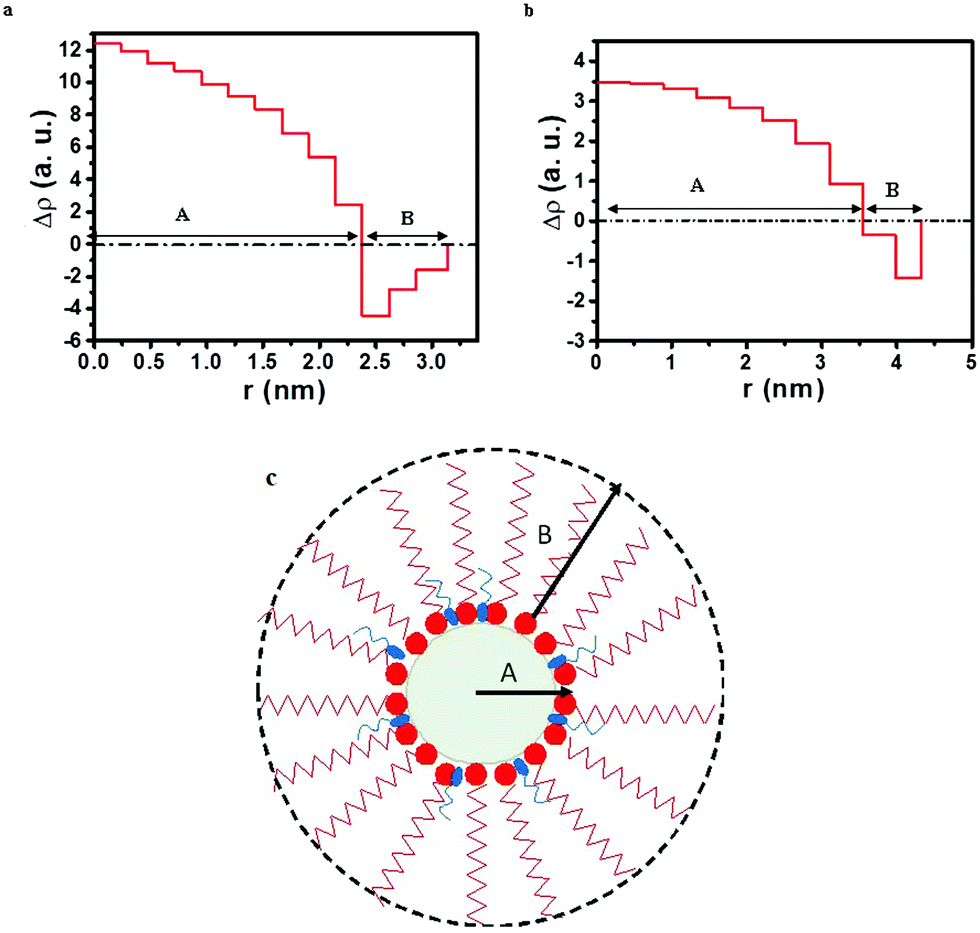
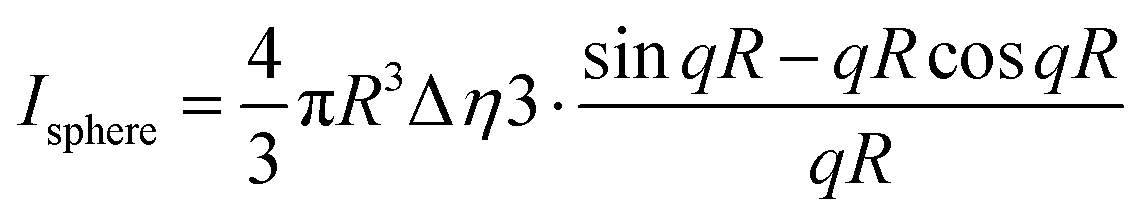
The studies carried out in this report are an attempt to get an insight into the effect of variation in the chain length of the co-surfactant on the shape and size of copper oxalate nanoparticles during the reaction. The co-surfactants that were investigated are 1-butanol, bearing 4 carbon atoms, and 1-octanol, bearing 8 carbon atoms. For this, firstly scattering data was obtained for a microemulsion containing water inside the core of the reverse micelles (no ions). In the microemulsion system, the scattering component is the reverse micelles (consisting of aqueous cores, surfactant/co-surfactant head groups and surfactant/co-surfactant tails) as predicted from the contrast between adjacent regions with different electron densities. Fig. 1a and b show the cross-sectional electron density profile of reverse micelles formed using 1-butanol and 1-octanol as the co-surfactant, respectively. The cross-sectional electron density profile may be represented by two layers where the interior hydrophilic core is composed of an aqueous pool, the polar head of the surfactant and the co-surfactant (depicted by A in the electron density plot and the schematic, Fig. 1a–c) while the exterior layer (depicted by B in the electron density plot and the schematic, Fig. 1a–c) is composed of the hydrophobic chain of the surfactant and the co-surfactant. The center of the hydrophilic core is defined as r = 0. This core extends to the value of ‘r’ where the sign of ρ(r) changes. ρ(r) < 0 corresponds to the hydrophobic chain of the surfactant and co-surfactant. Calandra et al.31 have also shown that the contrast between the adjacent regions having different electron densities gives rise to the scattering and accounts for their choice of model used for fitting the data. Based on our interpretation of the electron density plots (Fig. 1a and b), it was apparent that the choice of model would be based on a core–shell type of structure.
 |
| | Fig. 1 Cross-sectional electron density plots for microemulsions containing (a) CTAB/1-butanol/iso-octane/water and (b) CTAB/1-octanol/iso-octane/water. (c) Schematic showing a reverse micelle with regions A and B. | |
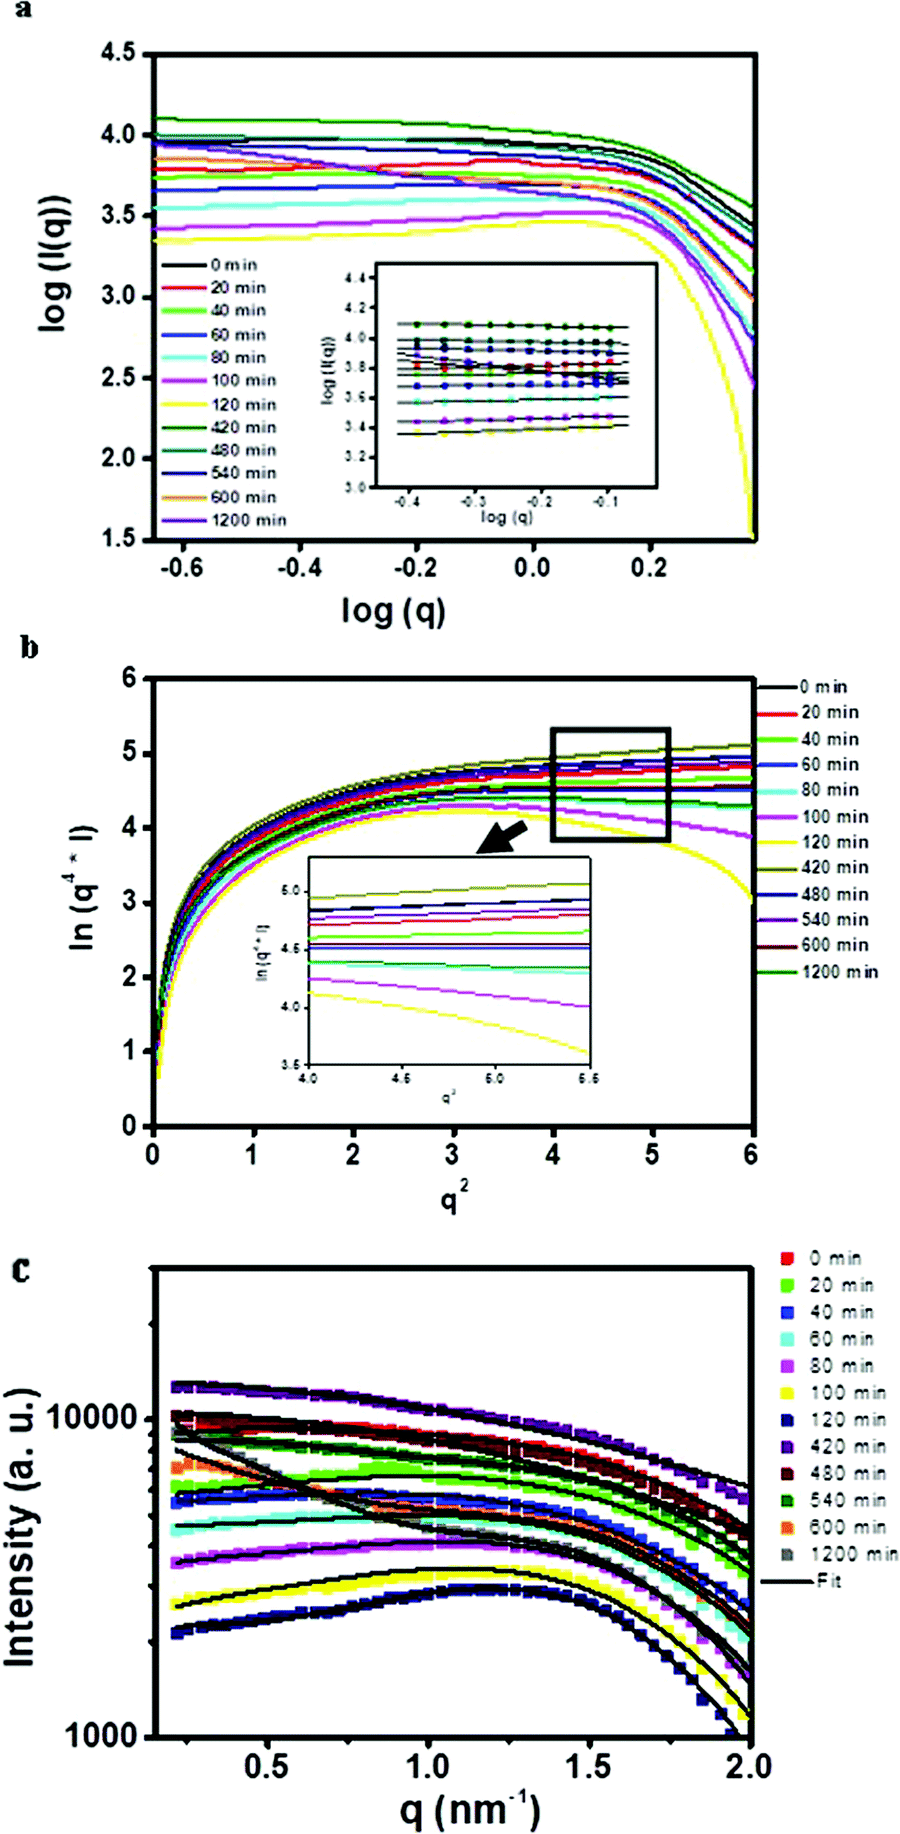
Fig. 2a shows a double logarithm plot i.e. log(I) vs. log(q) plot. It has been reported that the slope of this curve (eqn (3) and (4)) gives an indication about the shape of scattering components.32 Hence, the slope of the plot was used to assess the shape of the reverse micelles. In the case of the 1-butanol system, the slope was proportional to ‘1’ suggesting that the reverse micelle has a cylindrical or ellipsoidal shape whereas, in case of 1-octanol, the slope was proportional to ‘0’ which means that the reverse micelle has a spherical shape. The Porod plot shows a negative deviation from Porod's law as shown in Fig. 2b which indicates that the electron density between the two phases does not change abruptly and varies gradually over a certain range of distance between them, resulting in the formation of a diffuse interfacial layer.33 This diffuse layer corresponds to CTAB molecules penetrating into iso-octane. The average thickness of the diffuse layer which is obtained from the modified Porod's law (eqn (6) and (7)) is 1.2 nm and 0.6 nm for 1-butanol and 1-octanol systems respectively. It has been reported that alcohols with longer hydrocarbon chains favor the formation of reverse micelles compared to alcohols with shorter hydrocarbon chains. Alcohols with a number of carbon atoms ranging from 2 to 6 are adsorbed at the interface resulting in pulling apart the surfactant.34 The interaction between the alcohol and the surfactant molecule and also with the oil is negligible. Beyond C6, the alcohols essentially behave like oils and are present in a lesser amount at the interface. The interaction with the oil and the surfactant tail increases.34 The smaller value of the average thickness for the diffuse layer for the microemulsion formed using 1-octanol could thus be attributed to the increased interaction of the hydrocarbon tail of 1-octanol with iso-octane and the surfactant tail when compared to that of 1-butanol. Thus, the model-free approach (electron density curves, the double logarithm plot and Porod's plot) helped us to obtain a prior idea of shape and size after which the SAXS data were fitted with ellipsoidal core–shell and spherical core–shell models for 1-butanol and 1-octanol systems respectively (Fig. 2c).
 |
| | Fig. 2 (a) Double logarithm plot (inset shows the slope obtained), (b) Porod plot (inset shows negative deviation in the Porod region) and (c) model fitted SAXS data (I vs. q plot) for blank microemulsion (CTAB/co-surfactant/iso-octane/water) systems. | |
The parameters obtained by fitting the SAXS data for the reverse micelle containing only water and no ions (blank) and the proposed schematic for both systems are shown in Table 1 and Fig. 3 respectively. It should be noted that the thickness of the shell, as obtained after fitting the SAXS data, was found to be 1.1 nm for the microemulsion formed using 1-butanol and 0.7 nm for the microemulsion formed using 1-octanol. The values obtained after fitting the SAXS data were found to be in agreement with the values obtained for the average thickness of the diffuse layer using Porod's law (1.2 nm and 0.6 nm for microemulsions formed using 1-butanol and 1-octanol respectively). Thus, corroboration of values for the thickness obtained using two approaches viz. a model-independent approach and model-dependent approach also reinforces and suggests that the model used for analysis of the SAXS data was correct. Using these models and the knowledge about the size and shape of the reverse micelles containing water, the growth of copper oxalate in reverse micelles was further investigated.
Table 1 Parameters obtained after fitting for the CTAB/co-surfactant/iso-octane/water system
| System |
Form factor |
Structure factor: macro-ion |
χ
red
2
|
| Model |
Dimensions (nm) |
RHSmic. (nm) |
Ionic stength |
| RHS: radius of a hard sphere. |
| CTAB/1-butanol/iso-octane/water |
Ellipsoidal core–shell |
a = 3.8 |
4.65 |
0.33 |
2.2 |
|
b = 2.1 |
|
t = 1.1 |
|
|
| CTAB/1-octanol/iso-octane/water |
Spherical core–shell |
R
1 = 5.5 |
5.14 |
0.39 |
3.6 |
|
R
2 = 4.8 |
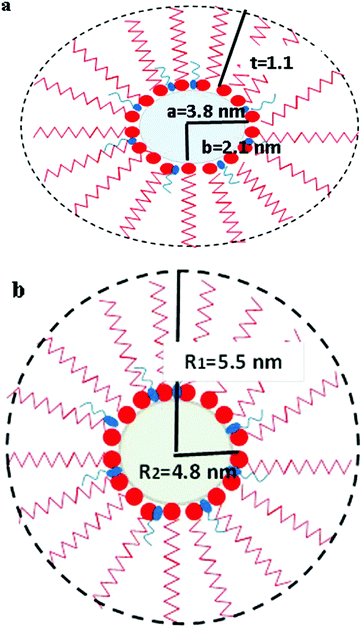 |
| | Fig. 3 Schematic diagram showing the structure of reverse micelles of (a) CTAB/1-butanol/iso-octane/water and (b) CTAB/1-octanol/iso-octane/water showing various parameters obtained after fitting the SAXS data. A molecule of co-surfactant is represented by the blue color and a molecule of surfactant is represented by the red color. | |
The growth of copper oxalate in the CTAB/1-butanol/iso-octane/water system was first analyzed by using a double logarithm plot (Fig. 4a). The slope of the double logarithm plot was around 0.7–0.8 suggesting the ellipsoidal/cylindrical shape of reverse micelles as well as copper oxalate nanostructures. Positive deviation in the Porod plot (Fig. 4b) was observed, indicating the formation of a well-defined and sharp phase boundary which was attributed to the formation of copper oxalate nanostructures.33 Based on these preliminary investigations, different models (Fig. 4c) were used for fitting the SAXS data curves.
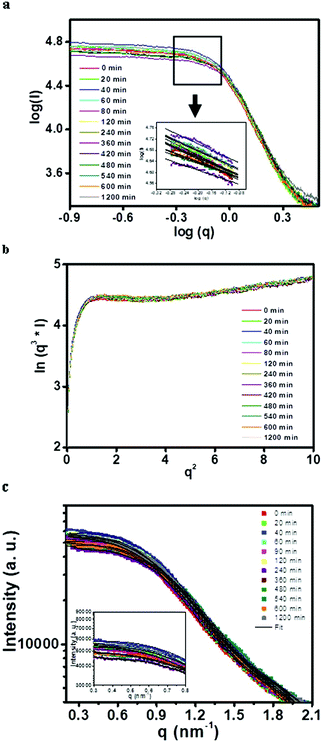 |
| | Fig. 4 (a) Double logarithm plot (inset shows the slope obtained), (b) Porod plot (inset shows positive deviation in the Porod region) and (c) model fitted SAXS data (I vs. q plot) for particle contained inside the microemulsion (CTAB/1-butanol/iso-octane/copper oxalate) systems. | |
The fitting parameters are listed in Table 2. Ellipsoid core–shell and sphere models were used for fitting the scattering curves obtained at 0 and 20 minutes. It should be noted that the ellipsoid core–shell model was used for reverse micelles, as evident from Fig. 2b wherein reverse micelles formed with 1-butanol as the co-surfactant were ellipsoidal in nature. Three different models viz. spherical, ellipsoid and cylinder were used to fit the scattering contribution from copper oxalate nanostructures in SAXS data. From 40 minutes to 2 h, the curves could be fitted with ellipsoid core–shell and ellipsoid models. Beyond 2 h, ellipsoid core–shell and cylindrical models were used to fit SAXS data. From the dimensions obtained for the reverse micelles (Fig. 5a) and copper oxalate nanostructures with time (Fig. 5b), it could be envisaged that the size of ellipsoidal reverse micelles increased with time (up to 1.5 h) indicating coalescence of the micelle and the presence of a fused micellar structure. Beyond 1.5 h, the size decreases and remains constant up to the end of the reaction (Fig. 5a). The variation in the dimension of copper oxalate nanostructures is quite interesting to observe. Initially (0–20 min), the data could be fitted using a spherical model indicating that just after mixing the reacting microemulsions, copper oxalate structures started forming. The size of these spheres ranged from 1–1.5 nm. From 40 min to 1.5 h, the data could be fitted using the ellipsoid model. From Fig. 5b, it could be observed that the increase in the equatorial-semi axis was gradual as compared to a drastic increase in the size of the semi-principle axis. Beyond 1.5 h, the cylindrical model was used to fit the SAXS curves wherein a slight increase in the cross-sectional radius of the cylinder and a drastic increase in the length of the cylinder were observed. From the above analysis, it is quite interesting to observe that the growth of copper oxalate from spheres to cylinders occurs only along one dimension i.e. the length (the semi-principle axis in ellipsoids). The other dimension almost remains unaltered. Thus, our studies confirm our findings reported previously26 where it was predicted that the surfactant molecules are not associated with the end of rods, which are water-rich domains. This results in an increase in the exchange of reactants with other micelles, favoring the growth along this axis and thereby resulting in the formation of rods. Our findings from current studies using SAXS confirm the prediction reported previously.26
Table 2 Parameters obtained after fitting for the CTAB/1-butanol/iso-octane/copper oxalate system
| Time (min) |
Contribution 1: for reverse micelles |
Contribution 2: for copper oxalate nanostructures |
χ
red
2
|
| Form factor: ellipsoidal core–shell |
Structure factor: macro-ion |
Form factor |
Structure factor |
|
a (nm) |
b (nm) |
t (nm) |
RHSmic. (nm) |
Ionic strength |
Model |
η
particle (cm−1) |
R
part. (nm) |
b/Lpart. (nm) |
Model |
R (nm) |
L (nm) |
| RHS: radius of a hard sphere. |
| 0 |
3.57 |
1.50 |
1.01 |
4.51 |
1.10 |
Sphere |
1.8 × 10¹⁰ |
1.0 |
— |
Hard sphere |
0.9 |
— |
6.3 |
| 20 |
3.61 |
1.61 |
0.79 |
4.26 |
1.04 |
Sphere |
2.1 × 10¹⁰ |
1.2 |
— |
Hard sphere |
1.1 |
— |
4.7 |
| 40 |
3.64 |
1.70 |
0.68 |
4.01 |
0.96 |
Ellipsoid |
2.6 × 10¹⁰ |
1.1 |
2.2 |
Hard sphere |
2.1 |
— |
3.9 |
| 60 |
3.80 |
1.79 |
1.12 |
4.08 |
0.99 |
Ellipsoid |
3.6 × 10¹⁰ |
0.6 |
4.1 |
Hard sphere |
4.0 |
— |
8.9 |
| 90 |
3.56 |
1.62 |
0.85 |
4.61 |
0.91 |
Ellipsoid |
4.2 × 10¹⁰ |
1.5 |
5.3 |
Hard sphere |
5.2 |
— |
7.9 |
| 120 |
3.53 |
1.47 |
0.90 |
4.32 |
0.93 |
Cylinder |
5.7 × 10¹⁰ |
7.0 |
18.8 |
Cylinder prism |
7.0 |
18.4 |
10.9 |
| 240 |
3.46 |
1.43 |
0.91 |
4.37 |
0.87 |
Cylinder |
7.1 × 10¹⁰ |
8.3 |
19.9 |
Cylinder prism |
8.1 |
19.8 |
3.7 |
| 360 |
3.32 |
1.35 |
0.83 |
3.95 |
0.85 |
Cylinder |
8.9 × 10¹⁰ |
8.5 |
50.2 |
Cylinder prism |
8.5 |
49.5 |
11.7 |
| 480 |
3.29 |
1.32 |
0.74 |
4.02 |
0.82 |
Cylinder |
9.1 × 10¹⁰ |
9.1 |
53.1 |
Cylinder prism |
9.2 |
52.9 |
6.6 |
| 540 |
3.26 |
1.26 |
0.87 |
4.21 |
0.80 |
Cylinder |
10.2 × 10¹⁰ |
9.5 |
63.0 |
Cylinder prism |
9.3 |
62.9 |
5.1 |
| 600 |
3.28 |
1.29 |
0.93 |
4.05 |
0.79 |
Cylinder |
12.7 × 10¹⁰ |
10.8 |
70.4 |
Cylinder prism |
10.5 |
70.5 |
6.1 |
| 1200 |
3.32 |
1.22 |
1.12 |
4.21 |
0.72 |
Cylinder |
14.8 × 10¹⁰ |
14.4 |
74.5 |
Cylinder prism |
14.4 |
74.3 |
5.3 |
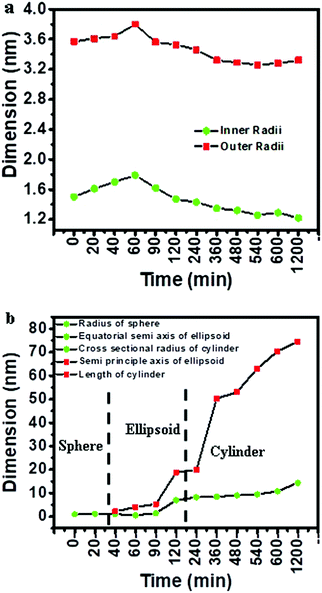 |
| | Fig. 5 Variation in (a) inner and outer radii of ellipsoid core–shells (model used for reverse micelles) and (b) dimensions of spheres, ellipsoids and cylinders (models used for copper oxalate) obtained after fitting SAXS data curves for the CTAB/1-butanol/iso-octane/copper oxalate system. | |
Analysis of SAXS curves for the CTAB/1-octanol/iso-octane/copper oxalate system obtained at different time intervals was first carried out on the basis of the preliminary investigation. From the double logarithm plot (Fig. 6a), it was observed that the value of the slope varies from 0–0.3 indicating the spherical shape of the scattering components, reverse micelles and copper oxalate nanostructures, in this study. From the Porod plot (Fig. 6b), it was observed that just after mixing the microemulsions to 2 h of the reaction, the Porod plot shows a change in the slope from positive to negative deviation, indicating micelle–micelle interaction which results in the formation of a diffuse phase boundary.33 Beyond 2 h, with the growth of copper oxalate nanostructures, positive deviation in the Porod region was observed. This is because copper oxalate in the microemulsion behaves like a sharply defined phase.33 Hence, based on the analysis using the model-free approach, SAXS data curves were fitted by selecting an appropriate model using the results of the model-free analysis (Fig. 6c). The fitting parameters are listed in Table 3.
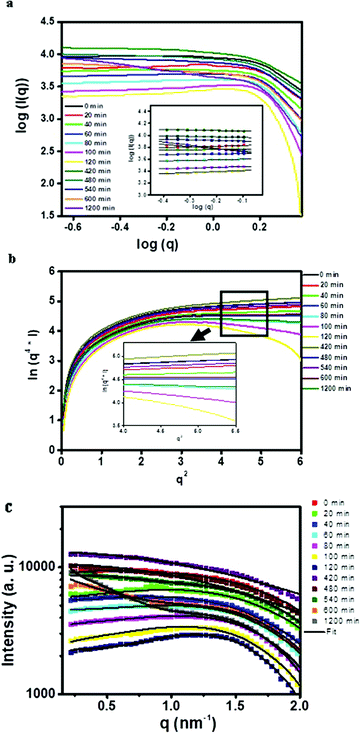 |
| | Fig. 6 (a) Double logarithm plot (inset shows the slope obtained), (b) Porod plot (inset shows both positive and negative deviation in the Porod region) and (c) model fitted SAXS data (I vs. q plot) for particle contained inside the microemulsion (CTAB/1-octanol/iso-octane/copper oxalate) systems. | |
Table 3 Parameters obtained after fitting the CTAB/1-octanol/iso-octane/copper oxalate system
| Time (min) |
Contribution 1: for reverse micelles |
Contribution 2: for copper oxalate nanostructures |
χ
red
2
|
| Form factor: spherical core–shell |
Structure factor: macro-ion |
Form factor: sphere |
Structure factor: hard-sphere |
|
R
1 (nm) |
R
2 (nm) |
RHSmic. (nm) |
Ionic strength |
η
part (cm−1) |
R
part. (nm) |
RHSpart. (nm) |
| RHS: radius of a hard sphere. |
| 0 |
2.0 |
1.7 |
1.85 |
1.09 |
— |
— |
— |
9.3 |
| 20 |
2.1 |
1.7 |
2.02 |
0.99 |
— |
— |
— |
3.6 |
| 40 |
2.2 |
1.7 |
2.09 |
0.97 |
— |
— |
— |
6.3 |
| 60 |
2.2 |
1.8 |
2.21 |
0.98 |
— |
— |
— |
9.1 |
| 80 |
2.3 |
1.9 |
2.23 |
0.94 |
— |
— |
— |
4.9 |
| 100 |
2.4 |
1.9 |
2.35 |
0.91 |
— |
— |
— |
5.1 |
| 120 |
2.6 |
2.0 |
2.59 |
0.93 |
— |
— |
— |
8.9 |
| 420 |
1.2 |
0.9 |
1.15 |
0.86 |
7.4 × 10¹⁰ |
0.9 |
1.0 |
10.9 |
| 480 |
1.6 |
0.2 |
1.52 |
0.84 |
9.0 × 10¹⁰ |
1.0 |
1.2 |
11.7 |
| 540 |
2.6 |
1.4 |
2.58 |
0.81 |
10.4 × 10¹⁰ |
2.9 |
3.0 |
8.6 |
| 600 |
3.0 |
1.3 |
2.86 |
0.77 |
12.8 × 10¹⁰ |
6.4 |
6.5 |
6.6 |
| 1200 |
3.0 |
1.7 |
2.92 |
0.71 |
14.4 × 10¹⁰ |
20.1 |
20.2 |
6.2 |
Two different models were used for obtaining the fit viz. the spherical core–shell model for reverse micelles and spheres for copper oxalate nanostructures. Initially, for the first 2 h, SAXS data could be fitted using only the spherical core–shell model indicating that only reverse micelles are present as a scattering component in the system. This also corroborates with the inference observed from the Porod plot wherein negative deviation was observed indicating the formation of a diffuse phase boundary (interfacial layer) corresponding to the CTAB molecule penetrating into iso-octane. Thereafter, data were fitted with spherical core–shell and sphere models for 7–20 h. The fitted SAXS data are shown in Fig. 6c. We found that the size obtained using a spherical core–shell model decreased after 7 h whereas the size obtained for spheres increased after 7 h indicating growth in the particle formation as shown in Fig. 7a and b. The fit of the averaged SAXS profile yields a spherical particle whose volume corresponds to the volume of a cube.10
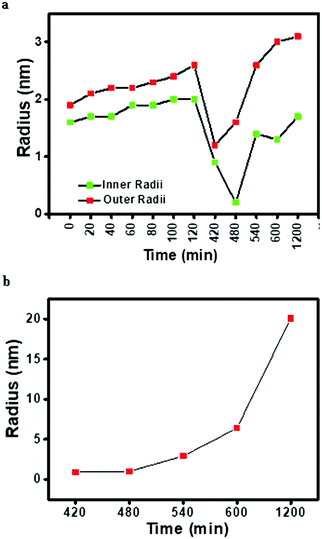 |
| | Fig. 7 Variation in (a) inner and outer radii of the spherical core–shell (model used for reverse micelles) and (b) radii of spheres (model used for copper oxalate) obtained after fitting SAXS data curves for the CTAB/1-octanol/iso-octane/copper oxalate system. | |
In view of the above observations, a schematic for the formation of copper oxalate using the microemulsion method with a variation of the co-surfactant is proposed which is shown in Fig. 8. It is thus proposed that for the microemulsion system formed using 1-butanol as the co-surfactant, nucleation of copper oxalate nanostructures started immediately after mixing of microemulsions. Up to one hour after the start of the reaction, we propose that a series of events had occurred which included formation of nuclei of copper oxalate inside the core of reverse micelles (after coalescence and decoalescence of reverse micelles containing the reactants), growth of nanostructures inside the core of reverse micelles and separation of these nanostructures from the core of reverse micelles. The proposal was based on the fact that the positive deviation from Porod's law was observed from the start of the reaction and also the fact that initial fitting of the SAXS data could be carried out using the spherical model for copper oxalate nanostructures. Beyond one hour, these separated copper oxalate nanostructures capped by the surfactant interacted with each other resulting in the formation of ellipsoids and finally nanorods (cylinders). The reason for the formation of rod shapes has been attributed to the association of surfactant molecules on the lateral side of the rods. The ends of the rods, being water-rich domains, are not associated with surfactant molecules. This results in an increase in the exchange of reactants with other micelles, favoring the growth along this axis and thereby resulting in the formation of rods. In the case of the reaction occurring in the microemulsion formed with 1-octanol as the co-surfactant, separation of copper oxalate nanostructures occurred after 7 hours of reaction. This delay in the separation of nanostructures from reverse micelles could be attributed to the slow rate of the reaction within the reverse micelles due to an increase in the film rigidity as compared to the microemulsion formed with 1-butanol. The change in the film rigidity with an increase in the chain length of the co-surfactant has been discussed previously.8,26 In the case of the 1-butanol system, due to film flexibility, the micelles interact with each other in no time and the growth of copper oxalate starts immediately after mixing of the two microemulsions. But in the case with 1-octanol as the co-surfactant, the surfactant film is more rigid resulting in a reduced coalescence rate and hence leading to a slow nucleation and growth process.26 Another interesting observation that we have come across while analyzing SAXS data and correlating with the formation of copper oxalate is that apart from the change in the rigidity of the surfactant film with the chain length of the co-surfactant, it is the shape of the reverse micelles that changes when the chain length was changed from C4 (1-butanol) to C8 (1-octanol). This change in the shape of the reverse micelles along with the rigidity of the surfactant film affects the morphology of the final product, copper oxalate in this case.
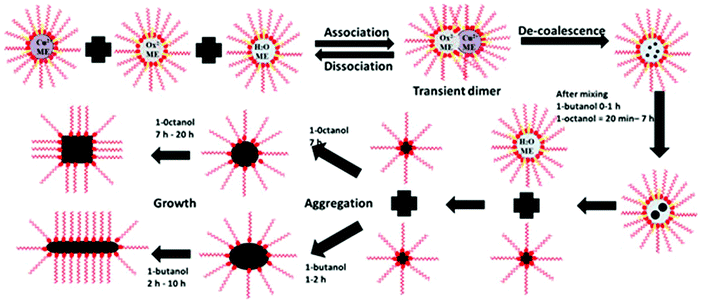 |
| | Fig. 8 Schematics for the growth mechanism of copper oxalate formation within reverse micelles having 1-butanol and 1-octanol as the co-surfactant. | |
In order to corroborate the results obtained using SAXS, TEM studies were carried out on the product obtained after centrifugation (after different times of the reaction). For 1-butanol, the studies were carried out on sample isolated at 20 minutes, 2 h, 7 h and 20 h of the reaction. From Fig. 9a–d, the growth of nanostructures of copper oxalate with 1-butanol as the co-surfactant could be observed. At 20 minutes, spherical particles could be observed in the TEM image (Fig. 9a) which corroborates well with our SAXS analysis. Small rod-like structures assembling with each other could be clearly observed in the inset of Fig. 9b. Discrete rod-like structures could be observed at 7 h (Fig. 9c) and 20 h (Fig. 9d) of the reaction. In the case of copper oxalate nanostructures synthesized using 1-octanol as the co-surfactant, spherical particles could be observed in the TEM image (Fig. 10a) for the sample isolated after 7 h of the reaction. These particles assembled to form nanocubes after the reaction was carried out for 20 h (Fig. 10b). The size of the nanostructures observed from TEM was larger than that observed by fitting the SAXS data. This anomaly could be attributed to the fact that SAXS studies were carried out during the progress of the reaction whereas TEM studies were carried out on the product obtained after isolation by centrifugation. During isolation of the product, self-aggregation of the oxalate nanostructures could have resulted in large size. This self-aggregation could have been the result of the interaction between the hydrophobic chains of the surfactant that surrounds the particles. Such interaction has been reported in the literature which has resulted in assembled nanostructures of BaCrO4.35
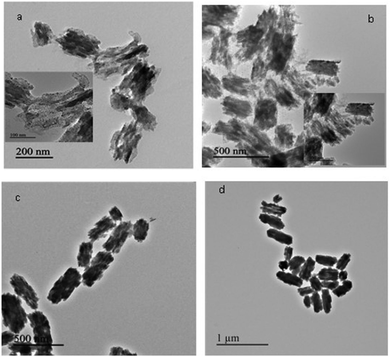 |
| | Fig. 9 TEM images of copper oxalate obtained after (a) 20 minutes, (b) 2 h, (c) 7 h and (d) 20 h of reaction using CTAB/1-butanol/iso-octane. | |
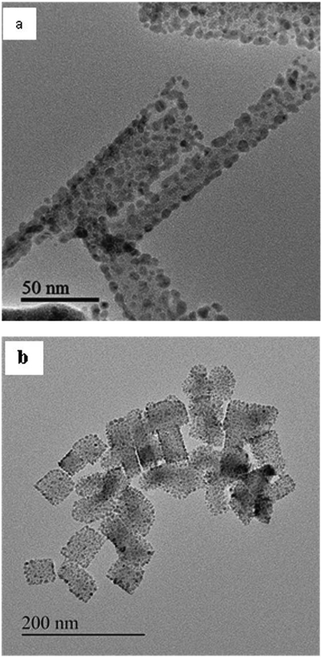 |
| | Fig. 10 TEM images of copper oxalate obtained after (a) 7 h and (b) 20 h of reaction using CTAB/1-octanol/iso-octane. | |
PXRD was done to check the purity of the final product formed after the reaction. The final product was extracted from the microemulsion system by centrifugation followed by washing with a 1![[thin space (1/6-em)]](https://www.rsc.org/images/entities/char_2009.gif) :1 chloroform/methanol mixture to remove surfactant and a non-polar solvent. The PXRD pattern (Fig. 11) of the product obtained via the reverse micelle method (free from surfactant) shows the formation of pure copper oxalate monohydrate in the case of 1-butanol as well as 1-octanol as the co-surfactant. All the reflection planes in the pattern could be indexed using the orthorhombic unit cell of CuC2O4·H2O (JCPDS-00-021-0297).
:1 chloroform/methanol mixture to remove surfactant and a non-polar solvent. The PXRD pattern (Fig. 11) of the product obtained via the reverse micelle method (free from surfactant) shows the formation of pure copper oxalate monohydrate in the case of 1-butanol as well as 1-octanol as the co-surfactant. All the reflection planes in the pattern could be indexed using the orthorhombic unit cell of CuC2O4·H2O (JCPDS-00-021-0297).
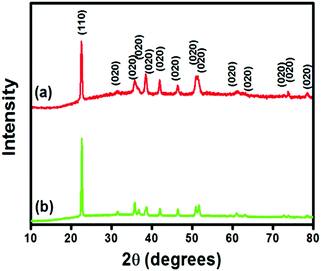 |
| | Fig. 11 PXRD pattern of copper oxalate monohydrate obtained via the reverse micelle method in the case of (a) 1-butanol and (b) 1-octanol as the co-surfactant. | |
The average crystallite size of both the samples was calculated using Scherrer's equation and has been reported in Table 4. Refined lattice parameters a, b and c were calculated by using UnitCell software (based on a non-linear least square cell refinement program). The cell parameters calculated for copper oxalate are given in Table 4. Not much change in the lattice parameters for the two systems was obtained when compared to the standard.
Table 4 Calculated lattice parameters for copper oxalate (refined with standard deviation)
| Sample |
d
crystallite (nm) |
a (Å) |
b (Å) |
c (Å) |
Volume (Å3) |
| 1-Butanol |
23.8 |
5.3887(6) |
5.5820(4) |
2.5533 (1) |
76.805(7) |
| 1-Octanol |
21.6 |
5.4383(6) |
5.6206(4) |
2.5637(1) |
78.364(7) |
| JCPDS-00-021-0297 |
|
5.40300 |
5.57100 |
2.54600 |
76.63 |
Experimental
(i) Materials used
Hexadecyltrimethylammonium bromide (CTAB) (CDH, purity ≥99%), iso-octane (Merck, purity ≥99%), 1-butanol (Merck, purity ≥99%), 1-octanol (CDH, >99%), copper nitrate trihydrate (Merck, purity ≥99%) and ammonium oxalate (Merck, purity ≥99%) were used. Distilled water was used for preparing the aqueous phase for the reverse micellar system. All chemicals were used without further purification.
(ii) Synthesis of copper oxalate nanostructures
Copper oxalate nanostructures were synthesized using a microemulsion method as reported earlier.24 Briefly, the microemulsions were formed by using CTAB as the surfactant, 1-butanol/1-octanol as the co-surfactant, iso-octane as the non-polar phase, and a 0.1 M aqueous solution of Cu2+ and C2O42− as the aqueous phase The weight fraction of these constituents in the microemulsion was 16.76% of CTAB, 13.9% of 1-butanol/1-octanol, 59.29% of iso-octane and 10.05% of the aqueous phase. Two microemulsions were prepared, one containing a 0.1 M aqueous solution of copper nitrate while the other containing a 0.1 M aqueous solution of ammonium oxalate. The two microemulsions were slowly mixed and stirred for 20 h using a magnetic stirrer. Aliquots were taken out at different time intervals for carrying out SAXS studies. The details of the experiment are discussed in the next section. The product obtained at the end of the reaction was separated from the surfactant and non-polar phase by centrifugation and washed with a 1:1 chloroform/methanol mixture to remove the surfactant and dried at room temperature.
(iii) Characterization
To get an insight into the morphological changes during the growth process of the copper oxalate nanoparticles, small amounts were periodically collected from the continuously stirred reacting microemulsion and filled into a glass capillary. SAXS studies on the CTAB/1-octanol/iso-octane system were carried out at Indian beamline-18B at the Photon Factory synchrotron, Tsukuba, Japan. The data were recorded at room temperature using a Pilatus detector. The data were first normalized to the intensity of the transmitted beam, after which they were radially averaged to obtain a one-dimensional intensity (I) versus scattering vector (q) plot. SAXS studies on the CTAB/1-butanol/iso-octane system were carried out on a SAXSess mc2 instrument (Anton-Paar, Austria) using a CuKα source with a wavelength of 1.54 Å. Data were acquired through image plates and read on a PerkinElmer cyclone image plate reader. The SAXSQuant 2D software was used to reduce the two-dimensional data to a one-dimensional intensity (I) versus scattering vector (q) plot. For both the particle dispersion and the reverse micellar solution, the scattering of the solvent was subtracted before data analysis. Transmission electron microscopy (TEM) studies were carried out on a JEOL JEM 2100 operated at 200 kV. Powder samples were dispersed in ethanol and a drop of the dispersed solution was put on a copper grid supported by a carbon film and dried. Powder X-ray diffraction (PXRD) studies of powdered samples, obtained after completion of the reaction, were carried out on a Bruker D8 Advance diffractometer (Ni-filtered Cu Kα, λ = 1.5406 Å). Normal scans were recorded with a step size of 0.02°. Raw data were subjected to background corrections and Kα2-lines were stripped off.
(iv) Method of data analysis
SAXS data were analyzed by using two approaches: (a) a model-independent approach to get a prior idea about the shape and size of scattering particles by using a power law and Porod's law and (b) direct fitting of SAXS curves by using the appropriate model.
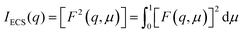
The total scattering intensity for monodisperse interacting particles as a function of their single-particle form factor P(q) and structure factor S(q) can be written as
| | | I(q) = nmΔρ2V2P(q)S(q) + Ibkg | (1) |
where
nm represents the number density of scattering particles, Δ
ρ represents the scattering length density difference between the particles and the solvent,
V is the volume of the particles,
P(
q) is the form factor related to the shape and size of scattering particles,
S(
q) is the structure factor, representing inter-particle interactions between the neighboring scattering particles and
Ibkg is the background intensity.
The scattering intensity I(q) was measured as a function of scattering vector q. To obtain more quantitative information, the net scattering intensity of the particles (Ip(q)) is derived from the observed scattering intensity (I(q)), which is given by
| | | Ip(q) = I(q) − Ibkg(q) | (2) |
where
Ibkg(
q) is the scattering intensity of the iso-octane filled capillary.
20,36
Model-independent approach.
No assumption on the scattering system is made in the model-free approach.37 It utilizes a set of standard plots which give an idea about the scattering particles. The first plot is a power-law variation in I(q) which is observed in SAXS obtained from differently shaped nanostructuresThe values of the exponent ‘m’ can be determined from the slope of linear parts of a logI(q) vs. log(q) plot (double logarithm plot)| | | log(I(q)) = log(Io) − mlog(q) | (4) |
where Io is defined as the intensity of scattering at zero angle.32 In the double logarithm plot, the value of ‘m’ as 0, 1 and 2 corresponds to spherical, cylindrical and lamellar shapes respectively. The second set of standard plots is obtained by applying Porod's law which gives information about the nature of the phase boundary. For a system having a sharp boundary with different electron densities33 which are constant, the equation followed in Porod's law is| | | ln[q4I(q)] = lnK. | (5) |
When the system has a diffuse phase boundary with an average thickness E between two phases, then the scattering is reduced at high angles. This results in a negative deviation from Porod's law.38,39 Under such conditions, Porod's law modifies to the following equation| | | ln[q4I(q)] = lnK − σ2q2 | (6) |
where the average thickness of the interface layer is given byFor a quasi-two-phase system having sharply defined phase boundaries such that there are small fluctuations of electron density between the two-phases, additional scattering is observed which also results in a positive deviation from Porod's law,40 whereby the equation modifies to| | | ln[q4I(q)] = lnK + bq2 | (8) |
where b is a constant related to the size of the regions with micro-fluctuations of electron density. When the data are acquired using the line collimation mode, q3 is used instead of q4 because of instrument broadening.41
Model-dependent approach.
For performing fitting of SAXS curves, the software suite SASfit (version 0.94.8) was used. The fitting was based on the fact that during the reaction, the system consists of two components: (a) the reverse micelles and (b) copper oxalate nanostructures bound by the surfactant and/or micelles. In order to account for the polydispersity of both systems, the Schultz–Zimm distribution was used.
The models used for studying the growth of copper oxalate in the CTAB/1-butanol/iso-octane system were an ellipsoidal core–shell model for reverse micelles and sphere, ellipsoid and cylindrical models for copper oxalate nanostructures. The ellipsoidal core–shell model which is used to describe the micelles of CTAB/1-butanol/iso-octane/copper oxalate can be expressed by the following equations42
| |  | (9) |
| |  | (10) |
| | 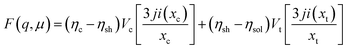 | (11) |
| |  | (12) |
| |  | (13) |
| |  | (14) |
| |  | (15) |
| |  | (16) |
where
ηc is the scattering length density of the core,
ηsh is the scattering length density of the shell,
ηsol is the scattering length density of the solvent,
a is the semi-principle axis of the elliptical core,
b is the equatorial semi-axis of the elliptical core,
t is the thickness of the shell,
Vc is the volume of the core and
Vt is the total volume of the core along with the shell. Similarly, the equations
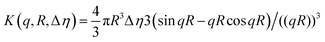
42 used to fit data for a sphere, ellipsoid and cylinder are given as follows
| |  | (17) |
| | 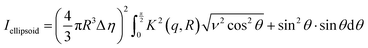 | (18) |
| | 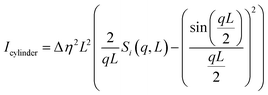 | (19) |
In the case of the CTAB/1-octanol/iso-octane/copper oxalate system, the reverse micelles were fitted with the spherical core–shell model and copper oxalate nanoparticles during their growth were fitted with the sphere. The spherical core–shell model which was used to describe the micelles of CTAB/1-octanol/iso-octane/copper oxalate can be expressed by the following equation
42| | | Ishell(q, R1, R2, η, μ) = [K(q, R1, Δη) − K(q, R2, Δη(1 − μ))]2 | (20) |
with
| |  | (21) |
where
R1 is the overall radius of a spherical shell,
R2 is the radius of the core,
η is the scattering length density difference between the shell and the matrix, and
μ is the scattering length density difference between the core and the matrix relative to the shell contrast.
To account for the inter particle interaction between the scattering components, a structure factor is introduced to fit the SAXS data. It is important to select an appropriate model for the structure factor which can account for intermicellar interactions. To account for the interactions between the reverse micelles, we have used the macro-ion model with a local monodisperse approximation. The local monodisperse approximation is generally used for systems with larger polydispersities and higher concentrations.43 In our system, large polydispersity arises because of a large number of scattering components viz. reverse micelles and copper oxalate nanostructures. Also, the microemulsion system is formed using a high concentration of surfactant, which also justifies the application of the local monodisperse approximation. The choice of macro-ion as a model to incorporate the structure factor in the analysis was based on the fact that the micelles formed with CTAB as the surfactant consist of charged surfactant molecules, associated counter ions and an aqueous solution of the reactants (copper nitrate and ammonium oxalate).20 To account for the interaction between copper oxalate nanostructures, hard spheres and the cylinder model with the monodisperse approximation were used.
The scattering length densities of all the components of the microemulsion were firstly calculated by the SASfit software (Table 5) using their molecular mass, density, and X-ray energy. The calculated scattering length density was further used for a model approximation for the fitting of SAXS data.
Table 5 Scattering length densities of all the components of the microemulsion
| Component |
Molecular mass (g mol−1) |
Density (g cm−3) |
Scattering length density (cm−2) |
| Iso-octane |
114.22 |
0.69 |
6.77 × 10¹⁰ |
| CTAB |
364.45 |
0.50 |
4.73 × 10¹⁰ |
| Water |
18 |
0.99 |
9.35 × 10¹⁰ |
| 1-Butanol |
72.12 |
0.81 |
7.80 × 10¹⁰ |
| 1-Octanol |
130.23 |
0.82 |
7.96 × 10¹⁰ |
Conclusions
SAXS was used to understand the effect of variation in the chain length of the co-surfactant on the growth of copper oxalate nanostructures. The inferences obtained by analyzing the data using a model-independent approach were used to select the model used for fitting the SAXS data. We observed that the chain length of the co-surfactant affects the shape of the micelles. With 1-butanol (4 carbon atoms), the shape of the micelles was observed to be ellipsoidal in nature whereas a spherical shape of the micelles was observed with 1-octanol (8 carbon atoms) as the co-surfactant. Copper oxalate nanostructures were found to form immediately inside the core of the reverse micelles, after mixing of the reactant microemulsions, when 1-butanol was used as the co-surfactant, indicated by the positive deviation from Porod's law. Negative deviation followed by positive deviation from Porod's law with time (for the reaction with 1-octanol as the co-surfactant) indicated that nanostructures were formed (inside the core of reverse micelles) after 2 h of mixing the microemulsions containing the reactants. Finally, based on the fitting of SAXS data, a model for the growth mechanism was proposed. The main interesting observation of the study is that apart from the change in the rigidity of the surfactant film, it is the shape of the reverse micelles which affects the shape of the final product i.e. copper oxalate in this case. The time-dependent SAXS studies add to the field of microemulsions and give an insight into the influence of the chain length of the co-surfactant on the growth of nanostructures. This study is an effort to understand the growth mechanism of copper oxalate, though time resolution on an even shorter time scale could help in increasing the overall understanding of the dynamics of the growth process of nanostructured materials using microemulsions.
Conflicts of interest
There are no conflicts to declare.
Acknowledgements
Sunaina thanks the Council of Scientific and Industrial Research (CSIR), Govt. of India for a fellowship. AKG and SV thank the Department of Science and Technology, India and Saha Institute of Nuclear Physics, India for facilitating the experiments at the Indian Beamline, Photon Factory, KEK, Japan.
References
- M. P. Pileni, J. Phys. Chem. C, 2007, 111, 9019–9038 CrossRef CAS.
- J. Eastoe, M. J. Hollamby and L. Hudson, Adv. Colloid Interface Sci., 2006, 128–130, 5–15 CrossRef CAS PubMed.
- M. A. López-Quintela, C. Tojo, M. C. Blanco, L. García Rio and J. R. Leis, Curr. Opin. Colloid Interface Sci., 2004, 9, 264–278 CrossRef.
- I. Capek, Adv. Colloid Interface Sci., 2004, 110, 49–74 CrossRef CAS PubMed.
- K. Holmberg, J. Colloid Interface Sci., 2004, 274, 355–364 CrossRef CAS PubMed.
- V. Uskoković and M. Drofenik, Adv. Colloid Interface Sci., 2007, 133, 23–34 CrossRef PubMed.
- D. Lombardo, M. A. Kiselev, S. Magazu and P. Calandra, Adv. Condens. Matter Phys., 2015, 2015, 22 Search PubMed.
- A. K. Ganguli, A. Ganguly and S. Vaidya, Chem. Soc. Rev., 2010, 39, 474–485 RSC.
- H.-G. Liao, K. Niu and H. Zheng, Chem. Commun., 2013, 49, 11720–11727 RSC.
- Y. Zhang, F. Lu, D. van der Lelie and O. Gang, Phys. Rev. Lett., 2011, 107, 135701 CrossRef PubMed.
-
T. M. Stawski and L. G. Benning, Methods Enzymology, ed. J. J. De Yoreo, Academic Press, 2013, vol. 532, pp. 95–127 Search PubMed.
- M. Harada, N. Tamura and M. Takenaka, J. Phys. Chem. C, 2011, 115, 14081–14092 CrossRef CAS.
- C.-H. Lin, J.-H. Chang, Y.-Q. Yeh, S.-H. Wu, Y.-H. Liu and C.-Y. Mou, Nanoscale, 2015, 7, 9614–9626 RSC.
- B. L. Caetano, F. Meneau, C. V. Santilli, S. H. Pulcinelli, M. Magnani and V. Briois, Chem. Mater., 2014, 26, 6777–6785 CrossRef CAS.
- P. Calandra, A. Longo, V. Marcianò and V. Turco Liveri, J. Phys. Chem. B, 2003, 107, 6724–6729 CrossRef CAS.
- J. Polte, R. Erler, A. F. Thünemann, S. Sokolov, T. T. Ahner, K. Rademann, F. Emmerling and R. Kraehnert, ACS Nano, 2010, 4, 1076–1082 CrossRef CAS PubMed.
- A. Schiener, A. Magerl, A. Krach, S. Seifert, H. G. Steinrück, J. Zagorac, D. Zahn and R. Weihrich, Nanoscale, 2015, 7, 11328–11333 RSC.
- P. Calandra, A. Longo, A. Ruggirello and V. Turco Liveri, J. Phys. Chem. B, 2004, 108, 8260–8268 CrossRef CAS.
- S. Sharma and A. K. Ganguli, J. Phys. Chem. B, 2014, 118, 4122–4131 CrossRef CAS PubMed.
- V. Sethi, J. Mishra, A. Bhattacharyya, D. Sen and A. K. Ganguli, Phys. Chem. Chem. Phys., 2017, 19, 22033–22048 RSC.
- T. Ahmad, K. V. Ramanujachary, S. E. Lofland and A. K. Ganguli, J. Mater. Chem., 2004, 14, 3406–3410 RSC.
- J. Ahmed, T. Ahmad, K. V. Ramanujachary, S. E. Lofland and A. K. Ganguli, J. Colloid Interface Sci., 2008, 321, 434–441 CrossRef CAS PubMed.
- T. Ahmad, S. Vaidya, N. Sarkar, S. Ghosh and A. K. Ganguli, Nanotechnology, 2006, 17, 1236 CrossRef CAS.
- T. Ahmad, R. Chopra, K. V. Ramanujachary, S. E. Lofland and A. K. Ganguli, J. Nanosci. Nanotechnol., 2005, 5, 1840–1845 CrossRef CAS PubMed.
- S. Vaidya, P. Rastogi, S. Agarwal, S. K. Gupta, T. Ahmad, A. M. Antonelli, K. V. Ramanujachary, S. E. Lofland and A. K. Ganguli, J. Phys. Chem. C, 2008, 112, 12610–12615 CrossRef CAS.
- R. Ranjan, S. Vaidya, P. Thaplyal, M. Qamar, J. Ahmed and A. K. Ganguli, Langmuir, 2009, 25, 6469–6475 CrossRef CAS PubMed.
- N. Jongen, P. Bowen, J. Lemaître, J.-C. Valmalette and H. Hofmann, J. Colloid Interface Sci., 2000, 226, 189–198 CrossRef CAS.
- M. Rahimi-Nasrabadi, S. M. Pourmortazavi, A. A. Davoudi-Dehaghani, S. S. Hajimirsadeghi and M. M. Zahedi, CrystEngComm, 2013, 15, 4077–4086 RSC.
- B. Kumar, S. Saha, K. Ojha and A. K. Ganguli, Mater. Res. Bull., 2015, 64, 283–287 CrossRef CAS.
- T. Ahmad, R. Chopra, K. V. Ramanujachary, S. E. Lofland and A. K. Ganguli, Solid State Sci., 2005, 7, 891–895 CrossRef CAS.
- P. Calandra, A. Longo and V. Turco Liveri, J. Phys. Chem. B, 2003, 107, 25–30 CrossRef CAS.
- T. Li, A. J. Senesi and B. Lee, Chem. Rev., 2016, 116, 11128–11180 CrossRef CAS PubMed.
- Z.-H. Li, Chin. Phys. C, 2013, 37, 108002 CrossRef.
- D. S. Mathew and R.-S. Juang, Sep. Purif. Technol., 2007, 53, 199–215 CrossRef CAS.
- M. Li, H. Schnablegger and S. Mann, Nature, 1999, 402, 393 CrossRef CAS.
- L. Boldon, F. Laliberte and L. Liu, Nano Rev., 2015, 6, 25661 CrossRef PubMed.
- J. A. Lake, Acta Crystallogr., 1967, 23, 191–194 CrossRef CAS.
- J. T. Koberstein, B. Morra and R. S. Stein, J. Appl. Crystallogr., 1980, 13, 34–45 CrossRef CAS.
- Z. H. Li, Y. J. Gong, D. Wu, Y. H. Sun, J. Wang, Y. Liu and B. Z. Dong, Microporous Mesoporous Mater., 2001, 46, 75–80 CrossRef CAS.
- N. Cohaut, J. M. Guet and R. Diduszko, Carbon, 1996, 34, 674–676 CrossRef CAS.
- J. T. Koberstein and R. S. Stein, J. Polym. Sci., Polym. Phys. Ed., 1983, 21, 2181–2200 CrossRef CAS.
-
J. Kohlbrecher, SASfit: A program for fitting simple structural models to small angle scattering data, https://kur.web.psi.ch/sans1/SANSSoft/sasfit.pdf.
- I. Bressler, J. Kohlbrecher and A. F. Thunemann, J. Appl. Crystallogr., 2015, 48, 1587–1598 CrossRef CAS PubMed.
|
| This journal is © the Owner Societies 2019 |
Click here to see how this site uses Cookies. View our privacy policy here. 
 b,
Ashok K.
Ganguli
b,
Ashok K.
Ganguli