Crystal morphology fixed by interplay of π-stacking and hydrogen bonds – the case of 1-hydroxypyrene†
Roman
Gajda
 a,
Mateusz A.
Domański
ab,
Maura
Malinska
 a and
Anna
Makal
 *a
*a
aUniversity of Warsaw, Faculty of Chemistry, Biological and Chemical Research Centre, ul. Zwirki i Wigury 101, 02-096 Warsaw, Poland. E-mail: amakal@chem.uw.edu.pl
bWarsaw University of Technology, Warsaw, Faculty of Chemistry, ul. Noakowskiego 3, 00-664 Warsaw, Poland
First published on 31st January 2019
Abstract
The crystal structure of 1-hydroxypyrene fluorophore has been determined for the first time. Despite the simplicity of the molecule itself and the relatively low symmetry of the crystal structure (space group P21), the specific molecular arrangement and intermolecular interactions result in a rather conserved crystal morphology, to some extent dependent on the polarity of the solvents. The structure of 1-hydroxypyrene causes an unusual behavior of its single crystals under pressure: they increase in length and bend and then grow thicker irrespective of the solvent's polarity. Quantum mechanical calculations, covering estimation of intermolecular interaction energies and predicting the structural changes at increased pressure, shed light on the mechanism of this phenomenon. The whole crystal structure can be described as a set of ‘molecular springs’. Crystalline 1-hydroxypyrene also represents a relatively rare example of an H-aggregate which is luminescent in the solid state. The fluorescence spectra of 1-hydroxypyrene in the solid state resembles its spectra in water, reflecting a well-defined H-bond network in the crystal structure.
1 Introduction
Mechanical deformation (for instance bending) of a material in response to physical stimuli such as heat, light, and electric or magnetic field is one of the basic processes of energy conversion in nature. Single crystals can display photoinduced bending due to [2 + 2] and [4 + 4] photodimerization, cis–trans isomerism,1,2 thermosalient effects,3–5 and photosalient effects.6–8 In all such instances, the macroscopic deformation is strictly determined by the exact molecular arrangement in the crystal structure. Bending of crystals can also be induced by mechanical force when the crystal packing is anisotropic in such a way that strong and weak interactions appear in nearly perpendicular directions. Such anisotropic materials can only be deformed mechanically in a very specific manner.9One of the most intuitive and expected effects of exerting pressure on crystals is that a compressed crystal should simply shrink in every direction both macroscopically and on the level of the crystal unit cell. Examples of opposite behavior, the so-called negative linear or volume compressibility, are extremely rare10,11 and merit a thorough investigation of underlying mechanisms.
However, even if a more intuitive compression of crystal volume under external pressure is observed, in many cases it is primarily due to squeezing out of intermolecular voids rather than deformation of such synthons as for instance a hydrogen bond.12
The issue of H-bond behavior under pressure has been widely investigated and such specific aspects as correlation of H-bond length with pressure, bending, disordering, symmetrization of this interaction or conditions for its existence despite becoming repulsive have already been summarized by Sikka.13 A couple of short but interesting reviews describe a more recent point of view on the role of hydrogen bonds in molecular crystals under high pressure. In one of them a significant part of the paper is devoted to aromatic molecules.14 In the other new approaches a wider range of “weak interactions” within crystal structures are described.15 Developing studies of multi-component crystals, where hydrogen bonds play a crucial role in their formation,16 make understanding of H-bond behavior under pressure and the ability of predicting it a very important challenge. More generally, rationalizing thermo- and photosalient effects in some crystalline materials by analyzing accompanying structural changes under pressure can be used in the design of new supramolecular devices.17
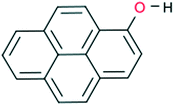
1-Hydroxypyrene (Fig. 1) is one of the simplest available pyrene derivatives, capable of forming H-bond networks. Although the preparation methods for this compound have been known for years,25,26 its crystal structure has not yet been determined. Its main application described in the literature is that of a biochemical indicator of polyaromatic hydrocarbon exposure in humans and laboratory animals.27,28
Like most pyrene derivatives, this compound is luminescent in response to UV light, which makes it a convenient marker in biochemical studies but also a promising model compound for investigations on how the crystal packing affects the luminescence properties of organic luminophores. Certain pyrene derivatives are known for their luminescence being largely sensitive to the molecular environment26 and there are known cases where aggregation in the solid state significantly enhanced the luminescence of such compounds.29
Our initial motivation was to investigate the luminescence propensities of 1-hydroxypyrene in the solid state, further denoted as pyrOH, and to determine its crystal structure both under ambient conditions and at high pressure. While preparing the samples for single crystal X-ray experiments, we observed that it displays a rather persistent morphology irrespective of the crystallization conditions, and in addition it shows strange behavior when re-crystallized at non-ambient pressure. Therefore we decided to investigate the factors determining the conserved morphology of pyrOH crystals and its unique mechanical behavior and relate the mechanical properties of these crystals to its structure.
We present the structural analysis of pyrOH, followed by a description of intermolecular interactions. The energy frameworks30 are then related to the attachment energies calculated for selected crystal faces used for the prediction of the crystal morphology. The variability of the crystal structure of pyrOH with pressure and the resilience of the H-bond network to the exerted pressure were modeled with theoretical density functional theory (DFT) calculations conducted using CRYSTAL17.31 The results of our computations were verified by comparing theoretically predicted unit cell parameters with the ones obtained experimentally from crystal samples in a diamond anvil cell (DAC). The thermal and pressure-related compressibility of pyrOH was estimated based on the experimental and theoretically predicted unit-cell parameters. Finally, the solid state fluorescence of pyrOH at ambient and increased pressure was investigated.
2 Experimental
98% pure 1-hydroxypyrene in the form of fine powder was purchased from Sigma-Aldrich. The analytical-grade solvents used in crystallization procedures were also purchased from the same company.2.1 Crystallizations
Recrystallization from several solvents, representing a whole spectrum of polarity, has been attempted in order to obtain single crystals of reasonable size and investigate a predominant morphology. The tested solvents were n-hexane, chloroform, anisole, dichloromethane, ethyl acetate, acetone, acetonitrile and methanol. In addition, a readily available 1![[thin space (1/6-em)]](https://www.rsc.org/images/entities/char_2009.gif) :
:![[thin space (1/6-em)]](https://www.rsc.org/images/entities/char_2009.gif) 4 dichloromethane
4 dichloromethane![[thin space (1/6-em)]](https://www.rsc.org/images/entities/char_2009.gif) :
:![[thin space (1/6-em)]](https://www.rsc.org/images/entities/char_2009.gif) methanol mixture was used. Crystallization attempts were made in 2 ml glass vials. Initial solubility tests were performed at room temperature by placing 2–5 mg of pyrOH in a vial, adding 50 μl of solvent and vortexing the sample at 3000 rpm for ≈10 s. In the case of a lack of solubility, 100 μl of solvent was added and vortexing was repeated. In the instances where pyrOH showed the best solubility, crystallizations were repeated at 10 °C and in the presence of n-hexane vapor.
methanol mixture was used. Crystallization attempts were made in 2 ml glass vials. Initial solubility tests were performed at room temperature by placing 2–5 mg of pyrOH in a vial, adding 50 μl of solvent and vortexing the sample at 3000 rpm for ≈10 s. In the case of a lack of solubility, 100 μl of solvent was added and vortexing was repeated. In the instances where pyrOH showed the best solubility, crystallizations were repeated at 10 °C and in the presence of n-hexane vapor.
An attempt to recrystallize pyrOH directly at high pressure in a DAC was conducted from a solution of ≈100 mg of pyrOH in 1 ml acetone.
Despite containing a large hydrocarbon moiety, pyrOH displayed the highest solubility in the most polar solvents, i.e.: acetone (>200 mg ml−1) and methanol (30 mg ml−1), while its solubility in n-hexane proved to be as little as <2 mg ml−1. The predominant morphology of the obtained crystals was that of a thin, long needle. It was the only morphology observed during recrystallizations from weakly polar solvents such as chloroform and anisole (Fig. 2a and b) and still present in recrystallizations from the more polar substances. In the cases of near-saturated solutions in acetone and methanol, which were evaporated at room temperature, pyrOH also formed thin plates, but the inherent tendency to form needles was still manifested in the rough edges of such plates (Fig. 2d and e) and a corrugated surface of the main faces (Fig. 3). Formation of imperfect plates was apparently easier in cases where significantly higher concentrations of pyrOH could be obtained.
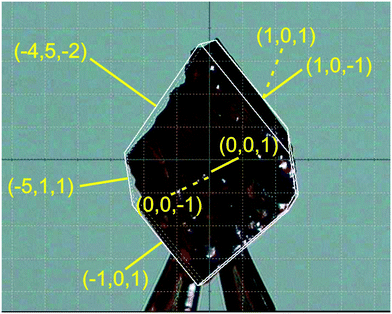 | ||
| Fig. 3 The largest single crystal of pyrOH harvested after crystallization from acetone. Face indices are in yellow. | ||
2.2 X-ray data collection
![[thin space (1/6-em)]](https://www.rsc.org/images/entities/char_2009.gif) :
:![[thin space (1/6-em)]](https://www.rsc.org/images/entities/char_2009.gif) 4 dichloroethane
4 dichloroethane![[thin space (1/6-em)]](https://www.rsc.org/images/entities/char_2009.gif) :
:![[thin space (1/6-em)]](https://www.rsc.org/images/entities/char_2009.gif) methanol solution was mounted on a Kapton loop with a drop of Paratone-N oil and flash-cooled in a cold nitrogen stream, using an Oxford Cryosystems cooling device. The data were collected and integrated with CrysAlis171 software32 and were corrected for absorption effects using a numerical method based on the determination of crystal faces in SCALE3 ABSPACK.33
methanol solution was mounted on a Kapton loop with a drop of Paratone-N oil and flash-cooled in a cold nitrogen stream, using an Oxford Cryosystems cooling device. The data were collected and integrated with CrysAlis171 software32 and were corrected for absorption effects using a numerical method based on the determination of crystal faces in SCALE3 ABSPACK.33
The structure was solved by the dual-space approach using SHELXD34 and refined with least-squares in SHELXL35 within the Olex236 graphical environment.
All hydrogen atoms were visible in the residual density map. The positions of the pyrene-bound H atoms were refined using riding-approximation, while the positions of hydroxyl H-atoms were refined without geometrical restraints. The crystallographic data are summarized in Table 1.
| Compound | pyrOH | |
|---|---|---|
| Crystal system | Monoclinic | Orthorhombic |
| Space group | P21 | P212121 |
| Empirical formula | C16H10O | |
| Formula weight | 218.24 | |
| a/Å | 13.8179(5) | 13.7979(3) |
| b/Å | 4.53024(16) | 4.52812(10) |
| c/Å | 16.5413(6) | 16.5713(3) |
| α/° | 90 | 90 |
| β/° | 90.096(3) | 90 |
| γ/° | 90 | 90 |
| Volume/Å3 | 1035.46(6) | 1035.35(4) |
| Z | 4 | 4 |
| μ/mm−1 | 0.086 | 0.086 |
| Max. transmission | 1 | 1 |
| Min. transmission | 0.53 | 0.53 |
| ρ calc mg mm−3 | 1.4 | 1.4 |
| F(000) | 456 | 456 |
| Crystal size/mm | 0.644, 0.509, 0.046 | 0.644, 0.509, 0.046 |
| R int | 0.0339 | 0.0382 |
| R sigma | 0.0295 | 0.0224 |
| Index ranges h k l | −19![[thin space (1/6-em)]](https://www.rsc.org/images/entities/char_2009.gif) : :![[thin space (1/6-em)]](https://www.rsc.org/images/entities/char_2009.gif) 19, −6 19, −6![[thin space (1/6-em)]](https://www.rsc.org/images/entities/char_2009.gif) : :![[thin space (1/6-em)]](https://www.rsc.org/images/entities/char_2009.gif) 6; −23 6; −23![[thin space (1/6-em)]](https://www.rsc.org/images/entities/char_2009.gif) : :![[thin space (1/6-em)]](https://www.rsc.org/images/entities/char_2009.gif) 23 23 |
−19![[thin space (1/6-em)]](https://www.rsc.org/images/entities/char_2009.gif) : :![[thin space (1/6-em)]](https://www.rsc.org/images/entities/char_2009.gif) 19, s-6 19, s-6![[thin space (1/6-em)]](https://www.rsc.org/images/entities/char_2009.gif) : :![[thin space (1/6-em)]](https://www.rsc.org/images/entities/char_2009.gif) 6; −23 6; −23![[thin space (1/6-em)]](https://www.rsc.org/images/entities/char_2009.gif) : :![[thin space (1/6-em)]](https://www.rsc.org/images/entities/char_2009.gif) 23 23 |
| Reflections collected | 25![[thin space (1/6-em)]](https://www.rsc.org/images/entities/char_2009.gif) 463 463 |
25![[thin space (1/6-em)]](https://www.rsc.org/images/entities/char_2009.gif) 463 463 |
| 2Θ range for data collection | 30.496 | 30.496 |
| 2.463 | 2.463 | |
| Temperature/K | 100.00(10) | 100.00(10) |
| X-ray wavelength/Å | 0.71073 | 0.71073 |
| Independent reflections I > 2σ(I) | 6121 | 3429 |
| Independent reflections | 6345 | 3576 |
| Largest diff. peak/hole/e Å−3 | 0.570 | 0.455 |
| −0.316 | −0.464 | |
| Goodness-of-fit on F2 | 1.096 | 1.198 |
| Parameters | 314 | 166 |
| Data | 6345 | 3576 |
| Restraints | 1 | 0 |
| R 1 all data | 0.0649 | 0.1160 |
| R 1 [I ≥ 2σ(I)] | 0.0628 | 0.1133 |
| wR2 [I ≥ 2σ(I)] | 0.1760 | 0.2654 |
| wR2 all data | 0.1776 | 0.2668 |
The structural data were deposited with CCDC with deposition number 1881470.†
Crystal structure solution and refinement procedures were performed as described in section 2.2.1. The solved and refined crystal structures were deposited with CCDC, with deposition numbers 1892293–1892314.†
![[thin space (1/6-em)]](https://www.rsc.org/images/entities/char_2009.gif) :
:![[thin space (1/6-em)]](https://www.rsc.org/images/entities/char_2009.gif) 4 dichloroethane
4 dichloroethane![[thin space (1/6-em)]](https://www.rsc.org/images/entities/char_2009.gif) :
:![[thin space (1/6-em)]](https://www.rsc.org/images/entities/char_2009.gif) methanol solution. Each of them was placed in a DAC of a modified Merrill and Bassett design37 together with a small piece of ruby, the latter serving as an internal pressure calibrant. The DAC was equipped with 0.5 mm cullet diamonds and a steel gasket of initial thickness of 0.2 mm and a 0.4 mm gasket hole. The DAC's nominal maximal opening angle was 40°. Paratone oil was used as a pressure-transferring medium. At each investigated pressure point, the pressure within the gasket hole was estimated by the ruby fluorescence method38,39 with an Almax Optiprexx PLS spectrometer affording a precision of 0.05 GPa.
methanol solution. Each of them was placed in a DAC of a modified Merrill and Bassett design37 together with a small piece of ruby, the latter serving as an internal pressure calibrant. The DAC was equipped with 0.5 mm cullet diamonds and a steel gasket of initial thickness of 0.2 mm and a 0.4 mm gasket hole. The DAC's nominal maximal opening angle was 40°. Paratone oil was used as a pressure-transferring medium. At each investigated pressure point, the pressure within the gasket hole was estimated by the ruby fluorescence method38,39 with an Almax Optiprexx PLS spectrometer affording a precision of 0.05 GPa.
A series of high-pressure single-crystal X-ray measurements were conducted for each of the two crystals using a SuperNova single source diffractometer (Ag radiation, λ = 0.56085 Å). The CrysAlis17132 program was applied for the data collection and their further reduction.
Due to the small thickness of the crystals and their limited scattering power in a DAC, it was impossible to determine crystal structures of publishable quality from the high pressure data. The unit cell parameters obtained at various pressures after full data reduction were used in further discussion and for comparison with the theoretical calculations. A summary of the obtained unit-cell parameters is presented in Table S7 in the ESI.†
2.3 Theoretical calculations
The calculations discussed in this paper, including intermolecular interaction energies, changes in the geometry of the crystal structure under pressure, band structures, densities of states and crystalline orbitals, were calculated with CRYSTAL17.31 We used the B3LYP functional augmented with an empirical dispersion term,40 the TZVP basis set for hydrogen atoms41 and the basis set of Heyd and coworkers for carbon and oxygen atoms.42 The level of accuracy of calculating the Coulomb and Hartree–Fock exchange terms was controlled using a set of TOLINTEG parameters, which were chosen as 7, 7, 7, 9, and 30. The atomic coordinates for the optimized structures are listed in sections 5 and 6 of the ESI.† Estimates of the Coulomb, dispersion, polarization and repulsive terms of the final intermolecular interaction energies were obtained from CrystalExplorer17.302.4 Morphological prediction
The morphologically important surfaces were calculated using the Bravais, Friedel, Donnay and Harker (BFDH) model.43–45 For each of the identified morphologically important surfaces, the lattice energy was partitioned with respect to its contribution to the growth process through the calculation of slice (Esl) and attachment (Eatt) energy. The attachment energy (AE) model was proposed in 1980 by Hartman and Bennema.46 The attachment energies were assumed to be directly proportional to the relative face-specific growth rates.| Elatt = Esl + Eatt | (1) |
| Rhkl ∝ Eatt | (2) |
The attachment energies were scaled as center-to-face distances, and a Wulff plot was constructed using Vesta3.47
Accounting for the interaction energy is critical to predict the crystal behavior and morphology model, and the presence of a solvent alters the relevant surface and synthon interactions due to solvation of the crystal surface. Though there have been a number of studies which successfully predicted the morphology of crystals as a function of the solvent environment, a universal method for predicting the dependence of the crystal morphology as a function of solvent choice is yet to be fully established.18–23 In view of this, a simpler approach, not accounting for solvent effects, was used.
2.5 Spectroscopic measurements
The UV-VIS fluorescence spectra of a single crystal under ambient conditions were recorded with a Fluorolog (Horiba JobinYvon) spectrometer equipped with an FL-1073 detector. A xenon lamp was used as a UV-VIS excitation source. A holographic grating with 1200 lines per mm was used. The single crystal (5 mm × 0.5 mm × 0.1 mm) was mounted on a UV-VIS transparent Mitegen plastic loop. The UV-VIS fluorescence spectra under non-ambient conditions were recorded with a Labram HR800 (Horiba JobinYvon) spectrometer coupled with an Olympus BX61 confocal microscope and equipped with a Peltier-cooled CCD detector (1024 × 256 pixels). A diode pumped, frequency doubled 532 nm Nd:YAG laser (output laser power 100 mW) and a 405 nm diode laser were utilized in turn as the excitation source. A holographic grating with 600 lines per mm was used. Calibration of the instrument was performed using a 520 cm−1 Raman signal of a silicon wafer. The spectra were collected at several pressures, coinciding with the pressures at which X-ray data were collected wherever possible. Analogously to the X-ray data, the pressure inside the gasket hole was determined by measuring the fluorescence of a reference ruby chip.3 Crystal structure
3.1 Space group determination
The lattice constants, in particular the cell angles which are 90° within uncertainties, suggest a choice of the orthorhombic system. Indeed, the structure can be solved in the frequently observed P212121 space group. However, such a choice requires the hydroxyl groups to be disordered over two alternative positions, with equal occupancies. Moreover, structure refinement in this space group is not satisfactory because of the following:a) R-Factors and weights are unsatisfactorily high.
b) The value of the Flack parameter (see Table 1) indicates racemic twinning, but introduction of an appropriate twin law does not improve the refinement.
c) The atomic displacement parameters in a part of the pyrene moiety are elongated, indicating some further disorder.
d) Last but not least, interpretation of the hydrogen bond network in the case where both the H-bond donor and acceptor are disordered can be problematic.
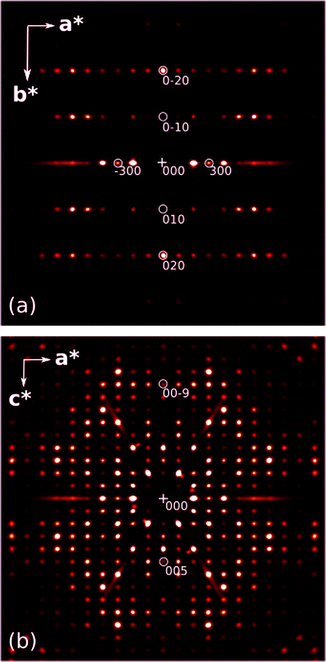
In fact, careful inspection of the systematic extinction pattern shows no evidence of h = 2n + 1 for h00 or l = 2n + 1 for 00l extinctions, which would be consistent with 21[100] or 21[001] screw axes in the P212121 space group, as illustrated in Fig. 4. Therefore, the final model was refined in the P21 space group, with the additional assumption of pseudo-merohedral twinning. Inclusion of this particular twinning significantly improved the final refinement parameters (see Table 1) and turned out to be fully consistent with the observed crystal morphology, described in more detail below.
3.2 Structure description
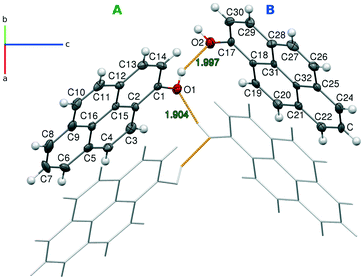
The final structure of pyrOH comprises two independent molecules in the asymmetric unit and four molecules in the unit cell. The independent molecules will be further denoted as A and B. An Ortep representation with the numbering scheme and a trace of H-bonds connecting these molecules is presented in Fig. 5.The pyrene moieties in both molecules are flat, with C–C bond lengths typical for an aromatic hydrocarbon. pyrOH-A and pyrOH-B differ only in the surrounding of the hydroxyl groups. In the case of A, the O1–C1 distance is slightly longer and the H1 atom is twisted further away from the pyrene plane. Also, this molecule features more elongated atomic displacement parameters at atoms C7, C8 and C9, indicating more lateral mobility.
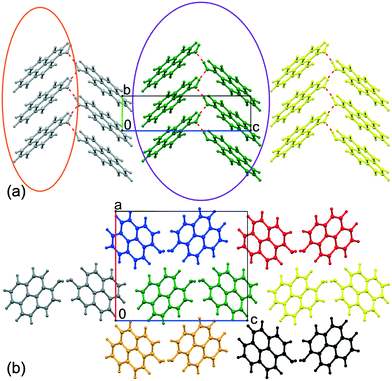
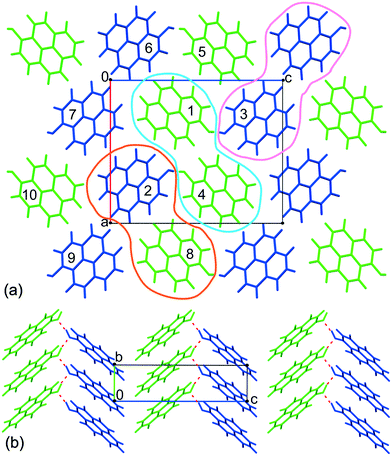
The two independent molecules form an infinite chain of hydrogen bonds (Table 2), stretching in the [010] direction. At the same time, the molecules bound by the chain of H-bonds are π-stacked, forming infinite columns in the same [010] direction (Fig. 6a). Apart from the H-bonds, the remaining interactions of these columns involve contacts between the pyrene edges and consist of H⋯H and long C⋯H contacts.
| Donor | O⋯O | O–H | H⋯O | O–H⋯O | Acceptor |
|---|---|---|---|---|---|
| Molecule A | 2.729(5) | 0.84(8) | 1.98(8) | 148(7) | Molecule B |
| 2.709 | 0.99 | 1.74 | 167 | ||
| Molecule B | 2.727(5) | 0.96(7) | 1.80(7) | 161(6) | Molecule A |
| 2.673 | 0.99 | 1.70 | 168 |
The distances between the planes of two adjacent molecules in a column are quite short, 3.428(5) Å and 3.403(5) Å in the case of molecules A and B, respectively. The slight difference in the interplanar distances results from different angles between a pyrene plane and the stacking direction, which are 39.9(6)° for molecule A and 41.8(6)° for B. The angle between the pyrene planes of the two independent molecules is 32.6(6)°. Notably, in this polar group all H-bond chains are directional, and all –OH groups bend out of the pyrene plane in the same direction.
The geometry of hydrogen bonds within the structure without external pressure is described in Table 2.
Taking into account that molecules form parallel stacks and the angles between pyrene planes and the stacking direction are wider than 32°, the crystal structure of pyrOH is a very nice model of an H-aggregate.48
3.3 Energy of intermolecular interaction
Despite the fact that the pyrOH molecule is relatively simple, an intricate network of intermolecular interactions is the determining factor for the crystal morphology of pyrOH and the behavior of this material under pressure. As there are different levels of complexity involving these interactions, we are going to describe them step by step from the lowest molecular level towards more complicated substructures. All energies were derived from an optimized crystal structure.When considering bimolecular relationships, there are three types of possible interactions: between A molecules only (within the light blue band in Fig. 7a), between B molecules only (within the pink band) and between one A molecule and one B molecule (orange band). The energies of interaction within such bimolecular arrangements are not identical.
There are twenty neighboring molecules within the first coordination sphere of each independent molecule. Taking into account molecules A and B results in over 30 unique intermolecular contacts to consider. Fortunately, only 15 of these interactions are significant, i.e. the energy of such interactions is more negative than −8 kJ mol−1. The procedure of calculation is described in detail in section 1 of the ESI.†
Molecules connected by H-bonds (see Fig. 7b) can be expected to yield the most stabilizing interaction energies. The calculated interaction energies of such molecular dimers are presented in Table 3. The H-bonds appear relatively weak. The shorter H⋯O distance correlates with a slightly more negative interaction energy.
| Donor | Acceptor | Translation along [010] | Energy [kJ mol−1] | d O⋯H [Å] |
|---|---|---|---|---|
| Molecule A | Molecule B | 1/2 | −24.62 | 1.736 |
| Molecule B | Molecule A | 1/2 | −26.82 | 1.697 |
Apparently the strongest intermolecular interactions in the crystal structure of pyrOH are those between the π-stacked molecules within a single column (Fig. 6a). According to CRYSTAL17 they are −37.9 kJ mol−1 for the stacks of A molecules and −38.1 kJ mol−1 in the case of pairs of B molecules.
The distance between average planes of stacked A molecules in an optimized crystal structure is 3.427 Å and in the case of a column built of B molecules it is 3.424 Å.
The remaining, energetically much less significant, type of interaction is the case where two molecules come into contact with the edges of pyrene rings (edge-to-face interactions). In the case of two A molecules arranged in this way, the interaction energy equals −11.61 kJ mol−1, while in the case of two B molecules: −9.74 kJ mol−1.
| Column | Column | Energy [kJ mol−1] |
|---|---|---|
| 1 | 3 | −94.76 |
| 2 | 4 | −94.76 |
| 1 | 4 | −35.36 |
| 1 | 5 | −32.68 |
| 2 | 7 | −32.02 |
| 1 | 6 | −31.62 |
| 2 | 8 | −31.62 |
| 1 | 2 | −31.42 |
| 1 | 7 | −29.63 |
| 2 | 10 | −29.63 |
| 2 | 9 | −22.04 |
As expected, the highest energy of interaction, −94.76 kJ mol−1, appeared between columns where molecules are connected by hydrogen bonds (Fig. 6a, molecules within the purple boundary). Interaction energies between other columns varied around −32 kJ mol−1, in the case of column 2 and column 9 being only −22 kJ mol−1.
Such disproportion between inter-column energies shows pyrOH as an assembly of relatively weakly bound pairs of columns, or double columns, described in more detail below.
| Double-column | Energy [kJ mol−1] |
|---|---|
| Blue | −45.74 |
| Red | −16.42 |
| Yellow | −14.89 |
| Black | −11.36 |
| Orange | −46.17 |
| Grey | −14.90 |
The most energetically significant interactions are between the central (green) and either the blue or orange double-column, i.e. between the double columns arranged in the [100] direction. The energy of these interactions is ca. −46 kJ mol−1. Interactions between the central double-column and its neighbors in [001] or diagonal directions are three times weaker.
Such distribution of interaction energies shows significant anisotropy and already suggests that crystal growth cannot indeed proceed with the same speed in all directions. It might be expected that once H-bond-bound double columns are formed, their assembly will be slowest in the [001] direction.
| Interaction | Total | Dispersion | Electrostatic | Polarization | Repulsion |
|---|---|---|---|---|---|
| π-Stacking | −47.8 | −82.6 | −14.1 | −4.0 | +67.9 |
| H-bond | −8.8 | −14.9 | −1.5 | −0.6 | +10.2 |
| Edge-to-edge | −11.9 | −13.3 | −5.9 | −0.7 | +10.6 |
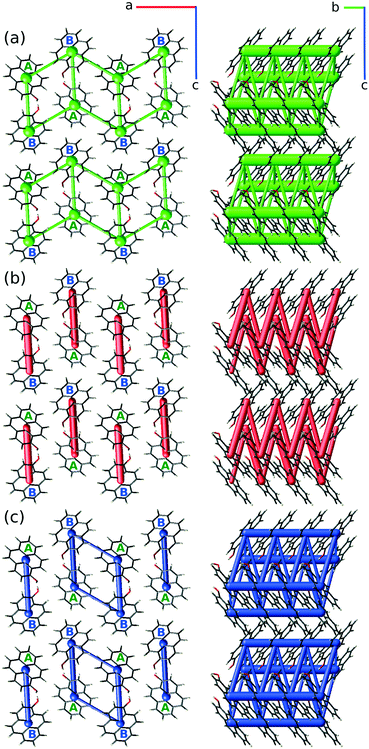
In general, the Crystal Explorer version 17.5 algorithm underestimates the total interaction energies in the cases of H-bonds, while the results for π-stacking and ‘edge-to-face’ interactions are in agreement with CRYSTAL17 within ±5 kJ mol−1. It is immediately apparent that while interactions between A and B molecules bound with H-bonds are mainly electrostatic in character, the remaining two interaction types are mainly dispersive. Also, the π-stacked columns are very well distinguishable from the energy framework perspective, bound by the strongest intermolecular interactions (thick ‘bars’ along the [010] direction). Interestingly, the electrostatic component of the energy frameworks clearly distinguishes the double-column substructure in the form of a zig-zag, or a spring, in the [010] direction. The total energy term gives a slight preference for the interactions within a single unit cell, i.e. confirming that at least some double-columns are prone to be more strongly attracting one another in the [100] direction, in general agreement with CRYSTAL17 calculations.
The interactions between molecules from adjacent double-columns are ≈4 times weaker (considering total energy) or over 5 times weaker (considering the dispersion energy term), then between molecules from double column constituents.
3.4 Morphology
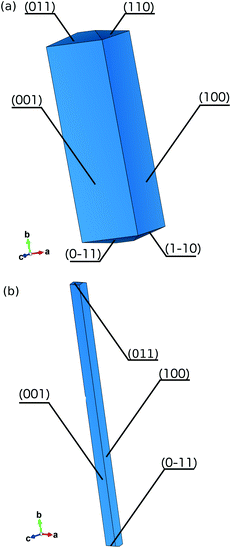 | ||
| Fig. 9 The morphology of the crystal predicted by the BFDH model (a) and the AE model (b). Only half of the facets were described, the rest can be generated by the 2-fold symmetry parallel to b. | ||
To take into account structural intricacies we implemented the attachment energy model to predict the crystal habit (Fig. 9). The {100} and {001} slabs are formed by cutting through the hydrogen bonds and T-shaped interactions, resulting in the attachment energy of −9.6 kJ mol−1 and −12.7 kJ mol−1, respectively (Table 7). These energy values are directly comparable to the ‘edge-to-edge’ interaction energies and hence to interaction energies between adjacent double-columns. For all other faces, constructing parallel slabs requires splitting dimers of four times stronger interactions, i.e. π⋯π stacking. This explains why only the first two facets have significant morphological importance and the predicted crystal is shaped like a needle.
| Facets | {001} | {100} | {0–11} | {011} |
|---|---|---|---|---|
| d | 16.3 | 13.5 | 4.3 | 4.3 |
| E att | −9.6 | −12.7 | −248.8 | −248.8 |
| M.I | 56 | 42 | 2 | 2 |
BFDH prediction for the structure in the P212121 space group (in the same unit cell setting, not illustrated) yields {101} and {10–1} faces as showing the slowest growth and being the most prominent, with {002} faces being smaller and the (011), (0–11), (1–10) and (110) groups of faces even smaller, but still much more significant than in the P21 symmetry.
The overall shape of the biggest harvested single crystal is a plate (Fig. 3), with definitely the largest faces being {001}. The {101} and {10–1} faces are narrow but clearly visible. The {−100} face is barely visible. In the general [010] direction, no contiguous well-formed faces could be found, as it is a polar direction. The crystal ends in a series of small kinks, showing a preference for crystal growth towards long, thin needles. Even the best-formed {001} crystal faces have a wavy surface, as though they were formed from thin needles bundling loosely together. Such a morphology, with the best-formed {001} faces and both {101} and {10–1} present may be explained by the combination of the monoclinic P21 phase with m[001] twinning (the m[001] twin law transforms the {10–1} face into {101}, not allowed in the pure P21 morphology).
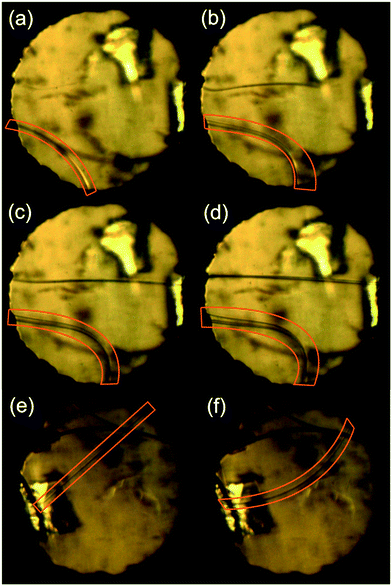
The phenomenon of twisted crystals is already known and extensively described in the literature.50 There is even an example of crystals of pyrene, where twisted crystals are composed of misoriented plates resembling complex twins.51 However, we believe that in the case of crystals of pyrOH under pressure the mechanism of bending is different. Crystals are simply so pliable that during crystal growth they can easily bend, up to almost 90°, rather than grow thicker.
Molecules of pyrOH form double-columns kept together by coinciding networks of H-bonds and close π-stacking. In terms of interaction energies, these columns are strongly bound together, but relatively weakly connected with adjacent substructures, making the crystal structure resemblant of a spring mattress. The double-column (or a ‘spring’) direction coincides with the long axis of a needle crystal and allows for the crystal's flexibility. The coincidence of the two strongest intermolecular interactions in a double column results in a strong preference of molecules to attach at the long ends of the existing columns rather than at their sides. From a macroscopic perspective, the crystal would rather grow at the long end of the needle than form another layer in other direction and grow thicker. Meanwhile under standard conditions, the presence of a polar solvent capable of H-bond formation (e.g. methanol, acetone) would diminish this tendency and allow the formation of plates of reasonable thickness (Fig. 2d and e); at increased pressures the role of the solvent's polarity in the pyrOH crystallization process apparently diminishes.
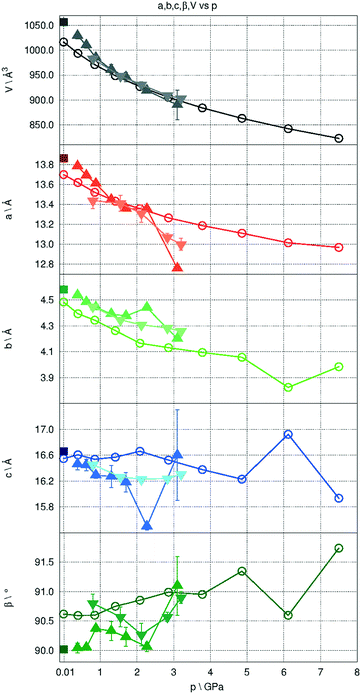
One obvious consequence of increasing pressure is that the unit cell shrinks as atoms change their positions trying to adapt to more dense packing. The decreasing predicted cell volumes follow an exponential trend, which agrees well with experimental observations (Fig. 11).
The hydrogen bonds connecting the –OH groups within double-columns of molecules form a zigzag within the bc crystal plane, aligned with the b axis, while a is the direction of the weakest intermolecular and inter-column interactions. As a consequence, a and b behave in a slightly different way compared to c under increasing pressure. In the range between 0 and 7.5 GPa the a and b parameters are shrinking constantly by 5.3% and 11.2%, respectively, whereas the c parameter seems to change the least up to 2.06 GPa and above this pressure is nearly constant.
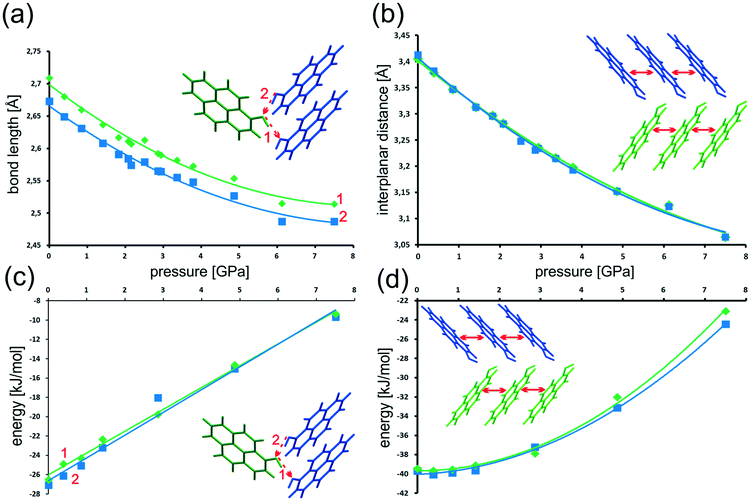
The geometry of the energetically most significant intermolecular interactions O–H⋯O hydrogen bonds and π⋯π stacking was also noted at several pressures. Tables with selected bond lengths and angles are reported in section 2 of the ESI.† With an increase in pressure (within the range from 0 to 7.5 GPa), the length of the hydrogen bond is shortening by ca. 7%, (Fig. 12a). The slight distinction in the geometries of the two H-bonds is still preserved.
Simultaneously, we observe a linear change of the H-bond energy from −26.5 kJ mol−1 (A molecule) and −27.1 kJ mol−1 (B molecule) under normal conditions to only −9.4 kJ mol−1 and −9.7 kJ mol−1 at 7.5 GPa, respectively (Fig. 12c). In each case this is a change of about over 17 kJ mol−1. Even the smallest change of hydrogen bond length has immediate consequences for the energy of intermolecular interaction.
Notably, shrinking of the H-bond length follows an asymptotic trend, with nearly identical values obtained for the two highest pressure points. As the H-bond interaction energy becomes less-and-less stabilizing, the shrinking stops, apparently counteracted by other changes in the crystal structure.
The situation with π⋯π stacking, the other most significant intermolecular interaction, is slightly different. The distance between parallel pyrene rings of neighboring molecules decreases monotonously with the increase of pressure (see Fig. 12b). However, pressure of up to ≈1.5 GPa has almost no effect on the interaction energies (Fig. 12d). Above 1.5 GPa the interaction energy rapidly becomes less negative. In the pressure range from 0 to 7.5 GPa the interplanar distance is shrinking by about 0.35 Å (10%), which causes destabilization of the interaction energy by ≈15 kJ mol−1. Such behavior is typical for a predominantly dispersive interaction.
In relative terms, at >7.5 GPa the π-stacking interactions are still significantly stabilizing the crystal structure, while H-bonds approach the repulsive regime (0 kJ mol−1 interaction energy expected at ≈10.0 GPa).
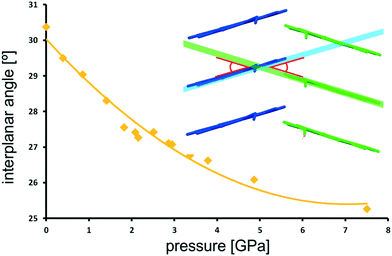
There are two independent molecules in the asymmetric unit, belonging to different columns of stacked pyrene moieties (Fig. 7), and the angle between the two pyrene planes can be defined. The increasing pressure is accompanied by the flattening of this angle (Fig. 13). Within the investigated pressure range it is changing by over 5° (17%), following an asymptotic trend toward the final value of ≈25°.
The theoretically predicted geometry changes were partly validated by comparison with the results of X-ray diffraction experiments using DACs. While the weak scattering power of the pyrOH crystal made structure determination under pressure troublesome, the unit cell parameters and symmetry could still be reliably assigned. The comparison of unit cell parameters predicted theoretically to those obtained experimentally is presented in Fig. 11. The theoretical and experimental unit-cell volumes follow the same trend and are of very similar values, showing very good overall agreement. Some small discrepancies appear in the case of individual a and b unit cell parameters. Notably, the length of the c lattice parameter was also the least consistent, and therefore the least reliable in the course of EOS calculations.
An analogous case was observed by Nobrega and coworkers,52 who investigated the crystal structure of aniline under pressure. The molecular arrangement along zigzag hydrogen bonded chains in that case is very similar to the structure of pyrOH. Nobrega and coworkers explained that one of the lattice parameters was not contracting because N–H⋯N bonds were likely entering into a repulsive region.
In the present case, such a statement would also apply. As the H-bond approaches the compression stage at which it ceases to be stabilizing, it acts as a rigid element, as illustrated by the arrested decrease in H-bond length above 6.0 GPa (Fig. 12). A zig-zag chain of such bonds may act as a spring or a rack. Significant compression in the vertical direction of such a spring (here along [010]) will be compensated by slight broadening in the perpendicular direction [001], which will counteract pressure-related contraction, and result in the lack of compression along c. The flattening of the angle between pyrene planes of A and B molecules may be likened to flattening a hinge in the H-bond rack.
3.5 Strain analysis
The concept of a molecular spring, or a rack, can be characterized more quantitatively by the principal strain axes analysis, which we performed using the PASCal server.53 This approach allows the quantification of the compressibility of a material and identification of the directions which are the most important mechanically in the crystal structure, which may, or may not coincide with crystallographic directions in low-symmetry systems.There is noticeable anisotropy in the unit cell deformations of pyrOH occurring either with temperature or pressure. The [010] direction, the special b crystallographic axis and at the same time the direction of the infinite H-bond chain and π-stacking is the one most susceptible to thermal expansion (Fig. 14 and Table 8) and at the same time the most compressible. This is in general agreement with the opposite behavior of several organic materials in response to an increase in either temperature or pressure.54,55 This can justify a comparison of the main pyrOH packing motif with a molecular spring.
| (a) | |||||
|---|---|---|---|---|---|
| Component along the crystallographic axis | |||||
| Principal axis, i | α(MK−1) | a | b | c | Approx. dir. |
| 3 | 57.3(1.5) | 0 | −1 | 0 | [010] |
| 2 | 41.6(8) | 0.9236 | 0 | 0.3833 | [301] |
| 1 | 33.5(5) | 0.5148 | 0 | −0.8573 | [10–2] |
| (b) | |||||
|---|---|---|---|---|---|
| Component along the crystallographic axis | |||||
| Principal axis, i | K(TPa−1) | a | b | c | Approx. dir. |
| 1 | 19.9(2.2) | 0 | −1 | 0 | [010] |
| 2 | 15.5(2.0) | −0.9444 | 0 | −0.3288 | [301] |
| 3 | 5.0(2.2) | −0.4488 | 0 | 0.8936 | [10–2] |
| (c) | |||||
|---|---|---|---|---|---|
| Component along the crystallographic axis | |||||
| Principal axis, i | K(TPa−1) | a | b | c | Approx. dir. |
| 1 | 15.5(1.1) | 0 | 1 | 0 | [010] |
| 2 | 8.1(2) | 0.9989 | 0 | 0.0407 | [100] |
| 3 | 3.6(1.4) | −0.0556 | 0 | 0.9985 | [001] |
Where thermal expansion is concerned, the remaining principal strain axes are [10–2] and [301], roughly close to [00–1] and [100] (Table 8), both with significant and very similar strain values. A projection of the H-bond chain on the plane defined by these vectors (the (010) plane) would be marked in the [001] direction, binding the neighboring stacks in pairs or double-columns. The remaining interactions in the (010) plane are those between double columns, as illustrated in Fig. 6 and 8b, all relying on H⋯H contacts and therefore posing little restriction to thermal expansion.
In the case of hydrostatic compression, the principal strain axes are the same as above (Table 8), but there is a marked difference in compressibility along the two main axes. The material is unquestionably least compressible in the [10–2] (≈[00–1]) direction. As was already stated, this direction coincides with the projection of the H-bond chain and will be sensitive to lateral changes in the geometry of this chain. As significant compression occurs in [010] and H-bond lengths show only moderate geometrical changes, such compression is compensated by a lateral expansion in [001]. This is a ‘wine-rack mechanism’ leading in extreme cases to negative linear compression (NLC) in several interesting inorganic and organometallic materials.10,56,57 Such an assumption can be further supported by the analysis of the compressibility indicatrix based on theoretical calculations (Fig. 14 and Table 8). Here the least compressible direction is very close to [001], i.e. exactly co-linear with the lateral component of the H-bond.
3.6 Luminescence vs. electronic structure at variable pressure
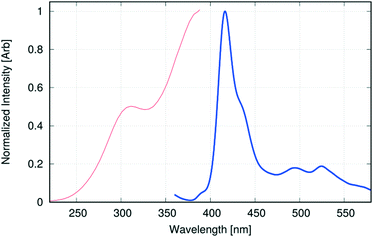
1-Hydroxypyrene, similarly to pyrene, is fluorescent when excited with near UV light. Analogously to pyrene, the main electronic excitation process involves π → π*, HOMO → LUMO transition, followed by very fast radiative relaxation to the ground state. While the photophysics of pyrOH in solution have been thoroughly investigated,58 there is no literature concerning UV-VIS absorption or emission of pyrOH in the solid state. According to Milosavljevic and Thomas, the luminescence of pyrOH in solution strongly depends on pH and consequently on the formation of a pyrO− anion, which produces strong emission at longer wavelengths with respect to the protonated pyrOH. As all –OH groups in the crystalline pyrOH are involved in H-bonds, it may be inferred that the anionic pyrO− cannot be observed in the solid state and the emission in that state, if any, will be similar to the emission from neutral pyrOH in solution.The experimentally obtained single-crystal fluorescence spectra under ambient conditions (Fig. 15) indeed closely resemble the spectra of 1-hydroxypyrene in water,58 with its discrete structure partly discernible and maxima at 390 nm (weak), 416 nm and 435 nm. The H-bond network in the crystal structure may to some extent resemble a similar network built from 1-hydroxypyrene with water molecules. The difference with respect to the fluorescence spectra in solution is a long tail stretching beyond 550 nm, with two small maxima at 495 nm and 525 nm. In analogy to other pyrene derivatives, fluorescence in that range may indicate excimer formation in the solid state. However, the main response to the excitation still comes from the monomers of 1-hydroxypyrene.
The observed fluorescence classifies pyrOH as one of the infrequent and interesting cases, where H-aggregation does not lead to fluorescence quenching, even though a chain of H-bonds provides a potential path for non-radiative decay of excited states. H-aggregates quite often result in efficient luminescence quenching.59,60 Less fortuitously for our research, 1-hydroxypyrene requires very short excitation wavelengths, as shown by the excitation spectra of the single crystal (Fig. 15), with maxima at as low as 311 nm and ≈380 nm.
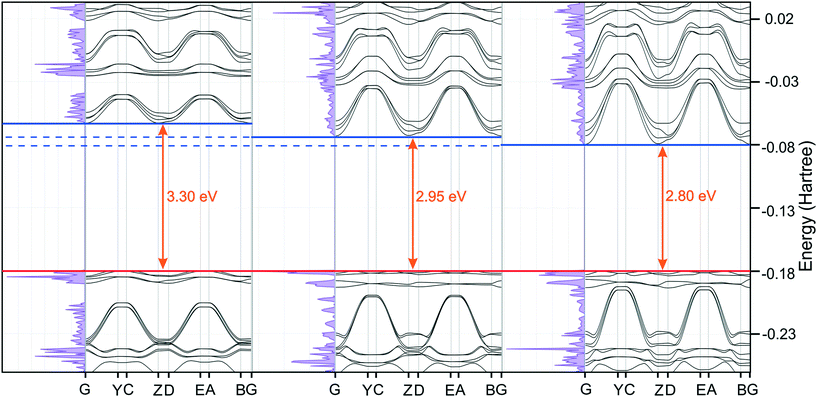
While compressing a crystal structure consisting of π-stacks, one could expect the gap between the highest occupied and lowest unoccupied energy levels to shrink, resulting in the red-shift of the absorbed and, consequently, emitted energy. This hypothesis is supported by the theoretical computations. Comparison of the density of states (DOSS) plots across a series of pressures shows that the gap between the highest occupied and the lowest unoccupied energy levels is shrinking from 3.3 eV (ambient pressure) to 2.8 eV (7.5 GPa). Interestingly, the energy gap predicted for ambient pressure would indicate a maximum absorption wavelength at λmax = 377 nm, very close to the experimentally observed excitation maximum.
Combined DOSS and band plots, typical for an insulator, are presented in Fig. 16. The significant decrease in the band gap width seems to be mainly due to stabilization (i.e. energy lowering) of the lowest unoccupied energy levels. The decrease of the band gap would suggest that the absorption λmax should increase to ≈423 nm at 2.9 GPa and to 456 nm at 7.5 GPa. The red-shift of emission should follow and therefore pyrOH fluorescence might be observed at increased pressures.
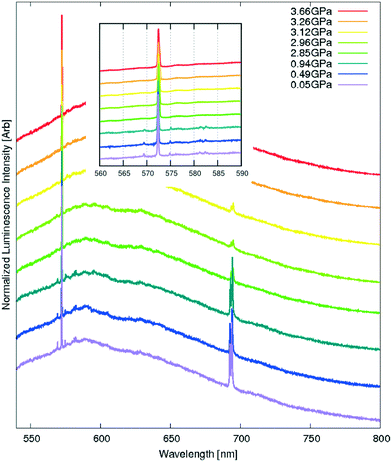
The recorded spectra at high pressure (Fig. 17), however, showed no shift of the luminescence maximum between the atmospheric pressure and 3.66 GPa and seemed to be dominated by the residual luminescence of the pressure media. The most plausible reason may be the limitations of the experimental set-up. The lowest excitation wavelength available for high-pressure experiments was 532 nm, and the minimum fluorescence wavelength to be observed was ≈540 nm. The photon absorption would be inefficient at those excitation wavelengths and only the tail of emission would be available for observation. Since the intensities in the tail were small to begin with, they would be too weak to register above the signal from the pressure media even at the highest pressure obtained in a DAC (3.66 GPa would translate to a band gap of 2.89 eV and an absorption λmax of 425 nm).
The three sharp peaks at 569 nm, 572 nm and 575 nm, particularly well visible at lower pressures at an excitation wavelength of 532 nm, can be readily interpreted as Raman peaks arising from in-plane ‘breathing’ oscillations of the pyrene moiety. They do no shift with pressure, showing that this particular oscillation mode is not significantly restricted even at very high pressures.
4 Summary
In this work we described the crystal structure of 1-hydroxypyrene (pyrOH), a simple luminescent pyrene derivative capable of forming H-bonds. We investigated the properties of this material by means of multi-temperature and multi-pressure single crystal X-ray diffraction experiments supplemented by periodic DFT calculations involving geometry optimizations, calculation of intermolecular interaction energies and characterization of the electronic structure. Steady-state fluorescence spectra of crystalline pyrOH at ambient and increased pressures were also registered.A bit surprisingly, pyrOH crystallized in a chiral P21 space group, with two independent molecules differing slightly in their orientation with respect to the main crystallographic direction. PyrOH organizes in stacks or columns, simultaneously stabilized by infinite chains of intermolecular H-bonds and π-stacking of pyrene moieties. The H-bond chains form a zig-zag pattern in the bc plane and bind stacks of pyrOH molecules in strongly-interacting double-columns. The whole structure can be considered as a relatively loosely bonded assemblage of parallel double-columns, as illustrated by interaction energies obtained from DFT calculations and, more graphically, by the energy frameworks.30 As such, it is an example of a very anisotropic material with some interesting properties, similar to crystalline aniline,14 but with a set of stronger H-bonds. It is also a nice case of an H-aggregate in the solid state.
The crystal structure of pyrOH, with loosely interacting vertical motifs, determines a conserved morphology of obtained single crystals. The preferred crystal shape is a needle, {001} and {100} being the slowest-growing faces, with the ability to form imperfect plates in more polar solutions. This conserved morphology, predominant in less polar solvents, could be more effectively predicted using the concept of attachment energy in a modeling approach. The attachment energies were calculated with periodic DFT methods.
Crystallization of pyrOH at pressures in the range from 0.3 to 1.0 GPa resulted in the formation of thin needles even in polar solvents. Most interestingly, after the first stage of growing, crystals would rather elongate and bend to the point of breaking than increase in width. Apart from illustrating an extremely high preference of pyrOH towards a needle-like morphology, such behavior might be the result of a decreasing local dielectric constant of the solvent inside a DAC in the vicinity of the crystal surface, as recently proposed by Fumagalli et al. in their study on water in confined spaces.24 More systematic high-pressure crystallizations from a range of solvents would be necessary to prove that.
Periodic DFT calculations at a series of increased pressures up to 7.5 GPa allowed us to predict the changes in the crystal structure of pyrOH with pressure and in particular to characterize the most important intermolecular interactions in its crystal lattice in more detail. The results of these predictions were validated by comparing theoretically predicted unit cell parameters with those obtained in X-ray diffraction experiments.
The H-bonds appear to be a rather rigid part of the crystal structure, with the O⋯O distance resisting compression beyond ≈2.5 Å and retaining small but stabilizing interaction energy. The result of such rigidity incorporated in a zig-zag pattern results in a significant compressibility of the system in the b direction, compensated by almost no compression in the perpendicular c direction. The structure of pyrOH is therefore a fine example of a ‘wine-rack mechanism’ in the crystal lattice, leading in extreme cases to negative linear compression (NLC) in several interesting inorganic and organometallic materials.10,56,57 The crystal structure of pyrOH can also be viewed as a set of ‘molecular springs’ (one unit cell encloses one spring in the (010) plane), as illustrated by the interaction energy and by the way the pyrOH crystal structure expands with increased temperature: the b or [010] direction being the most flexible.
Steady-state fluorescence spectra of pyrOH under ambient conditions very closely resembles the spectra of 1-hydroxypyrene in water, with its discrete structure still partially discernible and maximum at 415 nm, and an additional small component at ≈500 nm. The latter may be assigned to excimer formation in the solid state. From the relative intensity of the signals, it may be inferred that excimer formation is a minor event in the crystal, and the major response comes from individual molecules, similar to the case in solution. The observed fluorescence establishes pyrOH as one of the infrequent and interesting cases, where H-aggregation does not lead to fluorescence quenching. Notably, the observed maximum excitation wavelength of 380 nm agrees very well with absorption λmax = 377 nm, estimated from the energy band gap of 3.3 eV predicted for the crystalline pyrOH by theoretical calculations.
Unfortunately, we were unable to observe luminescence from the crystalline sample of pyrOH at increased pressures, due to the limited excitation wavelength and the presence of additional signals from the high pressure media. Theoretical calculations indicate that the absorption λmax should increase with pressure and should reach ≈450 nm at about 7.5 GPa, making pyrOH fluorescence more easily observed under such conditions. Further experiments, with shorter excitation wavelengths and different pressure media, will be performed in the future.
5 Funding information
This study was financially supported by the National Science Centre Poland (NCN) based on decision DEC-2015/17/B/ST4/04216.Conflicts of interest
There are no conflicts to declare.Acknowledgements
Theoretical calculations were performed using the resources of WCSS grant 115 and Pl-grid grants amakalhp2 and amakalhp3. Michał Michalec from the Faculty of Chemistry, University of Warsaw, is acknowledged for his assistance in confirming the solid-state fluorescence spectra of pyrOH. Jarosław Kalinowski is acknowledged for many helpful discussions.Notes and references
- P. Naumov, S. C. Sahoo, B. A. Zakharov and E. V. Boldyreva, Angew. Chem., Int. Ed., 2013, 52, 9990–9995 CrossRef CAS PubMed.
- P. Naumov, S. Chizhik, M. K. Panda, N. K. Nath and E. Boldyreva, Chem. Rev., 2015, 115, 12440–12490 CrossRef CAS PubMed.
- M. C. Etter and A. R. Siedle, J. Am. Chem. Soc., 1983, 105, 641–643 CrossRef CAS.
- J. Gigg, R. Gigg, S. Payne and R. Conant, J. Chem. Soc., Perkin Trans. 1, 1987, 0, 2411–2414 RSC.
- P. Naumov, J. Kowalik, K. M. Solntsev, A. Baldridge, J.-S. Moon, C. Kranz and L. M. Tolbert, J. Am. Chem. Soc., 2010, 132, 5845–5857 CrossRef CAS PubMed.
- I. Colombier, S. Spagnoli, A. Corval, P. L. Baldeck, M. Giraud, A. Léaustic and P. Yu, Mol. Cryst. Liq. Cryst., 2005, 431, 195/[495]–199/[499] Search PubMed.
- I. Colombier, S. Spagnoli, A. Corval, P. L. Baldeck, M. Giraud, A. Leaustic, P. Yu and M. Irie, J. Chem. Phys., 2007, 126, 011101 CrossRef CAS PubMed.
- A. Natarajan, C. K. Tsai, S. I. Khan, P. McCarren, K. N. Houk and M. A. Garcia-Garibay, J. Am. Chem. Soc., 2007, 129, 9846–9847 CrossRef CAS PubMed.
- C. M. Reddy, K. A. Padmanabhan and G. R. Desiraju, Cryst. Growth Des., 2006, 6, 2720–2731 CrossRef CAS.
- A. B. Cairns, J. Catafesta, C. Levelut, J. Rouquette, A. van der Lee, L. Peters, A. L. Thompson, V. Dmitriev, J. Haines and A. L. Goodwin, Nat. Mater., 2013, 12, 212–216 CrossRef CAS PubMed.
- S. Sobczak and A. Katrusiak, Cryst. Growth Des., 2018, 18, 1082–1089 CrossRef CAS.
- A. Shinozaki, K. Komatsu, H. Kagi, C. Fujimoto, S. Machida, A. Sano-Furukawa and T. Hattori, J. Chem. Phys., 2018, 148, 044507 CrossRef PubMed.
- S. K. Sikka and S. M. Sharma, Phase Transitions, 2008, 81, 907–934 CrossRef CAS.
- S. Fanetti, M. Citroni, K. Dziubek, M. M. Nobrega and R. Bini, J. Phys.: Condens. Matter, 2018, 30, 094001 CrossRef PubMed.
- A. S. Batsanov, Acta Crystallogr., Sect. E: Crystallogr. Commun., 2018, 74, 570–574 CrossRef CAS PubMed.
- E. V. Boldyreva, Z. Kristallogr. Cryst. Mater., 2014, 229, 236–245 CAS.
- B. A. Zakharov and E. V. Boldyreva, CrystEngComm, 2019 10.1039/C8CE01391H.
- D. Winn and M. F. Doherty, AIChE J., 1998, 44, 2501–2514 CrossRef CAS.
- J. Chen and B. L. Trout, Cryst. Growth Des., 2010, 10, 4379–4388 CrossRef CAS.
- M. A. Lovette and M. F. Doherty, Cryst. Growth Des., 2013, 13, 3341–3352 CrossRef CAS.
- I. Rosbottom, C. Y. Ma, T. D. Turner, R. A. O'Connell, J. Loughrey, G. Sadiq, R. J. Davey and K. J. Roberts, Cryst. Growth Des., 2017, 17, 4151–4161 CrossRef CAS.
- Y. Wang and Z. Liang, CrystEngComm, 2017 10.1039/C7CE00474E.
- K. J. Kim and M. F. Doherty, AIChE J., 2015, 61, 1372 CrossRef CAS.
- L. Fumagalli, A. Esfandiar, R. Fabregas, S. Hu, P. Ares, A. Janardanan, Q. Yang, B. Radha, T. Taniguchi, K. Watanabe, G. Gomila, K. S. Novoselov and A. K. Geim, Science, 2018, 360, 1339–1342 CrossRef CAS PubMed.
- R. K. Sehgal and S. Kumar, Org. Prep. Proced. Int., 1989, 21, 223–225 CrossRef CAS.
- M. Petaccia, L. Giansanti, F. Leonelli, A. L. Bella, D. G. Villalva and G. Mancini, Chem. Phys. Lipids, 2016, 200, 83–93 CrossRef CAS PubMed.
- H. A. Jeng and C.-H. Pan, in Polycyclic aromatic hydrocarbons (PAHs)1-Hydroxypyrene (1-OHP)1-Hydroxypyrene as a Biomarker for Environmental Health, ed. V. R. Preedy and V. B. Patel, Springer Netherlands, Dordrecht, 2014, pp. 1–15 Search PubMed.
- P. Boogaard and N. van Sittert, Sci. Total Environ., 1995, 163, 203–209 CrossRef CAS PubMed.
- R. Flamholc, D. Plazuk, J. Zakrzewski, R. Metivier, K. Nakatani, A. Makal and K. Wozniak, RSC Adv., 2014, 4, 31594–31601 RSC.
- C. F. Mackenzie, P. R. Spackman, D. Jayatilaka and M. A. Spackman, IUCrJ, 2017, 4, 575–587 CrossRef CAS PubMed.
- R. Dovesi, A. Erba, R. Orlando, C. M. Zicovich-Wilson, B. Civalleri, L. Maschio, M. Rérat, S. Casassa, J. Baima, S. Salustro and B. Kirtman, Wiley Interdiscip. Rev.: Comput. Mol. Sci., 2018, 8, e1360 Search PubMed.
- R. O. D., CrysAlisPro 1.171.38.46, 2015 Search PubMed.
- SCALE3ABSPack, 2015, CrysAlisPro 1.171.38.46, Rigaku Oxford Diffraction, 2015, Numerical absorption correction based on gaussian integration over a multifaceted crystal model Empirical absorption correction using spherical harmonics, implemented in SCALE3 ABS Search PubMed.
- G. M. Sheldrick, Acta Crystallogr., Sect. A: Found. Crystallogr., 2008, 64, 112–122 CrossRef CAS PubMed.
- G. M. Sheldrick, Acta Crystallogr., Sect. C: Struct. Chem., 2015, 71, 3–8 Search PubMed.
- O. V. Dolomanov, L. J. Bourhis, R. J. Gildea, J. A. K. Howard and H. Puschmann, J. Appl. Crystallogr., 2009, 42, 339–341 CrossRef CAS.
- L. Merrill and W. A. Bassett, Rev. Sci. Instrum., 1974, 45, 290–294 CrossRef.
- G. J. Piermarini, S. Block, J. D. Barnett and R. A. Forman, J. Appl. Phys., 1975, 46, 2774–2780 CrossRef CAS.
- H. K. Mao, P. M. Bell, J. W. Shaner and D. J. Steinberg, J. Appl. Phys., 1978, 49, 3276–3283 CrossRef CAS.
- B. Civalleri, C. M. Zicovich-Wilson, L. Valenzano and P. Ugliengo, CrystEngComm, 2008, 10, 405–410 RSC.
- M. F. Peintinger, D. V. Oliveira and T. Bredow, J. Comput. Chem., 2013, 34, 451–459 CrossRef CAS PubMed.
- J. Heyd, J. E. Peralta, G. E. Scuseria and R. L. Martin, J. Chem. Phys., 2005, 123, 174101 CrossRef PubMed.
- A. Bravais, Études Crystallographiques, Gauthier-Villars, Paris, France, 1866 Search PubMed.
- M. Friedel, Mineralogique, 1907, 30, 326 Search PubMed.
- J. Donnay and D. Harker, Am. Mineral., 1937, 22, 446 CAS.
- P. Hartman and P. Bennema, J. Cryst. Growth, 1980, 49, 145 CrossRef CAS.
- K. Momma and F. Izumi, J. Appl. Crystallogr., 2011, 44, 1272–1276 CrossRef CAS.
- S. Varghese and S. Das, J. Phys. Chem. Lett., 2011, 2, 863–873 CrossRef CAS PubMed.
- M. J. Turner, S. P. Thomas, M. W. Shi, D. Jayatilaka and M. A. Spackman, Chem. Commun., 2015, 51, 3735–3738 RSC.
- A. G. Shtukenberg, Y. O. Punin, A. Gujral and B. Kahr, Angew. Chem., Int. Ed., 2014, 53, 672–699 CrossRef CAS PubMed.
- S. Ibe, R. Ise, Y. Oaki and H. Imai, CrystEngComm, 2012, 14, 7444–7449 RSC.
- M. M. Nobrega, E. Teixeira-Neto, A. B. Cairns, M. L. A. Temperini and R. Bini, Chem. Sci., 2017, 9, 254–260 RSC.
- M. J. Cliffe and A. L. Goodwin, J. Appl. Crystallogr., 2012, 45, 1321–1329 CrossRef CAS.
- A. L. Goodwin, M. Calleja, M. J. Conterio, M. T. Dove, J. S. O. Evans, D. A. Keen, L. Peters and M. G. Tucker, Science, 2008, 319, 794–797 CrossRef CAS PubMed.
- J. Marciniak and A. Katrusiak, J. Phys. Chem. C, 2017, 121, 22303–22309 CrossRef CAS.
- W. Cai and A. Katrusiak, Nat. Commun., 2014, 5, 4337 CrossRef CAS PubMed.
- A. L. Goodwin, D. A. Keen and M. G. Tucker, Proc. Natl. Acad. Sci. U. S. A., 2008, 105, 18708–18713 CrossRef CAS PubMed.
- B. H. Milosavljevic and J. K. Thomas, Photochem. Photobiol. Sci., 2002, 1, 100–104 RSC.
- N. S. S. Kumar, S. Varghese, C. H. Suresh, N. P. Rath and S. Das, J. Phys. Chem. C, 2009, 113, 11927–11935 CrossRef CAS.
- S. Ghosh, X.-Q. Li, V. Stepanenko and F. Würthner, Chem. – Eur. J., 2008, 14, 11343–11357 CrossRef CAS PubMed.
Footnote |
| † Electronic supplementary information (ESI) available: Detailed procedure of energy calculations in CRYSTAL, atomic coordinates and selected geometry descriptors from structures optimized at increased pressures, summary of multi-temperature and multi-pressure X-ray measurements, and tables of unit-cell parameters. CCDC 1881470, 1892293–1892314. For ESI and crystallographic data in CIF or other electronic format see DOI: 10.1039/c8ce02130a |
| This journal is © The Royal Society of Chemistry 2019 |

