
Rational molecular design: functional quinoline derivatives for PA detection, gaseous acid/base switching and anion-controlled fluorescence†
Yuqing
Ma
,
Yuyang
Zhang
,
Lin
Kong
and
Jiaxiang
Yang
 *
*
College of Chemistry & Chemical Engineering, Anhui University, Anhui Province Key Laboratory of Chemistry for Inorganic/Organic Hybrid Functional Materials, Hefei 230601, P. R. China. E-mail: jxyang@ahu.edu.cn
First published on 13th November 2018
Abstract
Three new D-π-A quinoline derivatives (G1, G2 and G3) were synthesized by facile methods. The three obtained ICT molecules revealed evident solvatochromic effect. Importantly, G1 and G2 can be effectively applied as powerful tools for PA detection in the monomer state with low limits of detection (LOD). The fluorescence quenching by PA can be attributed to the obstruction of ICT process in the quenching process. In solid-state, owing to reversible transformation by protonation and deprotonation, the three compounds exhibited excellent acid–base switching. Meanwhile, six compounds containing different anions (G2a, G2b, G2c, G2d, G2e, G2f) based on G2 were obtained by anion regulation in methanol. Importantly, the findings demonstrated distinct differences in the solid-state fluorescence of these compounds. These differences may arise from controlling anions to form different molecular packing arrangements.
1. Introduction
Conjugated organic molecules have attracted special attention due to their widespread applications in sensors,1–5 organic light-emitting diode (OLEDs)6–10 and smart materials.11–15 In order to better guide the molecular designs for their potential applications, it is of great importance to correctly and systematically understand the relationships between structure and property. Generally, to obtain fluorescence emission in the solid state, the most common approaches employed were to either design molecules by modifying various molecular backbone substituent groups and effectively control π-conjugation lengths or to hinder the intra/intermolecular interactions.16–19 Traditional fluorescence materials emit strong fluorescence in dilute solutions. Furthermore, it is worth highlighting that the development of strong fluorescence emission and high absolute quantum yield lead to weak fluorescence emission in solid state.20–23 Nowadays, the development of conjugated organic molecules with strong fluorescence in both monomeric and solid-states is of immense importance.In order to gain excellent organic molecules with strong fluorescence in both monomeric and solid-states, the rational design of molecules is critical for tuning molecular photophysical properties. Typically, 2-methylquinolin-4-amine, a large conjugated structure, has strong electron-withdrawing structural unit. Triphenylamine, N,N-dimethylaniline and coumarin are strong electron-donating structural units. With the above mentioned considerations in mind, the three quinoline derivatives could construct excellent donor-π-acceptor (D-π-A) molecules. Conjugated organic molecules are very possibly suitable candidates for chemical sensors because of easy availability and flexible molecular design. Due to serious pollution by 2,4,6-trinitrophenol (PA)24–37 and ambient acid gas, leading to environmental destruction and several human diseases,37–40 the three conjugated molecules have a potential application in sensing PA and acid gas. Furthermore, conjugated organic salts have evident advantages for the design of solid-state emitters because their photophysical properties could be controlled by both their cation and anion constituents.41–44 Different anions affect their photophysical properties in the solid-state, which could be assigned to the differences in molecular stacking modes. This anion-controlled approach provides a new strategy in molecular design. Therefore, an outstanding molecular design is a crucial factor for affecting the photophysical properties in both monomeric and solid-states.
In this study, we present facile methods to synthesize three molecules (G1, G2 and G3), which exhibited significant solvatochromic effect. G1 and G2 are used to trace the presence of PA selectively and sensitively in monomer state, and they are applied in visual PA detection. Density functional theory (DFT) calculations support the fluorescence quenching mechanism to hinder the ICT processes in these two molecules, which weakened and even quenched the fluorescence. In addition, in aggregated states, G1–G3 can effectively exhibit acid–base switching, which is attributed to their protonation and deprotonation. Moreover, we provide a method to control their photophysical properties by the introduction of different anions, and this difference may be explained by the discrimination in molecular stacking modes.
2. Experimental section
2.1. Materials and instruments
All chemicals and solvents including 7-(diethylamino)-2-oxo-2H-chromene-3-carbaldehyde (T), 4-(dimethylamino)benzaldehyde (N), 4-(diphenylamino)benzaldehyde (M), 4-aminoquinaldine, CH3OH, butanone, tetrahydrofuran (THF), benzene, CH2Cl2 (DCM), ethyl alcohol (EtOH), acetonitrile (ACN), and DMF, were purchased and used without further purification. NMR data was obtained from a Bruker 400 MHz spectrometer operated at 25 °C. FT-IR spectra were collected using the KBr pellet method on a Nicolet 380. UV-vis absorption spectra were recorded in a 1 cm quartz cell and fluorescence spectra were recorded in a 1 cm fluorescent colorimetric cell (Tokyo, Japan).2.2. Synthesis
The chemical structures and synthetic routes of the compounds are shown in Scheme 1. The detailed procedures are listed as follows. | ||
| Scheme 1 Synthetic routes of compounds G, G1, G2 and G3. | ||
G1 . FT-IR (KBr, cm−1): 3428, 3258, 3075, 2924, 2955, 2866, 1647, 1584, 1549, 1488, 1325, 1189, 1177, 1151, 756, 697. 1H NMR (DMSO-d6, 400 MHz, ppm) δ: 8.83 (s, 2H), 8.46 (d, J = 8.0 Hz, 1H), 8.21 (d, J = 8.0 Hz, 1H), 8.04 (t, 1H), 7.74 (m, 3H), 7.47 (s, 2H), 7.39 (t, 4H), 7.14 (m, 7H), 6.95 (d, J = 8.0 Hz, 2H), 4.64 (m, 2H), 1.76 (d, J = 8.0 Hz, 2H), 1.45 (m, 2H), 0.93 (t, 3H). 13C NMR (DMSO-d6, 100 MHz, ppm) δ: 156.4, 153.3, 149.2, 146.3, 140.7, 139.0, 134.5, 129.7, 128.2, 126.0, 125.1, 124.3, 121.0, 118.6, 117.5, 116.9, 100.9, 47.9, 30.4, 19.1, 13.6. HR-MS (ESI-MS): m/z = 470.2584, calcd. for [C33H32N3]+ = 470.2589 ([M − Br]+).
G2 . FT-IR (KBr, cm−1): 3312, 3145, 2923, 2864, 1635, 1604, 1578, 1548, 1525, 1470, 1435, 1377, 1336, 1319, 1284, 1190, 1177, 758, 696. 1H NMR (DMSO-d6, 400 MHz, ppm) δ: 8.69 (s, 2H), 8.43 (d, J = 8.0 Hz, 1H), 8.15 (d, J = 8.8 Hz, 1H), 8.02 (t, 1H), 7.67 (t, 3H), 7.48 (d, J = 15.5 Hz, 1H), 7.26 (d, J = 15.5 Hz, 1H), 7.08 (s, 1H), 6.79 (d, J = 8.0 Hz, 2H), 4.62 (m, 2H), 3.02 (s, 6H), 1.76 (d, J = 4.0 Hz, 2H), 1.45 (m, 2H), 0.95 (t, 3H). 13C NMR (DMSO-d6, 100 MHz, ppm) δ: 157.6, 154.3, 152.2, 143.6, 139.7, 134.8, 130.3, 124.8, 123.0, 119.0, 117.4, 114.16, 112.4, 100.7, 48.2, 40.6, 30.8, 19.6, 14.1. HR-MS (ESI-MS): m/z = 346.3268, calcd. for [C23H28N3]+ = 346.1284 ([M − Br]+).
G3 . FT-IR (KBr, cm−1): 3351, 3128, 2964, 2929, 2871, 1716, 1654, 1581, 1511, 1415, 1353, 1280, 1190, 1177, 756, 695. 1H NMR (CDCl3, 400 MHz, ppm) δ: 8.44 (d, J = 8.0 Hz, 1H), 8.05 (s, 1H), 7.74 (d, J = 15.3 Hz, 1H), 7.54 (m, 4H), 7.41 (d, J = 8.7 Hz, 1H), 7.21 (t, 1H), 6.60 (d, J = 8.0 Hz, 1H), 5.83 (s, 1H), 4.13 (s, 2H), 3.30 (m, 4H), 1.79 (s, 2H), 1.55 (m, 2H), 1.19 (t, 6H), 1.06 (t, 3H). 13C NMR (DMSO-d6, 100 MHz, ppm) δ: 159.8, 156.5, 155.7, 151.8, 145.4, 138.8, 136.8, 134.3, 130.7, 125.8, 124.7, 119.1, 118.3, 117.2, 113.3, 110.0, 108.4, 100.6, 95.6, 79.3, 48.1, 44.2, 30.4, 19.4, 13.5, 12.2. HR-MS (ESI-MS): m/z = 442.2466, calcd. for [C28H32N3O2]+ = 442.2495 ([M − Br]+).
3. Results and discussion
3.1. Solvatochromic effect
To investigate the fluorescence behaviors of compounds G1–G3 in different organic solvents, UV-vis absorption spectra and fluorescence emission (FL) spectra were measured in different solvents (benzene, DCM, THF, EtOH, ACN, and DMF) (Fig. 1 and S2 and S3†). All spectroscopic studies were carried out at ambient temperature and concentrations of the solutions were 1.0 × 10⁻⁵ mol L−1. It can be observed that the compounds G1, G2, and G3 have intramolecular charge transfer (ICT) absorption maxima in the range of 300–560 nm in low polarity solvents. The data calculated from the absorption and fluorescence spectra are summarized in Table S1 and S2.† The UV-vis absorption peak of compound G1 at 295 nm accounted for the characteristic absorption peak of triphenylamine group. Maximum absorption peaks of G2, and G3 presented low-energy bands at 350 and 360 nm, assigned to the respective π–π* transitions. Hence, compounds G1–G3 have the typical D-π-A structures. In the FL spectra plots (Fig. 2b), the compounds G1, G2 and G3 have significant changes in the emission peak positions in different polar solvents. The position of the emission peak of compound G1 was red shifted from 553 nm in benzene to 591 nm in DMF. For compound G2, the position of emission peak was red shifted from 551 nm in benzene to 581 nm in DMF. The position of the emission peak for compound G3 was red shifted from 556 nm in benzene to 599 nm in DMF. Generally, when the π–π* transition occurs, the excited state has a larger polarity than the ground state, which leads to a greater stabilizing effect of solvent polarity on the excited state. As a result, the emission peak shifts toward a longer wavelength with an increase in solvent polarity.45,46 The gradual red shift is caused may be due to the increase in solvent polarity to reduce the activation energy and the energy level of intramolecualr charge transfer. Therefore, the results showed that the fluorescence peaks were dependent on the polarity of solvents, i.e., they have significant solvatochromic effects in different solvents. Meanwhile, the configuration modes of G1, G2 and G3 are similar to the “propeller” type, which prevents them from forming π–π stacking. This results in fluorescence quenching in the solid state or aggregated state, suggesting potential applications in the field of electroluminescent materials.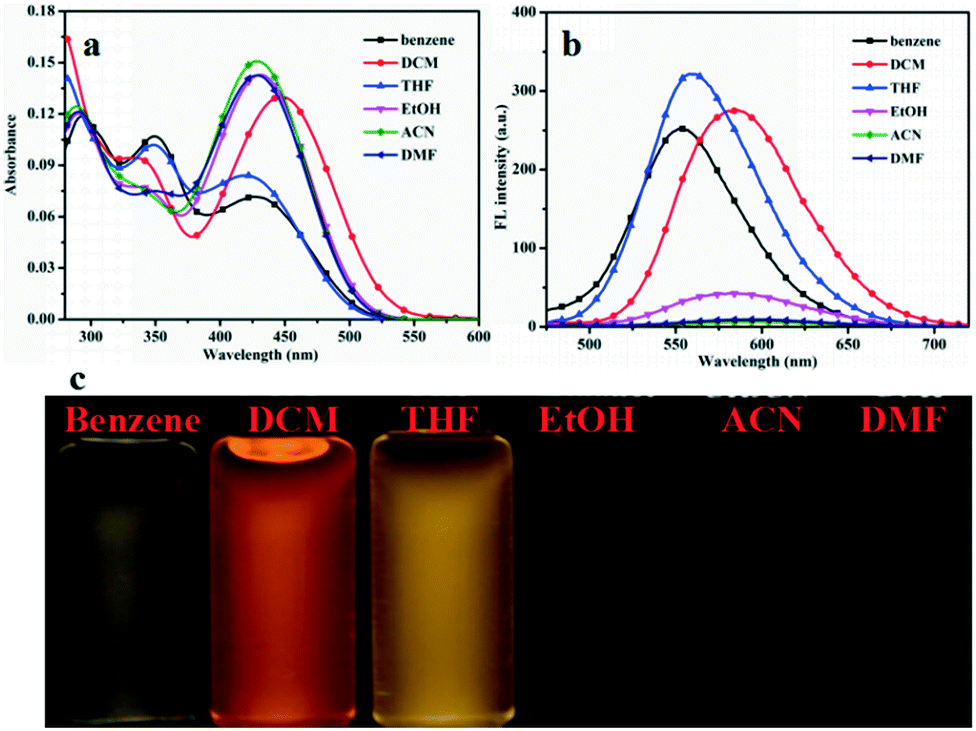 | ||
| Fig. 1 (a) The UV-vis is spectra; (b) fluorescence spectra of G1 in different solvents and (c) photographs of compound G1 dispersed in different solvents. | ||
 | ||
| Fig. 2 Lippert-Mataga diagram of compounds G1, G2 and G3. | ||
Like other common ICT molecules, G1, G2 and G3 exhibited significant polarity dependence. The fluorescence bands revealed visible red-shift and fluorescence intensity of the three compounds distinctly displayed decreases with increasing solvent polarity. Hence, we further investigate the ICT process by Stokes' shift analysis. The Lippert-Mataga47–49 equation was used to understand the influence of solvent effect for fluorescence emission.
| Δv = vabs − Vem = (2/cha3)Δƒ (μe − μg)2 + constΔ |
In the above formula, Δν is the Stokes' shift value, and νabs and νem (cm−1) are the maximum absorption and maximum emission of the molecules, respectively. h stands for Planck constant, c is the velocity of light, μe is the dipole moment of the excited state, μg is the dipole moment of the ground state, and a is the molecular cavity constant. Δƒ is the orientation polarizability of different solvent, ε is the dielectric constant of the solvent, and n is the refractive index of the solvent. As shown in Table S3 and S4,†G1 and G2 have larger Stokes' shifts than G3 because G1 and G2 have large non-radiative energy losses, and thus the fluorescence efficiencies of G1 and G2 in solution are weaker than that of G3. As depicted in Fig. 2, the values of Stokes' shift of G1 and G3 increased with the increase in solvent polarity. Although the Stokes' shift of G2 also has a gradual increasing trend, it is not as significant as those for G1 and G3. Linearity of these plots for the three fluorophores provides evidence of the Stokes' shift dependence on the solvent nature.
3.2. Selectivity study of compounds based fluorescent probes for PA detection
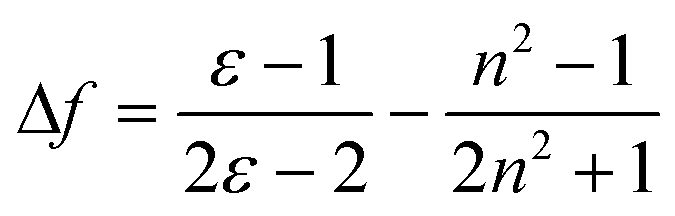
Because compounds G1, G2 and G3 bear electron-rich amino groups, they could interact with electron-deficient nitroaromatic compounds. Common nitroaromatic compounds including 2,4,6-trinitrophenol (PA), 2,4,6-trinitrotoluene (TNT), 1,3,5-trinitrobenzene (TNB), 2,4-dinitrotoluene (DNT), 2,4-dinitrophenol (DNP), 1,3-dinitrobenzene (DNB), 2,3,4,5-tetrachloronitrobenzene (TCLNB), nitrotoluene (NT), p-nitrophenol (p-NP) and nitrobenzene (NB) were tested. 2.0 × 10⁻⁵ M G1 and G2 solutions in methanol and water (v/v = 9/1) were used as compounds G1 and G2 have the strongest fluorescence emissions in this system. In the presence of 100 ppm of analytes, it was clearly observed that the positive interactions of G1 and G2 with PA led to significant quenching efficiencies compared with other analytes (Fig. 3). Also, a new absorption peak was generated at 350 nm, along with a shoulder peak at 410 nm (Fig. S3a, S4a and S6a†). The experimental results exhibited that PA initially revealed very distinct quenching efficiency in the systems, while other nitroaromatics showed little effect on emission quenching, which suggests the selective sensing behaviors of G1 and G2 towards PA. Meanwhile, it is worth noting that further additions of 100 ppm PA into other nitroaromatic systems lead to remarkable quenching efficiency of fluorescence intensity (Fig. 3b), indicating that other compounds have little effect on the detection of PA by G1 and G2. According to the above results, G1 and G2 are excellent chemosensors for PA detection in monomeric states. However, the fluorescence of G3 did not change significantly after adding 300 ppm PA. It may be because the coumarin group decorated G3 imparts a rigid planar structure, which results in negligible interaction between G3 and PA. Therefore, G3 is not an ideal choice for PA detection. In contrast, G1 and G2 could be applied as chemosensors for PA detection.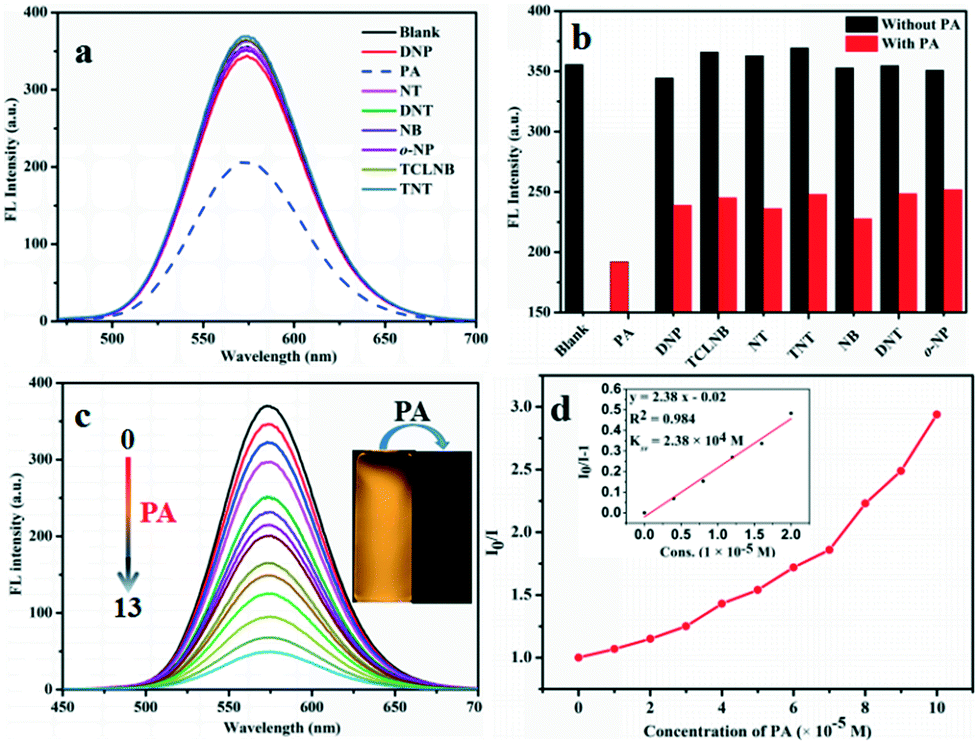 | ||
Fig. 3 (a) FL spectra obtained for different analytes (100 ppm); (b) quenching percentages of compound G1 (10 mM) with different analytes (200 ppm) in CH3OH/water (v/v = 90![[thin space (1/6-em)]](https://www.rsc.org/images/entities/char_2009.gif) :10) mixtures before (black) and after (red) the addition of 100 ppm PA; (c) FL spectra of G1 in CH3OH/water (v/v = 90:10) containing different amounts of PA; (d) corresponding Stern–Volmer plot for PA detection. Inset: Stern–Volmer plot obtained at a lower concentration of PA. :10) mixtures before (black) and after (red) the addition of 100 ppm PA; (c) FL spectra of G1 in CH3OH/water (v/v = 90:10) containing different amounts of PA; (d) corresponding Stern–Volmer plot for PA detection. Inset: Stern–Volmer plot obtained at a lower concentration of PA. | ||
3.3. PA detection
Based on predominant selectivity of G1 and G2 for PA detection, we applied them for detecting PA and investigated the interaction of G1 and G2 with PA. UV-vis absorption peaks of compounds G1 and G2 were present at approximately 430 nm, while a new peak appears at 350 nm accompanied with gradual increase in absorption intensity with the addition of PA, which could be classified as the characteristic peak of PA (Fig. S3b, S4b and S5b†). Fig. 3c and S5c† show the plot of FL intensity of compounds G1 and G2 at 580 and 593 nm, respectively, versus different PA concentrations. When PA was added to the solution, FL intensity gradually decreased and the fluorescence quenching efficiency were as high as 86% and 87%, respectively. In order to evaluate the quenching efficiency of G1 and G2 in response to the PA in solution, an important equation was necessary to evaluate the quenching efficiency. The quenching process of compounds G1 and G2 with PA can be investigated by the Stern–Volmer eqn:50| I0/I = KSV[A] + 1 |
Furthermore, for the purpose of estimating the sensitivity of G1 and G2 towards PA, the limit of detection (LOD) was estimated as a necessary tool54,55 using:
| LOD = 3 σ/K |
The excellent selective and sensitive fluorescence ‘turn off’ experiments promote us to further explore the interference of other metal ions in PA detection due to the existence of such ions in real samples (Fig. 4). The presence of metal ions revealed no significant influence on the present system suggesting the possibility of their application in analysis of real samples including metal ionic environments.
 | ||
| Fig. 4 Histograms of the fluorescence intensity of G1 (20 ppm) (a) and G2 (20 ppm) + metal ions (200 ppm) (b) in aqueous media, respectively. (Black bars represent metal ion solutions without PA and red bars represent metal ion solution with PA (100 ppm)). | ||
3.4. Sensing mechanism study
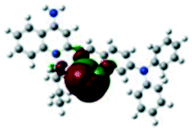
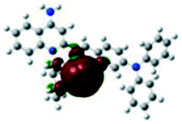
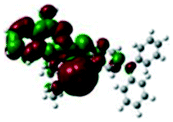
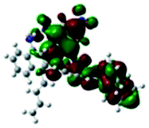
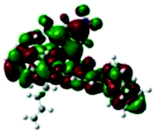
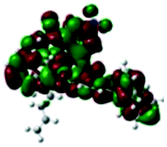
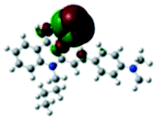
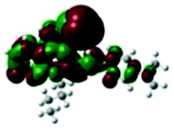
For the purpose of understanding the interactions between G1 and G2 with PA in DMSO-d6 solution, 1H NMR titration experiments were executed with incremental addition of PA (Fig. S8†). Density functional theory (DFT) calculations were performed using Gaussian 09 program. The electron density of HOMO is primarily distributed at Br− ions for G1 and G2. The electron density of LUMO is mainly located on the quinoline rings, indicating that the molecules have significant ICT effect. Meanwhile, we investigated the possibility of ICT without the presence of Br− ion as counter anion. Without Br− ion as counter anion, the results of DFT exhibited no significant ICT process (Fig. S9†). Also, the absorption spectrum of PA has no overlap with the fluorescence spectra of G1 and G2, and thus the participation of resonance energy transfer (RET) in the quenching process is excluded (Fig. S10†). After the addition of 3 and 5 equivalents of PA to a solution of G1, no substantial changes in the chemical shifts were observed for the individual signals of G1. Based on DFT calculation (Table 1), when excited G1 was exposed to PA, the excited electron was transferred from the LUMO of fluorophores to that of the electron-deficient PA. This electron density distribution blocked the intramolecular charge transfer (ICT) process, resulting in fluorescence quenching. For G2, the chemical shifts distinctly changed, possibly due to the transformation of electron density and the shift of protons. The dimethylamine phenyl group of G2 is a reasonable site for special bonded interaction with PA. The LUMO energy level of PA is between the LUMO energy level and the HOMO energy level of G2, indicating that the fluorescence quenching of G2 with increasing concentration of PA may be because of photo-induced electron transfer (PET) process (Table S5†).56–58 This electron density distribution blocked the intramolecular charge transfer (ICT) process, and the main driving force was attributed to the photo-induced electron transfer (PET) process, resulting in fluorescence quenching.| HOMO−1 | HOMO | LUMO | LUMO+1 | |
|---|---|---|---|---|
| G1 |
 −4.61 eV −4.61 eV |
 −4.43 eV −4.43 eV |
 −2.06 eV −2.06 eV |
 −1.19 eV −1.19 eV |
| G1 + PA |
 −5.53 eV −5.53 eV |
 −5.26 eV −5.26 eV |
 −2.39 eV −2.39 eV |
 −2.04 eV −2.04 eV |
| G2 |
 −5.09 eV −5.09 eV |
 −4.76 eV −4.76 eV |
 −1.15 eV −1.15 eV |
 −0.29 eV −0.29 eV |
| G2 + PA |
 −5.09 eV −5.09 eV |
 −4.91 eV −4.91 eV |
 −2.86 eV −2.86 eV |
 −1.76 eV −1.76 eV |
Nowadays, taking practical applications into consideration, G1 and G2 were further applied for the visual detection of PA due to their superior sensitivity and high selectivity. We prepared test strip filters by placing Whatman paper into CH2Cl2 (DCM) solutions of G1 and G2, then, drying under vacuum. As shown in Fig. S11,† the test strip revealed strong orange and red fluorescence emission. Interestingly, with the decreasing concentration of PA, there were significant decreases in quenching degree. These results suggested that G1 and G2 were used as effective fluorescence probes for detecting PA.
Caution! PA and other nitroaromatics are dangerous. They should be used carefully owing to their highly explosive nature. They should be used only in small quantities.
3.5. Response to acid vapor
In solid state, the absolute quantum yield (ΦF) of compounds G1, G2 and G3 were measured as 45%, 52% and 24%, respectively, showing superior emission behavior. Furthermore, based on the excellent emission behavior of G1–G3, we studied their gaseous acid/base switching. Quartz plate films were easily prepared by DCM evaporation to investigate the effect of acid vapour. As shown in Fig. S12,† the prepared samples of G1, G2 and G3 emitted strong orange, red and red light, respectively, under a 365 nm UV lamp. Notably, after exposure to trifluoroacetic acid (TFA) vapour, the fluorescence emission of G1 changed from orange to red. Meanwhile, the emissive nature of G2 and G3 samples was completely quenched without any appreciable shift in the wavelengths. Such behavior could account for the formation of protonation effect. Then, it conveniently shifts back to the original fluorescence emission in the presence of triethylamine (TEA), which confirms that the change in fluorescence was based on acid–base switching in the solid-state. The measured FL spectra are presented in Fig. 5 and S13;† these experiments were performed to confirm the reversible transformation by protonation and deprotonation with multiple cycles. From the results we have obtained, one can conclude that G1, G2 and G3 have the potential to be developed into solid fluorescent conversion materials for practical applications.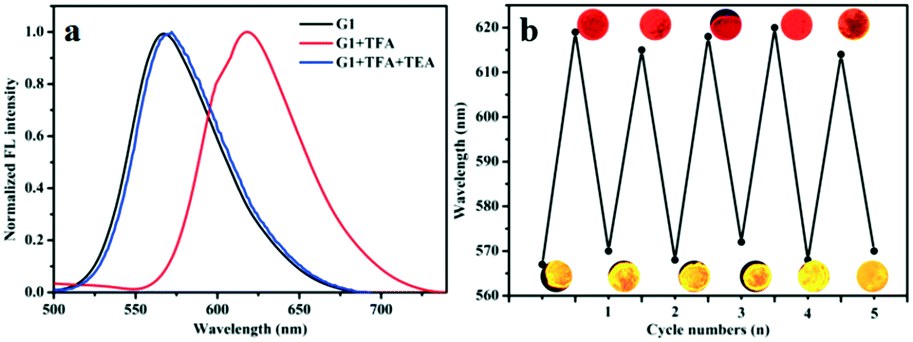 | ||
| Fig. 5 (a) The fluorescence spectra of G1 exposure to TFA and TEA vapors; (b) the maximum emissive wavelength of G1 during repeated exposure with TFA and TEA vapors. | ||
3.6. The photophysical properties of anion regulation
To further investigate the effect of counter ion, G2 is chosen as the parent compound due to its excellent red-emitting efficiency to synthesize a series of target compounds by employing different anions — to attain more eminent solid fluorescent emission materials and to adjust its photophysical properties. Six compounds were synthesized according to the literature.59 These were characterized by FT-IR, and their infrared contrast was charted in Fig. S14.† Note that FT-IR showed that compounds G2c, G2d, G2e, and G2f have very distinct SCN-infrared peaks. Evidently, it can be observed that the SCN-peak position of G2f moves toward higher wavenumber, which may be because the ionic radius of Hg(II) is highly polarized.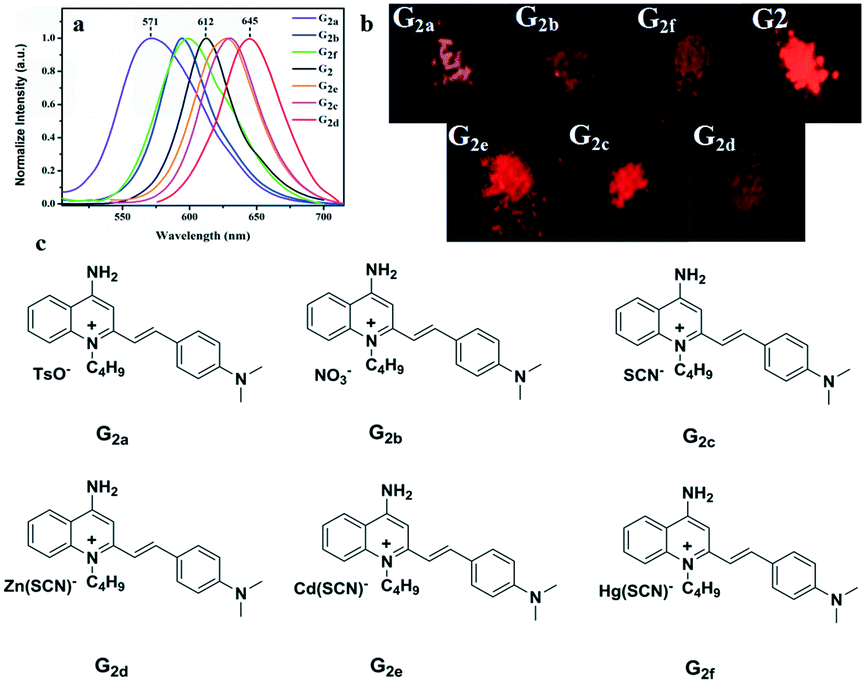 | ||
| Fig. 6 (a) Fluorescence spectra of solid powders of G2 and G2a–G2f; (b) the fluorescence of solid powders under a 365 nm UV lamp; (c) a series of compounds G2a–G2f with different anions. | ||
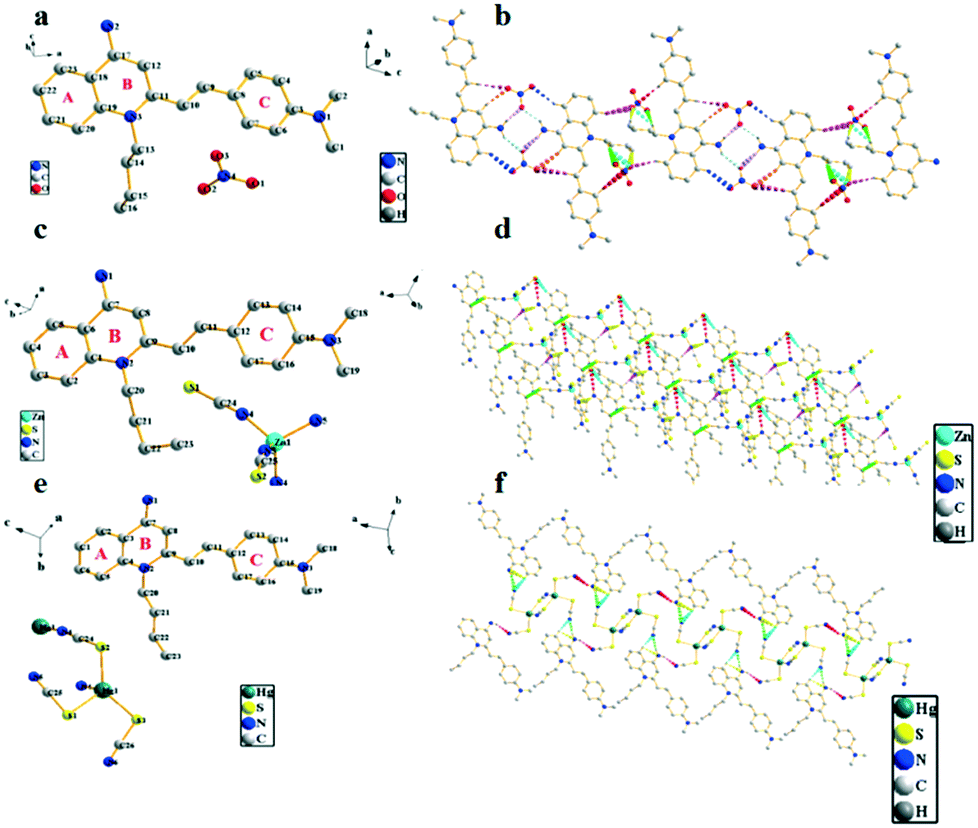 | ||
| Fig. 7 (a, c and e) Crystal structures of compounds G2b, G2d and G2f; (b, d and f) 1-D packing diagrams of G2b, G2d and G2f. | ||
Crystal structure patterns of compounds G2b, G2d, G2f (Fig. 7b, d and f, respectively) revealed a planar stacking arrangement because of the dihedral angles of the benzene ring (A) and the pyridine ring (B) of quinoline moiety, which are 2.81°, 2.13° and 1.95°, respectively. The difference between the three are small enough to be negligible. The three molecules adopt a similar stacking mode of J-type aggregation along the a, c and b axes. Careful investigation of the data found that there is no apparent π–π stacking. The ligand cations of G2b are arranged in parallel with each other by head–head interlaces. For ligand of G2d, the cations are arranged parallely by head-tails to each other. The cation head–head interdigitation of the ligand of G2f is parallel to each other. In the entire molecular structure, the dihedral angles between the phenylamine ring (C) and the pyridine ring (B) of G2b and G2f are 16.52° and 15.34°, respectively. The dihedral angles of the phenylamine ring (C) and the benzene ring (A) of G2b and G2f are 14.13° and 15.11°, respectively. Meanwhile, the dihedral angles of G2d are significantly larger than those of compounds G2b and G2f. For G2d, the dihedral angle between the phenylamine ring (C) and pyridine ring (B) is 20.74°, and the dihedral angle between phenylamine (C) and benzene rings (A) is 20.40°, which can be ascribed to the existence of relatively weak intramolecular hydrogen bonds. The crystal packing is stabilized by intermolecular hydrogen bond interactions and C–H⋯π interactions between neighboring molecules; the two cations and the two anions are connected to each other by a plurality of hydrogen bonds to form a molecular plane. On the basis of these results, we concluded that the introduction of zinc thiocyanate anion plays an important role in distorting the molecular structure. Hence, the different stacking arrangements led to comparatively different molecular aggregation states and different fluorescence emissions. Meanwhile, as summarized in Table S8,† it showed that all C–C and C![[double bond, length as m-dash]](https://www.rsc.org/images/entities/char_e001.gif) C bond lengths are between the normal C–C bond (1.53 Å) and CC bond (1.32 Å), which meant that the whole molecule has a typical π-electron delocalization system. This is an important prerequisite for the molecules to have strong nonlinear optical effects. For G2b, G2d and G2f, the intermolecular distances are 3.65 Å, 7.19 Å and 6.17 Å, respectively (Fig. S15†). The different anions resulted in extreme discrepancies in molecular arrangements, and the large steric hindrances of zinc thiocyanate anion and mercury thiocyanate anion increased the intermolecular distances. These results indicated that the anions have a substantial effect on the molecular conformation, intermolecular interactions, and packing modes. A key point of present research is that an anion exchange can be used to understand the relationship between structure and optical property at a molecular level.
C bond lengths are between the normal C–C bond (1.53 Å) and CC bond (1.32 Å), which meant that the whole molecule has a typical π-electron delocalization system. This is an important prerequisite for the molecules to have strong nonlinear optical effects. For G2b, G2d and G2f, the intermolecular distances are 3.65 Å, 7.19 Å and 6.17 Å, respectively (Fig. S15†). The different anions resulted in extreme discrepancies in molecular arrangements, and the large steric hindrances of zinc thiocyanate anion and mercury thiocyanate anion increased the intermolecular distances. These results indicated that the anions have a substantial effect on the molecular conformation, intermolecular interactions, and packing modes. A key point of present research is that an anion exchange can be used to understand the relationship between structure and optical property at a molecular level.
4. Conclusions
In summary, three group substituted (G1, G2 and G3) quinoline derivatives were synthesized that exhibited significant solvatochromic effect. Their ICT behaviors are proven through DFT analysis on molecular orbitals. Among them, G1 and G2 revealed strong binding strength with PA, directly associated with highly sensitive and excellent selective nature of the two probes toward PA detection. The fluorescence quenching after PA addition is mainly ascribed to the obstruction in its ICT process. The three compounds displayed good acid–base switching due to their protonation and deprotonation. The introduction of different anions provided a method to obtain different solid-state fluorescence. The key to forming different molecular packing arrangements to affect steric hindrance of anions and their interactions with cations is the introduction of distinct anions. This anion-controlled approach opens new avenues for the design of highly emissive functional materials.Conflicts of interest
There are not any conflict to declare.Acknowledgements
This study was supported by the National Natural Science Foundation of China (51432001, 51673001) and the Educational Commission of Anhui Province of China (KJ2014ZD02).References
- S. Shanmugaraju and P. S. Mukherjee, Chem. Commun., 2015, 51, 16014 RSC.
- Z. H. Fu, Y. W. Wang and Y. Peng, Chem. Commun., 2017, 53, 10524 RSC.
- P. Y. Li, Z. Qu, X. Chen, X. K. Huo, X. H. Zheng, D. Z. Wang, W. P. Yang, L. B. Ji, P. Liu and X. J. Xu, J. Mater. Chem. C, 2017, 5, 6216 RSC.
- T. S. Wang, N. Zhang, R. K. Bai and Y. Y. Bao, J. Mater. Chem. C, 2018, 6, 266 CAS.
- W. L. Che, G. F. Li, X. M. Liu, K. Z. Shao, D. X. Zhu, Z. M. Su and M. R. Bryce, complexes, Chem. Commun., 2018, 1730 RSC.
- Z. S. Liu, F. Y. Cao, T. J. Tsuboi, Y. Yue, C. Deng, X. F. Ni, W. L. Sun and Q. S. Zhang, J. Mater. Chem. C, 2018, 6, 7728 RSC.
- W. X. Song, Y. Chen, Q. H. Xu, H. C. Mu, J. J. Cao, J. H. Huang and J. H. Su, ACS Appl. Mater. Interfaces, 2018, 10, 24689 CrossRef CAS.
- D. R. Vinayakumara, H. Ulla, S. Kumar, A. Pandith, M. N. Satyanarayan, D. S. Shankar Rao, S. K. Prasad and A. V. Adhikari, J. Mater. Chem. C, 2018, 6, 7385 RSC.
- H. Fukagawa, T. Sasaki, T. Tsuzuki, Y. Nakajima, T. Takei, G. Motomura, M. Hasegawa, K. Morii and T. Shimizu, Adv. Mater., 2018, 30, 1706768 CrossRef.
- J. Sobus, F. Bencheikh, M. Mamada, R. Wawrzinek, J. C. Ribierre, C. Adachi, S. C. Lo and E. B. Namdas, Adv. Funct. Mater., 2018, 28, 1800340 CrossRef.
- P. Galer, R. C. Korosec, M. Vidmar and B. Sket, J. Am. Chem. Soc., 2014, 136, 7383 CrossRef CAS.
- Z. Y. Ma, Z. J. Wang, X. Meng, Z. M. Ma, Z. J. Xu, Y. G. Ma and X. R. Jia, Angew. Chem., Int. Ed., 2016, 55, 519 CrossRef CAS.
- L. Wilbraham, M. Louis, D. Alberga, A. Brosseau, R. Guillot, F. Ito, F. Labat, R. Métivier, C. Allain and I. Ciofini, Adv. Mater., 2018, 30, 1800817 CrossRef.
- X. Su, Y. L. Ji, W. T. Pan, S. Q. Chen, Y. M. Zhang, T. T. Lin, L. L. Liu, M. J. Li, Y. F. Liu and S. X. A. Zhang, J. Mater. Chem. C, 2018, 6, 6940 RSC.
- J. H. Chen, D. Y. Li, W. J. Chi, G. T. Liu, S. H. Liu, X. G. Liu, C. Zhang and J. Yin, Chem. – Eur. J., 2018, 24, 3671 CrossRef CAS PubMed.
- F. Bu, R. H. Duan, Y. J. Xie, Y. P. Yi, Q. Peng, R. R. Hu, A. J. Qin, Z. J. Zhao and B. Z. Tang, Angew. Chem., Int. Ed., 2015, 54, 14492 CrossRef CAS PubMed.
- H. G. Lu, Y. D. Zheng, X. W. Zhao, L. J. Wang, S. Q. Ma, X. Q. Han, B. Xu, W. J. Tian and H. Gao, Angew. Chem., Int. Ed., 2016, 55, 155 CrossRef CAS.
- C. Pan, K. Sugiyasu, Y. Wakayama, A. Sato and M. Takeuchi, Angew. Chem., Int. Ed., 2013, 52, 10775 CrossRef CAS.
- X. Y. Tang, Q. Bai, Q. M. Peng, Y. Gao, J. Y. Li, Y. L. Liu, L. Yao, P. Lu, B. Yang and Y. G. Ma, Chem. Mater., 2015, 27, 7050 CrossRef CAS.
- Q. M. Liu, Q. Xia, S. Wang, B. S. Li and B. Z. Tang, J. Mater. Chem. C, 2018, 6, 4807 RSC.
- S. Kula, A. Szlapa-Kula, S. Kotowicz, M. Filapek, K. Bujak, M. Siwy, H. Janeczek, S. Maćkowski and E. S. Balcerzak, Dyes Pigm., 2018, 159, 646 CrossRef CAS.
- I. Malina, V. Kampars and S. Belyakov, Dyes Pigm., 2018, 159, 655 CrossRef CAS.
- G. Albrecht, J. M. Herr, M. Steinbach, H. Yanagi, R. Gottlich and D. Schlettwein, Dyes Pigm., 2018, 156, 334 CrossRef.
- Q. Y. Li, Z. Ma, W. Q. Zhang, J. L. Xu, W. Wei, H. Lu, X. S. Zhao and X. J. Wang, Chem. Commun., 2016, 52, 11284 RSC.
- D. Haldar, D. Dinda and S. K. Saha, J. Mater. Chem. C, 2016, 4, 6321 RSC.
- X. C. Sun, J. K. He, Y. T. Meng, L. C. Zhang, S. C. Zhang, X. Y. Ma, S. Dey, J. Zhao and Y. Lei, J. Mater. Chem. A, 2016, 4, 4161 RSC.
- M. W. Zhu, S. Q. Xu, X. Z. Wang, Y. Q. Chen, L. Y. Dai and X. Zhao, Chem. Commun., 2018, 54, 2308 RSC.
- X. C. Sun, Y. Wang and Y. Lei, Chem. Soc. Rev., 2015, 44, 8019 RSC.
- K. Li, R. H. Yu, C. M. Shi, F. R. Tao, T. D. Li and Y. Z. Cui, Sens. Actuators, B, 2018, 262, 637 CrossRef CAS.
- D. Peng, L. Zhang, F. F. Li, W. R. Cui, R. P. Liang and J. D. Qiu, ACS Appl. Mater. Interfaces, 2018, 10, 7315 CrossRef CAS PubMed.
- B. Ju, Y. Wang, Y. M. Zhang, T. Zhang, Z. H. Liu, M. J. Li and S. X. A. Zhang, ACS Appl. Mater. Interfaces, 2018, 10, 13040 CrossRef CAS.
- L. Y. Wang, M. M. Cui, H. Tang and D. R. Cao, Dyes Pigm., 2018, 155, 107 CrossRef CAS.
- K. Bauri, B. Saha, J. r. Mahanti and P. De, Polym. Chem., 2017, 8, 7180 RSC.
- S. Babaee and B. Micellar, Anal. Chim. Acta, 2010, 662, 9 CrossRef CAS PubMed.
- G. He, H. Peng, T. Liu, M. Yang, Y. Zhang and Y. Fang, J. Mater. Chem., 2009, 19, 7347 RSC.
- A. Rose, Z. Zhu, C. Madigan, T. Swager and V. Bulovic, Nature, 2005, 434, 876–879 CrossRef CAS PubMed.
- B. L. Wang, Y. Mu, C. H. Zhang and J. Y. Li, Sens. Actuators, B, 2017, 253, 911 CrossRef CAS.
- Z. Y. Yang, W. Qin, J. W. Y. Lam, S. J. Chen, H. H. Y. Sung, I. D. Williams and B. Z. Tang, Chem. Sci., 2013, 4, 3725 RSC.
- Z. S. Li, L. J. Li, T. T. Sun, L. M. Liu and Z. G. Xie, Dyes Pigm., 2016, 128, 165 CrossRef CAS.
- W. J. Zhang, L. Fan, Z. B. Li, T. Ou, H. J. Zhai, J. Yang, C. Dong and S. M. Shaung, Sens. Actuators, B, 2016, 233, 566 CrossRef CAS.
- A. J. Boydston, P. D. Vu, O. L. Dykhno, V. Chang, A. R. Wyatt, II, A. S. Stockett, E. T. Ritschdorff, J. B. Shear and C. W. Bielawski, J. Am. Chem. Soc., 2008, 130, 3143 CrossRef CAS.
- W. A. Donald, R. D. Leib, M. Demireva and E. R. Williams, J. Am. Chem. Soc., 2011, 133, 18940 CrossRef CAS PubMed.
- M. Dong, A. Babalhavaeji, M. J. Hansen, L. Kálmán and G. A. Woolley, Chem. Commun., 2015, 51, 12981 RSC.
- Y. J. Huang, Y. B. Jiang, S. D. Bull, J. S. Fossey and T. D. James, Chem. Commun., 2010, 46, 8180 RSC.
- H. Sun, X. X. Tang, B. X. Miao, Y. Yang and Z. H. Ni, Sens. Actuators, B, 2018, 267, 448 CrossRef CAS.
- T. E. A. Frizon, R. C. Duarte, J. L. Westrup, J. M. Perez, G. Menosso, L. G. T. A. Duarte, J. C. Germino, M. M. Faleiros, T. D. Z. Atvars, E. Zapp, F. S. Rodembusch and A. G. Dal-Bó, Dyes Pigm., 2018, 157, 218 CrossRef CAS.
- T. T. Zhang, Y. J. Li, J. Y. Yan, Y. Liang, B. B. Xu, K. B. Zheng and N. N. Zhang, Tetrahedron, 2018, 74, 2807 CrossRef CAS.
- A. Gopinath, K. Ramamurthy, M. Subaraja, C. Selvaraju and A. S. Nasar, New J. Chem., 2018, 42, 10243 RSC.
- Y. H. Ma, L. Zhao, Y. Li, J. Y. Liu, Y. Q. Yang and T. S. Chu, Tetrahedron, 2018, 74, 2684 CrossRef CAS.
- S. Shanmugaraju, C. Dabadie, K. Byrne, A. J. Savyasachi, D. Umadevi, W. Schmitt, J. A. Kitchen and T. Gunnlaugasson, Chem. Sci., 2017, 8, 1535 RSC.
- H. P. Martinez, C. D. Grant, J. G. Reynolds and W. C. Trogler, J. Mater. Chem., 2012, 22, 2908 RSC.
- W. F. Shu, C. W. Guan, W. H. Guo, C. Y. Wang and Y. J. Shen, J. Mater. Chem., 2012, 22, 3075 RSC.
- B. W. Xu, X. F. Wu, H. B. Li, H. Tong and L. X. Wang, Macromolecules, 2011, 44, 5089 CrossRef CAS.
- J. Schoo, D. S. Lakshmi, E. Suresh and P. S. Subremanian, Sens. Actuators, B, 2017, 250, 215 CrossRef.
- M. Ahmed, S. Hameed, A. Ihsan and M. M. Naseer, Sens. Actuators, B, 2017, 248, 57 CrossRef CAS.
- P. Y. Gu, C. Y. Wang, L. N. Nie, G. K. Long and Q. C. Zhang, RSC Adv., 2016, 6, 37929 RSC.
- D. Wu, A. C. Sedgwick, T. Gunnlaugsson, E. U. Akkaya, J. Y. Yoon and T. D. James, Chem. Soc. Rev., 2017, 46, 7105 RSC.
- H. W. Ma, F. Li, L. Yao, Y. T. Feng, Z. X. Zhang and M. Zhang, Sens. Actuators, B, 2018, 259, 380 CrossRef CAS.
- F. Y. Hao, X. J. Zhang, Y. P. Tian, H. P. Zhou, L. Li, J. Y. Wu, S. Y. Zhang, J. X. Yang, B. K. Jin, X. T. Tao, G. Y. Zhou and M. H. Jiang, J. Mater. Chem., 2009, 19, 9163 RSC.
Footnote |
| † Electronic supplementary information (ESI) available: Solvatochromic effect of G2 and G3; photophysical properties data; selectivity experiments (UV-vis and FL spectra) for different derivatives; fluorescence titration experiments of G2 and G3; The Stern–Volmer plots; normalized absorption spectrum of PA and the fluorescence spectra of G1 and G2; electronic energy levels and electron cloud distribution map; 1H NMR titration spectra; application experiments; acid–base experiments; fluorescence intensity of acids/bases of G1 and G2; FT-IR spectra of G2a–G2f; emission wavelengths of G2 and G2a–G2f; single crystal data of G2b, G2d, G2f; CCDC 1001780, 1033968 and 1044898; 1H NMR, 13C NMR and ESI-MS spectra of G1, G2 and G3. For ESI and crystallographic data in CIF or other electronic format see DOI: 10.1039/c8ce01747f |
| This journal is © The Royal Society of Chemistry 2019 |