
Fine tuning of magnetization relaxation parameters of the DyO+ single ion magnet in a hydroxy/fluoro-apatite solid solution†
Pavel E.
Kazin
 *a,
Mikhail A.
Zykin
b,
Lev A.
Trusov
a,
Alexander V.
Vasiliev
a,
Irina V.
Kolesnik
a,
Walter
Schnelle
c,
Claudia
Felser
c and
Martin
Jansen
cd
*a,
Mikhail A.
Zykin
b,
Lev A.
Trusov
a,
Alexander V.
Vasiliev
a,
Irina V.
Kolesnik
a,
Walter
Schnelle
c,
Claudia
Felser
c and
Martin
Jansen
cd
aDepartment of Chemistry, Lomonosov Moscow State University, 119991 Moscow, Russia. E-mail: kazin@inorg.chem.msu.ru; Tel: +7 495 9393440
bDepartment of Materials Science, Lomonosov Moscow State University, 119991 Moscow, Russia
cMax Planck Institute for Chemical Physics of Solids, Nöthnitzer Str. 40, 01187 Dresden, Germany
dMax Planck Institute for Solid State Research, Heisenbergstrasse 1, 70569 Stuttgart, Germany
First published on 13th November 2018
Abstract
DyO+ embedded in a hydroxy/fluoro-apatite matrix reveals robust and finely tunable single-ion-magnet properties. The energy barrier for magnetization reversal grows with the increase in the fluoride and Dy content. A high Dy concentration slows down the quantum tunneling of magnetization, contrary to a commonly observed trend for its acceleration.
Introduction
Research on single molecule and single ion magnets (SMMs and SIMs, respectively) began a quarter of a century ago, as marked by the discovery of a polynuclear manganese acetate complex,1 and has developed rapidly, showing prospects for applications in molecule-scale magnetic recording, molecular electronics, spintronics, and quantum computing.2–6 The number of SIM compounds reported so far is nearly two hundred.7 In the recent past, new records have been reported for magnetic anisotropy with the energy barrier for magnetization reversal (Ueff) exceeding 1000 cm−1 and magnetization blocking temperature (Tb) reaching 60 K for Dy3+-based SIMs.8–10 The latter include rare cases of chemically and thermally stable purely inorganic extended solids as represented by Dy-doped calcium and strontium hydroxyapatites, showing a Ueff of up to 1043 cm−1.11 Dy3+ replaces Ca2+ at the Ca(2) site and forms an effective DyO+ ion with a very short Dy–O bond of 2.05 Å. In this diatomic group, Dy3+ is further weakly coordinated to six oxygen atoms of the phosphate groups, forming a distorted pentagonal bipyramid as the coordination polyhedron with the closest oxygen atom as the apex. This atom provides a strong axial crystal field, resulting in a high magnetic anisotropy of the Dy3+ ion.11,12 The ground Kramers doublet represents a practically pure MJ = ±15/2 state and the excited doublets acquire consecutively decreasing MJ values from ±13/2 to ±1/2. Ueff is determined by magnetic moment tunneling through the fourth and third exited doublets for strontium and calcium compounds, respectively.Notably, the apatite structure type allows for diverse cation and anion substitutions.13–15 This offers opportunities to smoothly vary the crystal environment of the DyO+ as well as to modify the overall chemical properties of the compound. Since the fluoride for hydroxide substitution increases the chemical stability of the apatite15 and a substantial concentration of Dy3+ can be achieved only in the calcium compound,11 in the present work, we studied the effect of both fluoride and Dy3+ concentrations on the SIM properties of DyO+ in the calcium apatite matrix.
Experimental
The samples were prepared by high temperature solid state synthesis and had the general nominal composition Ca10−xDyx(PO4)6(OH)2−x−yOxFy, where x = 0.1 and y = 1 (1), x = 0.5 and y = 1 (2), x = 0.1 and y = 1.9 (3), x = 0.5 and y = 1.5 (4). Stoichiometric quantities of commercial reagents CaCO3, SrCO3, (NH4)2HPO4, and Dy2O3 were ground and mixed in an agate mortar. All thermal treatment procedures were performed in air. The mixture was thermally treated in an electric furnace in air according to the following procedure: heating to 400 °C for 1 hour, annealing at 400 °C for 1 hour; heating to 600 °C for 1 hour, annealing at 600 °C for 1 hour; heating to 800 °C for 1 hour, annealing at 800 °C for 5 hours. The thoroughly ground product was annealed at 1150 °C for 8 h. The reground powder was pressed in pellets, and then annealed at 1300 °C for 6 h. The pellets were reground, pressed into pellets again, and annealed at 1300 °C for 12 h. The resulting pellets were reground, pressed into pellets once more, annealed at 1300 °C for 8 h, and air quenched.X-ray powder diffraction was performed using a Rigaku D/MAX 2500 diffractometer with a rotating anode (CuKα radiation) in Bragg–Brentano geometry in the 2θ range of 10–80°, with a step size of 0.02°. Using the JANA 2006 computer program,16 the crystal structure of all the samples was refined, including unit cell dimensions and positional and isotropic atomic displacement parameters of all atoms except hydrogen (Fig. S1–S4 and Table S1–S4†). For samples with a high Dy content (2 and 4), the occupancy of Dy3+ at the Ca(2) site was refined. Since occupancies correlate with atomic displacement parameters, we performed the refinement with equal parameters for the Ca(1) and Ca(2) sites.
Magnetic properties were measured on a Quantum Design SQUID VSM in the temperature range of 1.8–300 K and magnetic field range of −30–+30 kOe. A piece of a ceramic sample (50–200 mg) was fixed with GE-varnish (<0.3 mg) on a quartz rod. DC magnetization and susceptibility were measured in dc-SQUID mode. AC susceptibility (χac) was measured under an ac field of 2.5–3 Oe in the frequency range of 1–945 Hz in the temperature range of 2–70 K. The core diamagnetism was subtracted from the calculated magnetization value using Pascal's constants. Isothermal measurements of the field dependence of magnetization were performed at 1.8 K with the field sweeping rate of 200 Oe s−1. The generalized Debye model was applied to simultaneously fit the χ′ and χ′′ components of χac(ω) (ω = 2πf) using the following equations:17
 | (1) |
 | (2) |
The relaxation time τ, the low-frequency susceptibility χ0 and the high-frequency susceptibility χs (as a contribution of fast-relaxing magnetization), their difference χSR (as a contribution of slow-relaxing magnetization), and the relaxation time distribution parameter α were estimated. All the parameters were refined simultaneously for the temperature interval of 20–50 K, for which a χ′′(ω) local maximum was well observed. Then, χSR(T) was fitted by the Curie–Weiss equation. In order to escape strong correlations, for higher temperatures, χSR was fixed to the value calculated using the Curie–Weiss parameters and α was fixed to a value estimated for lower temperatures, while all other parameters were refined.
Fourier transform infrared spectra (FT-IR) were recorded on a Perkin Elmer Spectrum One FT-IR in the range of 450–4000 cm−1 in diffuse-reflectance mode.
Microstructure observations and energy dispersive X-ray analysis (EDS) were performed using a Supra 50 VP LEO scanning electron microscope.
Results and discussion
Composition and crystal structure
X-ray powder diffraction (XRPD) analysis reveals an apatite-type phase (space group P63/m) and the presence of trace cubic Dy2O3 (Fig. S1–S4†). The parameters of the unit cell decrease both with the increase in F− for OH− and Dy3+ for Ca2+ substitutions, testifying the formation of a solid solution (Table S1†). Ceramic samples exhibit ensembles of sintered rounded grains of typically 1–5 μm in size (Fig. S5†). The content of Dy was reliably estimated by EDS in Dy-rich samples. The atomic ratio of Dy to Ca in the grains corresponds to x = 0.37(3) and 0.38(4) for 2 and 4, respectively, i.e., it is somewhat lower than the nominal ratio of x = 0.5, which we may expect taking into consideration the presence of the Dy2O3 admixture phase. Moreover, the refined occupancy of Dy3+ at the Ca(2) site corresponds to x = 0.42(2) and 0.43(2) for 2 and 4, respectively. The values overlap within a standard deviation of those obtained by EDS. This evidences that Dy substitutes Ca mostly at the Ca(2) site. In addition, the quantity of the Dy2O3 admixture estimated by the XRPD refinement corresponds to x = 0.04 and 0.03, implying that the total Dy3+ content may approach the nominal content. For samples with low Dy content, the initial structure refinements were performed for the undoped composition (x = 0). This resulted in substantially reduced atomic displacement parameters of Ca(2) in comparison with those of Ca(1), suggesting that Dy shares the Ca(2) site. In the next step, the occupancy of Dy was fixed to the nominal occupancy and refinement of the structure with Dy at the Ca(2) site resulted in lower R factors than those with Dy at the Ca(1) site. This indicates that Dy preferably enters the Ca(2) site even in the Dy-poor samples.A fragment of the crystal structure is shown in Fig. 1. Ca(2)3 triangles oriented normal to the c-axis form the walls of a trigonal channel running along the c-axis. Inside the channel, in case of a Dy-free hydroxy/fluoro-apatite, small anions, namely, OH− and F− are located. Under the conditions of preparation, we also expect a certain fraction of O22− (ref. 18 and 19) and possibly O2− (ref. 20) to be found in the channel. The heterovalent Dy3+ for Ca2+ substitution at the Ca(2) site corresponds to the charge-balance process Ca2+ + OH− → Dy3+ + O2−; thus, the presence of O2− ions is required.
 | ||
| Fig. 1 A fragment of the crystal structure of Dy-doped hydroxy/fluoro-apatite (sample 2) showing a c-directed trigonal channel formed by Ca2+ and filled randomly with small anions, OH−, F−, and O2− coupled to Dy3+. Only one adjacent phosphate group is shown for clarity. | ||
In the FT-IR spectra of all the samples, a new band arises at a wavenumber of ca. 550 cm−1, which is most pronounced in the Dy-rich samples (Fig. S6†). We attribute this band to the DyO+ stretching vibration. The band wavenumber practically coincides with that of the DyO+ band (552 cm−1) found in the Dy-doped hydroxyapatite,11 suggesting that a strong Dy–O bond persists in the fluoro/hydroxyapatite analogs.
Magnetic properties
Temperature dependence of magnetic susceptibility for all the samples, expressed as χT(T) (Fig. S7†), is very similar to that of Dy-doped hydroxyapatite.11 As expected, χT values at room temperature are nearly equal for all the samples and are slightly lower than that for a free Dy3+ ion. This confirms that the total content of Dy in each sample is close to the nominal content. On lowering the temperature, χT decreases due to depopulation of the Stark levels, and at the lowest temperatures, χT characterizes the magnetism of the ground state with MJ = ±15/2. However, the low-temperature values differ for different samples and show a general trend to be smaller in comparison with the expected χT values for Dy-doped apatite with a strong axial magnetic anisotropy11 (see Fig. S7†). This finding is connected to the presence of the Dy2O3 admixture phase that exhibits much lower χT at these conditions. The deviation from the expected χT(T) is qualitatively related to the amount of trace Dy2O3 determined by XRPD analysis. It should be mentioned that while Dy2O3 contributes to the samples' magnetization, its effect on the magnetic properties (including magnetization relaxation parameters) of the main apatite phase approaches zero as this phase occupies a very small space (a part percent) and may affect only a few atomic layers of the adjacent matrix phase, so that the fraction of the disturbed apatite phase is vanishingly small.According to the ac susceptibility measurements, all the samples show slow relaxation of magnetization under zero magnetic field at temperatures up to 70 K (Fig. S8–S11†). The parameter of the relaxation time distribution (α) is relatively large at a temperature of 20 K (∼0.3) and reduces to values in the range of 0.05–0.12 at higher temperatures. These values are quite low to clearly distinguish SIMs. The Arrhenius plots for the relaxation time τ are shown in Fig. 2. The ln![[thin space (1/6-em)]](https://www.rsc.org/images/entities/char_2009.gif) τ (1/T) curves fall close to each other and show the same trend—a slow decrease with the increase in temperature at low temperatures and faster decrease and approaching linear behavior at higher temperatures where the Orbach process dominates. The curves were fitted using eqn (3), which includes terms from the Raman and Orbach processes as the major parameters in the considered temperature interval.
τ (1/T) curves fall close to each other and show the same trend—a slow decrease with the increase in temperature at low temperatures and faster decrease and approaching linear behavior at higher temperatures where the Orbach process dominates. The curves were fitted using eqn (3), which includes terms from the Raman and Orbach processes as the major parameters in the considered temperature interval.
| τ−1 = CTn + τ0−1exp(−Ueff/kBT) | (3) |
 | ||
| Fig. 2 Arrhenius plots for the magnetization relaxation time τ (s) of the samples prepared. Symbols–experimental points, lines–fitting (for sake of clarity, only shown for 1, 3, and 4). | ||
The fitted parameters are presented in Table 1 along with the crystal cell volumes. The Ueff values are quite close to our earlier reported values for the Dy-doped calcium apatite species (up to 792 cm−1),11 demonstrating the particular robustness of this SIM. At the same time, Ueff varies with the composition of the material. The uncertainties arising due to Ueff correlation with τ0 hinder the direct comparison of Ueff. The values of τ0 scatter at around 1 × 10⁻¹² s. Assuming the same τ0 for all the samples and fixing it to this value, the fitting provides the Ueff values with much smaller error bars (see Table 1), allowing for qualitative analysis. There are two distinct tendencies. First, at constant Dy content, Ueff grows with the F content: from 1 to 3 and from 2 to 4. Second, Ueff grows with the Dy content: from 1 to 2 at constant F− content and from 3 to 4 even at decreasing F− content. Both types of substitution lead to contraction of the unit cell, and Ueff monotonously grows with the decrease in unit cell volume.
| Sample | 1 | 2 | 3 | 4 |
|---|---|---|---|---|
| x | 0.1 | 0.5 | 0.1 | 0.5 |
| y | 1 | 1 | 1.9 | 1.5 |
| C × 104 (s−1 K−n) | 0.39 ± 0.16 | 1.2 ± 0.3 | 0.53 ± 0.16 | 1.0 ± 0.2 |
| n | 4.51 ± 0.12 | 4.25 ± 0.08 | 4.40 ± 0.09 | 4.27 ± 0.06 |
| U eff (cm−1) | 766 ± 32 | 788 ± 37 | 794 ± 35 | 815 ± 33 |
| τ 0 × 1012 (s) | 0.9 ± 0.6 | 1.3 ± 1.0 | 1.0 ± 0.8 | 0.9 ± 0.6 |
| U eff at τ0 = 10−12 s (cm−1) | 761 ± 2 | 800 ± 2 | 796 ± 2 | 808 ± 2 |
| V (Å3) | 525.42(2) | 524.00(2) | 524.26(2) | 523.92(2) |
One of the possible reasons for these correlations might be the following. Shrinking of the crystal lattice will lead to a decrease in the interatomic distances, including that in the DyO+ ion. This provides a stronger axial crystal field at Dy3+ and thus elevated energy separations between the ground and excited doublets within the ground term 6H15/2. Unfortunately, XRPD does not allow for precisely determining the Dy–O interatomic distance, particularly due to disorder in the position of the intra-channel oxygen atoms.11 The wavenumber of the DyO+ stretching vibration observed in the FT-IR spectra is the same for all the samples. This implies that the expected variation in the DyO+ bond strength is too small to be probed in this manner. However, the spectra differ in intensity of the stretching vibration of OH (see Fig. S6†). An undisturbed OH− vibration (as in pure hydroxyapatite21) is observed at 3571 ± 1 cm−1. Its intensity decreases in the sample in the sequence 1, 3, 2, 4, i.e., with the increase in Ueff. A vibrational peak of OH− hydrogen-bonded to F− (commonly observed in hydroxy/fluoro-apatite22) appears at 3539 ± 1 cm−1 and has higher oscillator strength. Its intensity is lower for 2 and 4 than for 1 and 3. Therefore, some effect of the OH− ions on DyO+ might be another possible reason for the variation of Ueff with doping. The respective O–O separation allows for the formation of a hydrogen bond between OH− and DyO+ (see Fig. 1). Such an interaction would weaken the DyO+ bond and hence the axial crystal field strength at Dy3+, leading to a decrease in Ueff. Fluoride replacing the hydroxide groups will reduce the number of hydrogen bonds formed, which would make the average Ueff value increase. Replacement of Ca2+ by Dy3+ is coupled with substitution of OH− by O2−, which similarly lowers the probability of hydrogen bonding. Till now, we could not discriminate the respective contribution of the two factors of influence, namely, the unit cell contraction and the hydrogen bonding. Nevertheless, the obtained data clearly demonstrate that with a slight change in the crystal environment of DyO+, it is possible to directionally regulate its magnetic anisotropy and corresponding energy barrier for magnetization reversal.
At low temperatures, relaxation becomes very slow and at a temperature of 1.8 K, all the samples exhibit a hysteresis loop in isothermal magnetization M(H) (Fig. 3a). The difference ΔM between the decreasing Mdown and increasing Mup branches of magnetization at a certain magnetic field reflects the relaxation time: the larger the ΔM the higher the τ. ΔM is relatively low under a zero field due to the quantum tunneling of magnetization (QTM) between nearly degenerate energy levels. As expected, at first, ΔM increases with the increase in magnetic field, which splits the levels to remove the degeneracy, and then decreases as the direct process of spin-phonon relaxation becomes pronounced.23 The somewhat narrow hysteresis for 1 may be related to the higher admixture of Dy2O3, the magnetization of which is reversible.11
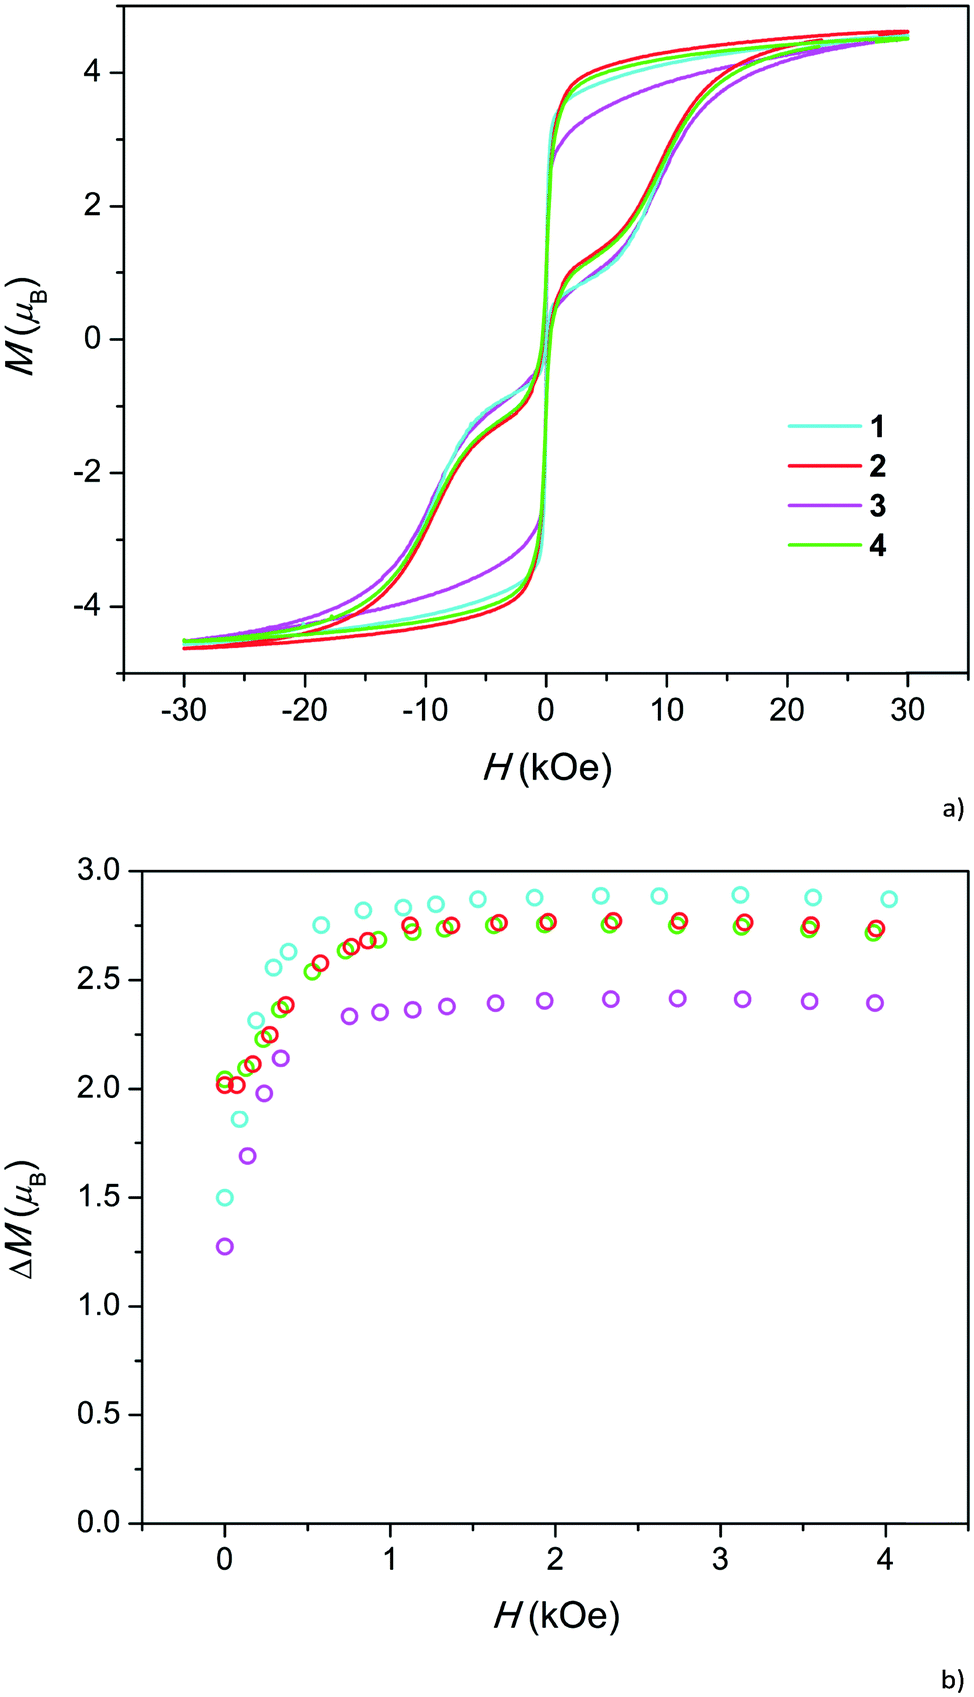 | ||
| Fig. 3 Magnetization at T = 1.8 K. a). Magnetization curves at a field sweeping rate of 200 Oe s−1. Coercive fields are of 134, 283, 126, and 326 Oe for 1, 2, 3, and 4 respectively. b). Low field dependence of ΔM = Mdown − Mup, the color designation of the samples is the same as in a). | ||
While the overall hysteresis loops look similar for all the samples, the behavior under low fields differs substantially (Fig. 3b). Samples with high Dy content exhibit more than a two-fold higher coercive field and 30–40% larger ΔM in a zero field than samples with a low Dy content. However, in intermediate fields, ΔM is comparable for all the samples. Hence, a high Dy concentration suppresses QTM. Absence of such a difference between 2 and 4 as well as between 1 and 3 implies that the fluoride for hydroxide replacement does not appreciably affect the ΔM(H) dependencies and QTM.
In order to verify this unusual trend, we checked our previous data on Dy-doped calcium hydroxyapatites (Fig. S12†). Indeed, ΔM under zero field increased with the change in the Dy content x from 0.5 to 1.0. Direct quantitative comparison with the current samples is not possible because the samples were measured at different field sweep rates. We may take relative values r1 = ΔM(H = 0)/ΔM(H = 2 kOe) and calculate their ratio r2 for pairs of samples with higher and lower Dy content. For the pairs 2–1 and 4–3, we obtain equal r2 values of 1.40, and for the pair of hydroxyapatites, we obtained an r2 value of 1.38. Therefore, the trend distinctly persists in the whole x range of 0.1–1.0.
As a rule, an increase in the paramagnetic ion concentration in the compound accelerates QTM, which is commonly related to the enhanced inter-ion interactions of the dipole–dipole or exchange types, causing tunnel splitting of the ground state Kramers doublet.23 The apatite samples under discussion behave in the opposite manner. Recent studies on single-chains of SIMs in a crystal lattice show that the parameters of Dy- and Tb-based SIMs may be substantially modified due to inter-ion interactions.24–26 In particular, dipolar interactions can significantly slow down the relaxation process under a zero field, as reported for a structurally ordered one-dimensional array of magnetically correlated Tb3+ ions.24 Such QTM suppression is explained in the following way. The probability of QTM for a pair of ferromagnetically coupled ions is equal to a product of probabilities of QTM for each ion. Therefore, the two-ion QTM probability is always lower. In this study, we observed a similar effect in the Dy3+-based SIM. Moreover, it is a disordered system in which the Dy3+ ions are randomly distributed over the Ca(2) sites. The average inter-ion distance between the Dy3+ ions in 2 and 4 is 10.2 Å and the closest individually possible separations are 4.1 and 5.6 Å when a second Dy3+ ion is located in the neighboring Ca(2)3 triangle. The latter distances provide a magnetic dipole interaction of an order of 1 cm−1. This may be sufficient to correlate spins of the neighboring ions at a measurement temperature of 1.8 K. Such a ferromagnetic interaction may manifest itself in the increase in χT at low enough temperatures.24 However, we do not observe such an increase (or a substantial decrease in the case of antiferromagnetic interaction) in the measured χT(T) values (see Fig. S7†). At temperatures of 10–20 K, ferromagnetic interaction may be masked by a general decrease of χT with lowering temperature (see discussion above), while at the lowest temperatures of a few K, the magnetization becomes irreversible, which hinders the precise measurement of an equilibrium magnetization. It is worth mentioning that the expected directions of the magnetic moments of two neighboring DyO+ units can lie under an angle of ca. 120°. Hence, the expected increase in susceptibility may be smaller or even change its sign. Therefore, without experimental evidence, the discussed reason for the observed effect of the QTM suppression remains a hypothesis. Indeed, more detailed studies are necessary to clear up this issue.
In summary, by varying the atomic environment of the single ion magnet DyO+ embedded in an apatite crystal lattice, high SIM properties are retained and thus, as demonstrated, appropriate substitutions allow for their fine tuning. Fluoride for hydroxide substitution as well as increasing the DyO+ concentration results in enhancement of the energy barrier for magnetization reversal. The observed Ueff relations with the crystal lattice parameters and the hydrogen bonding suggest probable mechanisms for tuning. An inter-ion interaction in the Dy-rich compounds elongates relaxation time at low temperatures under a zero field, implying that QTM is suppressed. To the best of our knowledge, such an effect is reported for the first time for a Dy3+-containing SIM as well as in a disordered system. Notably, the compounds studied are chemically and thermally stable. Hence, these findings may promote the development of robust SIM-containing materials for high-density magnetic recording and spintronics applications.
The study was supported by Russian Science Foundation under Grant No. 16-13-10031.
Conflicts of interest
There are no conflicts to declare.Notes and references
- R. Sessoli, D. Gatteschi, A. Caneschi and M. A. Novak, Nature, 1993, 365, 141 CrossRef CAS.
- J. D. Rinehart and J. R. Long, Chem. Sci., 2011, 2, 2078 RSC.
- S. Thiele, F. Balestro, R. Ballou, S. Klyatskaya, M. Ruben and W. Wernsdorfer, Science, 2014, 344, 1135 CrossRef CAS.
- J. J. Baldoví, S. Cardona-Serra, A. Gaita-Ariño and E. Coronado, Adv. Inorg. Chem., 2017, 69, 213 CrossRef.
- M. Urdampilleta, S. Klayatskaya, M. Ruben and W. Wernsdorfer, ACS Nano, 2015, 9, 4458 CrossRef CAS.
- I. V. Krainov, J. Klier, A. P. Dmitriev, S. Klyatskaya, M. Ruben, W. Wernsdorfer and I. V. Gornyi, ACS Nano, 2017, 11, 6868 CrossRef CAS.
- M. Feng and M.-L. Tong, Chem. – Eur. J., 2018, 24, 7574 CrossRef CAS PubMed.
- Y.-S. Ding, N. F. Chilton, R. E. P. Winpenny and Y.-Z. Zheng, Angew. Chem., 2016, 128, 16305 CrossRef.
- F.-S. Guo, B. M. Day, Y.-C. Chen, M.-L. Tong, A. Mansikkamaeki and R. A. Layfield, Angew. Chem., Int. Ed., 2017, 56, 11445 CrossRef CAS.
- C. A. P. Goodwin, F. Ortu, D. Reta, N. F. Chilton and D. P. Mills, Nature, 2017, 548, 439 CrossRef CAS.
- P. E. Kazin, M. A. Zykin, V. V. Utochnikova, O. V. Magdysyuk, A. V. Vasiliev, Y. V. Zubavichus, W. Schnelle, C. Felser and M. Jansen, Angew. Chem., 2017, 129, 13416 CrossRef.
- L. Ungur and L. F. Chibotaru, Phys. Chem. Chem. Phys., 2011, 13, 20086 RSC.
- T. White, C. Ferraris, J. Kim and S. Madhavi, Rev. Mineral. Geochem., 2005, 57, 307 CrossRef CAS.
- T. J. White and D. ZhiLi, Acta Crystallogr., Sect. B: Struct. Sci., 2003, 59, 1 CrossRef CAS.
- Inorganic Phosphate Materials, ed. T. Kanazava, Elsevier Science Publishing B. V., Amsterdam, 1989, p. 297 Search PubMed.
- V. Petříček, M. Dušek and L. Palatinus, Crystallographic Computing System JANA2006: General Features, Z. Kristallogr. - Cryst. Mater., 2014, 229, 345 Search PubMed.
- S. M. J. Aubin, Z. Sun, L. Pardi, J. Krzystek, K. Folting, L.-C. Brunel, A. L. Rheingold, G. Christou and D. N. Hendrickson, Inorg. Chem., 1999, 38, 5329 CrossRef CAS.
- H. Zhao, X. Li, J. Wang, S. Qu, J. Weng and X. Zhang, J. Biomed. Mater. Res., 2000, 52, 157 CrossRef CAS.
- P. E. Kazin, M. A. Zykin, R. E. Dinnebier, O. V. Magdysyuk, Y. D. Tretyakov and M. Jansen, Z. Anorg. Allg. Chem., 2012, 638, 909 CrossRef CAS.
- J. C. Trombe and G. Montel, J. Inorg. Nucl. Chem., 1978, 40, 15 CrossRef CAS.
- B. O. Fowler, Inorg. Chem., 1974, 13, 194 CrossRef CAS.
- G. C. Maiti and F. Freund, J. Inorg. Nucl. Chem., 1981, 43, 2633 CrossRef CAS.
- Y.-S. Ding, K.-X. Yu, D. Reta, F. Ortu, R. E. P. Winpenny, Y.-Z. Zheng and N. F. Chilton, Nat. Commun., 2018, 9, 3134 CrossRef.
- K. Katoh, S. Yamashita, N. Yasuda, Y. Kitagawa, B. K. Breedlove, Y. Nakazawa and M. Yamashita, Angew. Chem., Int. Ed., 2018, 57, 9262 CrossRef CAS.
- X. Zhang, H. Xie, M. Ballesteros-Rivas, T. J. Woods and K. R. Dunbar, Chem. – Eur. J., 2017, 23, 7448 CrossRef CAS.
- Z.-X. Wang, X. Zhang, Y.-Z. Zhang, M.-X. Li, H. Zhao, M. Andruh and K. R. Dunbar, Angew. Chem., Int. Ed., 2014, 53, 11567 CrossRef CAS.
Footnote |
| † Electronic supplementary information (ESI) available: Powder X-ray diffraction patterns, crystal structure data, magnetisation relaxation data plots, FT-IR plots, and hysteresis magnetization data plots. See DOI: 10.1039/c8ce01706a |
| This journal is © The Royal Society of Chemistry 2019 |