Rapid detection of carbapenem-resistant Enterobacteriaceae using pH response based on vancomycin-modified Fe3O4@Au nanoparticle enrichment and the carbapenemase hydrolysis reaction†
Jianmin
Wang‡
ab,
Wei
Yang‡
ac,
Qiling
Peng
d,
Daobin
Han
a,
Liangsheng
Kong
a,
Lu
Fan
a,
Min
Zhao
a and
Shijia
Ding
 *ad
*ad
aKey Laboratory of Clinical Laboratory Diagnostics (Ministry of Education), College of Laboratory Medicine, Chongqing Medical University, Chongqing 400016, China. E-mail: dingshijia@cqmu.edu.cn; dingshijia@163.com; Tel: +86 23 68485240
bDepartment of Clinical Laboratory, Yongchuan Hospital of Chongqing Medical University, Chongqing 402160, China
cDepartment of Clinical Laboratory, Zhejiang Provincial People's Hospital, People's Hospital of Hangzhou Medical College, Hangzhou, 310014, China
dChongqing Engineering Research Center for Criminal Investigation Technology, Chongqing Medical University, Chongqing 400016, China
First published on 26th November 2019
Abstract
Rapid and simple detection of carbapenem-resistant Enterobacteriaceae (CRE) is important to manage infection and prevent the spread of these bacteria. In this work, we utilize pH response to detect CRE in urine rapidly. By using vancomycin-modified Fe3O4@Au nanoparticles (Fe3O4@Au@VanNPs), CRE in urine were enriched and separated efficiently via vancomycin–cell wall interaction. More importantly, carbapenemases released via CRE lysis were detected using a pH metre which responded to hydrogen ions generated from imipenem hydrolysis. Thus, the concentration of CRE in urine was detected via the carbapenemase hydrolysis reaction. The proposed method demonstrated a good linear relationship in the range of 104–108 cfu mL−1 for CRE with the limit of detection estimated to be 1.0 × 10³ cfu mL−1. More importantly, this method successfully detected clinically isolated CRE strains in urine samples within 3.5 h. Thus, this biosensing strategy might have the potential for practical application in the rapid detection of various resistant bacteria.
Introduction
Carbapenem-resistant Enterobacteriaceae (CRE), a large group of Gram-negative bacilli, are an urgent public health threat with a high risk of widespread and life-threatening infections.1 According to the WHO guidelines of 2017, the rapid identification of CRE is important to manage infection and prevent the spread of these bacteria.2 Currently, the detection of CRE uses phenotypic, genotypic, and enzymatic activity-based methods. Phenotypic methods are common but are usually rather limited by their low specificity and sensitivity as well as long turnaround time (2–3 days).3 PCR-based genotypic methods are the most mature but suffer from high cost and an inability to detect unknown carbapenemase genes.4 MALDI-TOF MS, multiplex LAMP, and next-generation sequencing can greatly shorten assay times (from several days to hours) and enhance detection sensitivity (from 106 to 104 cfu mL−1).5–7 Nevertheless, these methods are rarely implemented in most routine clinical microbiology laboratories because they require high skill levels and specialized equipment.8 Thus, development of simple and rapid methods for CRE detection is still an urgent requirement for modern clinical diagnosis.Carbapenemases, produced by CRE to specifically hydrolyze carbapenem antibiotics, are the most important targets for CRE detection.9 Compared with other enzyme hydrolysis reactions, the carbapenemase hydrolysis reaction is specific because the substrate (carbapenems) cannot be hydrolyzed by almost all beta-lactamases and other hydrolases. Thus, the carbapenemase activity-based test is accepted as crucial for rapid CRE detection. Owing to their merits of simplicity, rapidity and sensitivity, the bioassay methods for detection of carbapenemase activity have attracted considerable attention.10 Based on carbapenems, the specific native substrates of carbapenemase, Mao and colleagues developed a highly specific probe with a carbapenem core structure for detection of carbapenemase activity.11 Zhang and co-workers reported an in-cell calorimetry approach for real-time monitoring of carbapenemases in live bacteria.12 However, the above research studies on CRE detection have not been further performed for complex biological matrices. Hence, a simple, rapid and specific biosensing method for detection of carbapenemase activity in complex biological matrices is necessary.
In order to overcome the interference from complex matrices, such as blood, urine and cerebrospinal fluid, specific identification and separation of the target bacteria is the foremost step. Functional magnetic nanoparticle (MNP) based separation technologies could offer convenient solutions to enrich and separate the target bacteria with high efficiency.13,14 Among various MNPs, Fe3O4@Au nanoparticles (Fe3O4@AuNPs) are particularly common due to the excellent magnetism of Fe3O4 and easy modification of Au nanoparticles (AuNPs).15 Moreover, AuNPs could improve the surface-to-volume ratio and provide several binding strategies to conjugate biological molecules.16 Recently, based on the AuNP-labeled CEA aptamer, a dual signal readout with the “signal-off” of WP1 and “signal-on” of WP2 was employed for the spatially resolved PEC strategy to detect CEA.17 Tang and co-workers also attached CdS QDs onto BiOCl–Au and evidently enhanced the photocurrent intensity thanks to the synergistic effect of Z-scheme BiOCl–Au–CdS QDs.18 In addition, AuNPs could retain the excellent magnetism of Fe3O4 as they were coated on the surface of Fe3O4 to avoid oxidation in air.19 Thus, Fe3O4@AuNP composites not only present magnetic separation ability, but can also maximize loading to enhance bioassay sensitivity.20
Functional MNPs with surface modifications have fascinating application prospects in the field of bioassay technologies.21,22 Bacteria-specific antibodies, aptamers and antibiotics are commonly used probes to modify functional MNPs for bacterial identification specifically.23–25 Unlike antibodies and aptamers, vancomycin (Van) is used as a universal probe for bacterial identification due to strong interaction with the cell wall of Gram-positive and Gram-negative bacteria.26 Xu and co-workers developed a biosensing method to detect Gram-negative bacteria in human blood using an FePt@Van composite as capture probes.27 Chen and co-workers designed Van-Fe3O4@Au nanoeggs to target and kill drug-resistant bacteria in hospitals.28 Researchers used Van modified MNPs in bacterial detection and obtained good performance. However, to the best of our knowledge, Fe3O4@Au@VanNPs have not been used for CRE detection.
pH is regarded as an easily detectable target in chemical and biological analysis and is closely related to the concentration of hydrogen ions.29 The Carba NP test is used to detect CRE via the color change of the indicator (phenol red) which indicates the pH decrease.30 As a recommended method, it is commonly used to detect clinical strains isolated from patients in clinical microbiology laboratories.31 However, in practice, phenol color changes are estimated by the naked eye by the operator which might be subjective and hard to standardize. Therefore, pH sensing was used to circumvent these limitations.
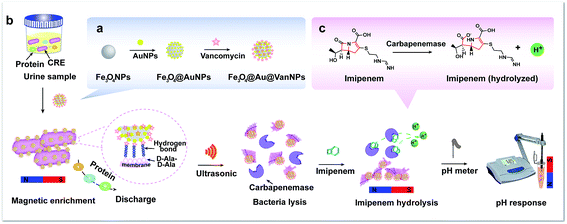
In this work, we chose Fe3O4@Au@VanNPs as the identification tool and pH as the output signal to develop a rapid detection method for CRE in urine. The Fe3O4@Au@VanNPs were assembled from core Fe3O4NPs and surface deposited AuNPs and Van (Scheme 1a). Here, Van acted as the capture probe and interacted with the terminal D-Ala–D-Ala peptide unit of the cell wall of the Gram-negative bacterium through the formation of five hydrogen bonds.32 Thus, the Fe3O4@Au@VanNPs could capture the bacteria in the samples via specific Van–cell wall interaction and then isolate them through magnetic separation. Subsequently, the Fe3O4@Au@VanNP-captured bacterial cells were resuspended in bacterial protein extraction buffer and then lysed with ultrasonication to release the carbapenemases, which specifically hydrolyzed the C–N bond in imipenem and generated hydrogen ions (Scheme 1c). Finally, the carbapenemases were detected with a pH meter (Scheme 1b). With the increasing concentration of CRE, more hydrogen ions were generated via carbapenemase hydrolysis interaction. Thus, the pH of the solution decreased, and a regression model was used to detail the relationship between the CRE concentration and pH value. In summary, a simple, rapid and enzyme-free method for CRE detection was established using magnetic separation in combination with pH sensing. The proposed biosensing method was applied to detect CRE in human urine successfully, which demonstrates its potential for practical application in the rapid detection of various resistant bacteria.
Experimental
Materials
Iron trichloride hexahydrate (FeCl3·6H2O), trisodium citrate, isopropyl alcohol, 3-aminopropyltriethylsilane (APTS), 2-(N-morpholino)ethanesulfonic acid (MES), and Van were all purchased from Sigma-Aldrich Chemical Co. Ethanol, ethylene glycol, and hydrochloric acid (HCl, 37% in water) were supplied by Kelong Chemical Inc. Chloroauric acid (HAuCl4, 1%) and sodium acetate anhydrous (NaAc) were obtained from Shanghai Aladdin Bio-Chem Technology Co., Ltd. Sodium chloride (NaCl), ethylene diamine tetraacetic acid (EDTA), zinc sulfate heptahydrate (ZnSO4·7H2O), phenol red, and sodium hydroxide were obtained from Sangon Biotech Co., Ltd. Columbia blood agar was obtained from Pangtong Medical Equipment Co., Ltd. Imipenem and cilastatin sodium for injection was obtained from Zhuhai United Laboratories Co., Ltd.The buffer solutions are as follows: MES buffer solution (30 mM MES, pH 6.0), bacterial protein extraction buffer (100 mM NaCl, 10 mM EDTA, pH 8.0), and Carba NP test reagent (10 mM ZnSO4·7H2O, 1% phenol red, pH 7.8 ± 0.1). All other reagents were of analytical grade and used as received. Deionized water was obtained from a Millipore water purification system (≥18.2 MΩ, Milli-Q, Millipore, USA) and used in all assays.
Apparatus
The morphologies of the different nanomaterials were characterized via transmission electron microscopy (TEM, Hitachi, Tokyo, Japan) and ultraviolet-visible (UV-vis) spectrophotometry (UV-2450, Shimadzu, Kyoto, Japan). The size distribution of all the nanomaterials was measured by dynamic light scattering (DLS) using a Zetasizer Nano ZS (NANO-ZS 90, Malvern, UK). X-ray photoelectron spectroscopy (XPS) was performed using a Thermo Scientific Escalab 250Xi XPS spectrometer with the monochromatic Al Kα line at 1486.6 eV. An ultrasonic cell disruption system (Sonic Ruptor 4000, OMNI, Kennesaw GA, USA) was used for bacterial lysis. An incubator (PYS-DHS400-BS-II, Yuejin, Shanghai, China) and shaking incubator (ZWY-240, Zhicheng, Shanghai, China) were used for bacterial culturing. The pH values of the reaction systems were measured with a pH meter (1190, Shimadzu, Kyoto, Japan).Preparation of bacterial samples
Escherichia coli ATCC 25922 (E. coli 25922), Staphylococcus aureus ATCC 43300 (S. au 43300), Enterococcus faecalis ATCC 29212 (E. fa 29212), Pseudomonas aeruginosa ATCC 27853 (P. ae 27853), Klebsiella pneumoniae ATCC BAA1705 (K. pn BAA1705, carbapenemase positive) and ATCC BAA1706 (K. pn BAA1706, carbapenemase negative) were purchased from the Chongqing Center for Clinical Laboratory. Clinical CRE strains were isolated from the Yongchuan Hospital of Chongqing Medical University (Table S1†). All the strains were cultured on blood agar plates at 37 °C for 16–18 h. The bacterial suspensions were prepared with MES buffer. The desired bacterial concentration was adjusted by measuring the optical density at 600 nm. This was confirmed by plating serially diluted samples on blood agar plates and counting the colony forming units (cfu) after incubation overnight at 37 °C.Synthesis of Fe3O4 nanoparticles (Fe3O4NPs) and APTS-modified Fe3O4NPs
We prepared Fe3O4NPs via the hydrothermal method.33 Here, FeCl3·6H2O (1.34 g), trisodium citrate (4.48 g), and NaAc (1.14 g) were dissolved in ethylene glycol (25 mL) under vigorous stirring for 4 h. The solution was transferred into a reactor and heated at 200 °C for 6 h. The Fe3O4NPs were collected with magnetic separation and washed three times with ethanol and water sequentially. The Fe3O4NPs were then stored in a clean 5 mL EP tube at 4 °C after air drying.APTS was then modified on the surface of Fe3O4NPs.34 Fe3O4NPs (0.10 g) were dissolved in 10 mL isopropyl alcohol and further diluted with 25 mL isopropyl alcohol containing 100 μL APTS under ultrasonication in a water bath. After bubbling with N2 for 30 min, the solution was heated at 70 °C under mild mechanical stirring for 6 h. After washing three times with ethanol and water respectively, the APTS-modified Fe3O4NPs were collected via magnetic separation. The APTS-modified Fe3O4NPs were then redispersed in water to form a homogeneous dispersion (ca. 0.8 wt%) and stored in a clean 5 mL EP tube at 4 °C.
Synthesis of AuNPs
AuNPs were prepared via an improved citrate reduction method.35 In short, a HAuCl4 solution (1%, 5 mL) was diluted with 142 mL deionized water and boiled at 200 °C. A trisodium citrate solution (34 mM, 17 mL) was added rapidly and heated at 200 °C for 20 min after the color of the solution changed from blue to red. The solution was stirred while cooling to room temperature and stored at 4 °C in a sealed light-resistant container.Synthesis of Fe3O4@AuNPs and Fe3O4@Au@VanNPs
The AuNP aqueous solution (6 mL) was mixed with APTS-modified Fe3O4NPs (15 mL) under ultrasonication for 15 min and stirred for 3 h at room temperature. The Fe3O4@AuNPs were collected with magnetic separation and washed six times to remove unbound AuNPs. They were then redispersed in water to form a homogeneous dispersion (ca. 0.8 wt%) and stored at 4 °C in a sealed light-resistant container.Van (12.0 mg) was dissolved in an 18 mL Fe3O4@AuNP aqueous solution under ultrasonication for 15 min and then stirred for 6 h at room temperature. The Fe3O4@AuNPs were collected with magnetic separation and washed six times to remove unbound Van. They were then redispersed in water to form a homogeneous dispersion (ca. 0.8 wt%) and stored at 4 °C in a sealed light-resistant container.
Capture of bacteria by Fe3O4@Au@VanNPs
The strains were grown on blood agar plates at 37 °C for 16–18 h and suspensions were prepared (OD600 = 0.5) in MES buffer. The final concentration of bacteria was 1.5 × 10⁴ cfu mL−1 as obtained in a 10-fold dilution. The capture efficiency experiment was performed as follows: 400 μL of Fe3O4@Au@VanNPs (2 mg mL−1) were mixed with 30 μL of a bacterial suspension diluted in 570 μL MES buffer and incubated at 37 °C and 180 rpm for 50 min. The Fe3O4@Au@VanNPs–bacteria conjugates were collected and redispersed in bacterial protein extraction buffer to form a homogeneous dispersion. The bacterial count was calculated by plate counting of the Fe3O4@Au@VanNPs–bacteria conjugates (captured) or the supernatant after binding (unbound). The capture efficiency was calculated according to the following formula: capture efficiency (%) = (captured bacterial count)/(total bacterial count) × 100%. The total bacterial count after binding was calculated as the captured bacterial count plus unbound bacterial count.Detection of pH for captured bacteria
Bacterial samples with varying concentrations (1.5 × 10⁴–1.5 × 10⁸ cfu mL−1) were prepared by diluting the freshly cultured bacteria with MES buffer. Each CRE standard solution (667 μL) was mixed with 333 μL of MES buffer containing 0.8 mg Fe3O4@Au@VanNPs and incubated at 37 °C and 180 rpm for 50 min. The captured bacteria were then resuspended in 300 μL bacterial protein extraction buffer and destroyed by ultrasonication (120 W, work 5 s, pause 5 s, total time 3 min) in an ice bath. The Carba NP test reagent (containing imipenem 6.0 mg mL−1, 1 mL) was then added and mixed well. After incubation at 37 °C for 2 h, the supernatant was collected via magnetic separation and used to detect the pH value.For real sample analysis, urine samples were collected from healthy volunteers and spiked with various concentrations of clinically isolated CRE strains (1.50 × 10⁴–1.50 × 10⁶ cfu mL−1). Then, 1 mL of each urine sample was mixed with 0.8 mg Fe3O4@Au@VanNPs and incubated at 37 °C and 180 rpm for 50 min. After magnetic separation, the pH of the captured bacteria was detected by the procedure described above.
Statistical analysis
Statistical analyses were performed using GraphPad Prism 5 Software (GraphPad Software, Inc., San Diego, CA). Data are expressed as the mean ± standard deviation (SD). Means of 2 continuous normally distributed variables were compared by independent samples Student’s t test. A value of P < 0.05 was considered significant.Live subject statement
All experiments were performed in compliance with the relevant laws and institutional guidelines (Declaration of Helsinki) and have been approved by the Yongchuan Hospital of Chongqing Medical University medical ethics committee. Informed consent was obtained for any experimentation with human subjects.Results and discussion
Characterization of the Fe3O4NPs and Fe3O4@Au@VanNPs
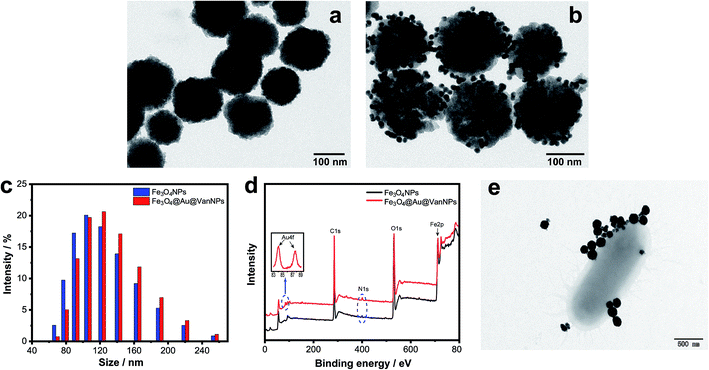
We first synthesized Fe3O4NPs via the hydrothermal method and then modified the surface of the Fe3O4NPs with APTS. AuNPs and Van were bound with the Fe3O4NPs in the appropriate order via coordination bonds.The morphology and structure of the Fe3O4NPs and Fe3O4@Au@VanNPs were characterized with TEM. Fig. 1a shows that spherical and solid Fe3O4NPs were successfully synthesized. The resulting Fe3O4@Au@VanNPs are uniform with a mean diameter of ∼100 nm. The AuNPs are about 10 nm and evenly distributed on the surface of the Fe3O4@Au@VanNPs (Fig. 1b). DLS was also used to confirm the size distribution of Fe3O4NPs and Fe3O4@Au@VanNPs. As shown in Fig. 1c, the average diameter of Fe3O4NPs increased from 106 to 122 nm after AuNP and Van conjugation (Fe3O4@Au@VanNPs). We further confirmed the successful formation of the Fe3O4NPs and Fe3O4@Au@VanNPs via UV-vis absorption spectroscopy. The Fe3O4NP dispersion exhibited no absorption band in the UV-vis spectrum (Fig. S1†), but the surface plasmon resonance effect of AuNPs led to a typical absorption band around 538 nm for the Fe3O4@Au@VanNPs.36
The AuNP and Van conjugation on the surface of Fe3O4NPs was confirmed from the XPS spectrum where the presence of Au4f (84.1 eV and 87.7 eV) and N1s (399.4 eV) was attributed to Au and Van, respectively (Fig. 1d).
The capture ability of Fe3O4@Au@VanNPs to bacteria was characterized by TEM. After incubation of Fe3O4@Au@VanNPs and CRE in the MES buffer, the product was washed 3 times and separated using a magnet for TEM detection. As shown in Fig. 1e, several Fe3O4@Au@VanNPs were tightly conjugated around the CRE cells, which suggested that Fe3O4@Au@VanNPs could effectively capture CRE from the solution.
The capture efficiency of Fe3O4@Au@VanNPs
To verify the binding ability of the Fe3O4@Au@VanNPs, we first evaluated whether the total number of bacteria recovered was consistent with the number originally added in the magnetic capture experiment. As shown in Fig. 2, there is no significant difference between the amount of bacteria with and without Fe3O4@Au@VanNP binding. The results indicated that the Fe3O4@Au@VanNPs had no significant antibacterial effect on the bacteria. We then compared the capture efficiency of Fe3O4@Au@VanNPs for two Enterobacteriaceae strains. The Fe3O4@Au@VanNPs showed higher capture efficiency for E. coli than for K. pn (Fig. S2†). As the binding progress was due to specific Van–cell wall interaction, the difference in the peptidoglycan skeleton between the two strains might be the main cause for the different capture efficiencies. Strain characteristics also contribute to the difference because K. pn is mucinous and it is difficult to prepare a uniform suspension of it. These findings concurred with previous reports.26,37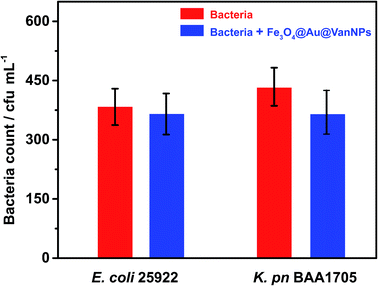 | ||
| Fig. 2 Total bacteria for two Gram-negative Enterobacteriaceae strains before and after binding with Fe3O4@Au@VanNPs. Error bars indicate the standard deviation of three independent experiments. | ||
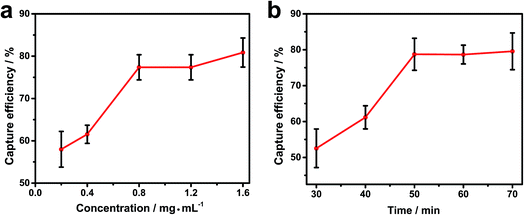
To achieve the best capture efficiency, we also optimized the main conditions of the reaction system such as the concentration of Fe3O4@Au@VanNPs and incubation time of Fe3O4@Au@VanNPs–bacteria binding especially for K. pn. The proper concentration of Fe3O4@Au@VanNPs is an important variable. Sufficient Fe3O4@Au@VanNPs are needed to fully bind the target bacteria, but excessive Fe3O4@Au@VanNPs will lead to unnecessary waste and high cost.
Fig. 3a and S3† shows that the capture efficiency obviously increased with concentration from 0.2 to 0.8 mg mL−1 with only minor improvements at higher concentrations; 0.8 mg mL−1 was used for subsequent experiments. The reaction time is another key factor both to ensure an adequate response and to minimize the analysis time. The incubation time of Fe3O4@Au@VanNPs–bacteria binding was studied, and the capture efficiency drastically improved with incubation time and then plateaued after 50 min (Fig. 3b). Therefore, we chose 50 min as the best incubation time. Under these conditions, the capture efficiency values for E. coli and K. pn were 80.0% and 75.4%, respectively (Fig. 3 and S4†).
To further verify the binding ability of the Fe3O4@Au@VanNPs, we chose five clinically isolated CRE strains, including three K. pn strains and two E. coli strains, to repeat the capture experiment and measure the capture efficiency (Fig. 4): all the strains showed acceptable capture efficiency from 74.2% to 77.2%. Similarly, the capture efficiency of Fe3O4@Au@VanNPs for the E. coli strains was better than that for K. pn strains. These results were consistent with the previous results shown in Fig. S2.†
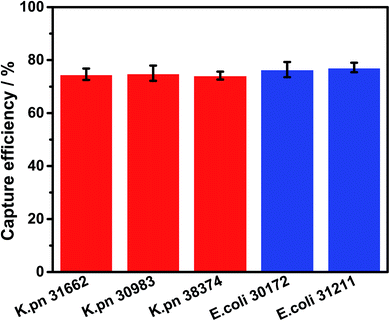 | ||
| Fig. 4 Magnetic capture efficiency of Fe3O4@Au@VanNPs for 5 clinically isolated strains. Error bars indicate the standard deviation of three independent experiments. | ||
Analytical performance
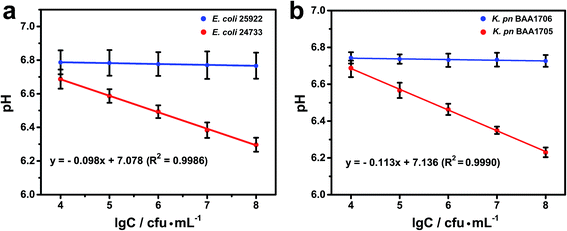
The pH decreased with the number of CRE. A linear relationship was observed between the pH and the logarithm of bacterial concentration (Fig. 5). The linear regression equations were Y = −0.098X + 7.078 with a correlation coefficient (R2) of 0.9986 for E. coli and Y = −0.113X + 7.136 with a correlation coefficient (R2) of 0.9990 for K. pn, respectively, where Y is the pH value and X is the logarithm of bacterial concentration. The limit of detection was roughly estimated to be 1.0 × 10³ cfu mL−1 for each strain at three standard deviations above the blank.According to clinical microbiology guidelines (WS/T 489–2016 (laboratory diagnosis of urinary tract infections)), a urinary bacterial (Gram-negative bacilli) count above 105 cfu mL−1 is of clinical significance.38 Thus, the sensitivity of this biosensing method meets these requirements.
Specificity and reproducibility
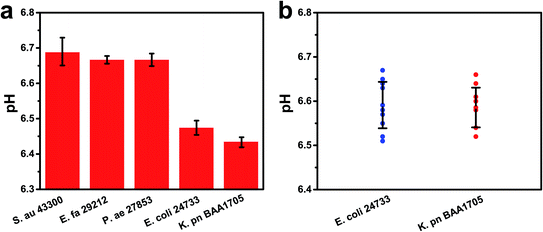
Specificity is critical to prevent false positives and false negatives. To evaluate the specificity of this method, bacterial samples containing two CRE strains (K. pn BAA1705 and E. coli 24733) and different non-CRE strains (S. au 43300, E. fa 29212, and P. ae 27853) were measured via this biosensing strategy for the detection of CRE. The pH of the target strains was below 6.50, lower than that of the other control bacteria (about 6.70) even when the concentration of the control bacteria was ten-fold higher than that of the target (Fig. 6a). These results demonstrated that the method had favorable specificity towards CRE strains. This is mainly due to the specific hydrolysis reaction of carbapenemases. The pH remained near 6.70 for several other non-CRE strains, which proved that our method had a good performance in specificity.The reproducibility was also investigated via three independent experiments to analyze the pH of two CRE serotypes (K. pn BAA1705 and E. coli 24733, 1.0 × 10⁵ cfu mL−1). Relative standard deviations of 0.76% and 0.89% were obtained for K. pn and E. coli, respectively, indicating good reproducibility (Fig. 6b).
Real sample analysis
Urine samples (containing no CRE strains, as seen in Fig. S5†) were collected from healthy volunteers and spiked with various concentrations (1.50 × 10⁴–1.50 × 10⁶ cfu mL−1) of clinically isolated CRE strains. Before the CRE test, the influence of the original pH was evaluated. The original pH of the urine samples had no significant effect on the test (Fig. S6†), because the factors, except for the CRE cells, affecting the pH value of the urine samples were removed by magnetic separation. The prepared samples were tested with the biosensing method for detection of CRE and showed recovery values between 89.3% and 105.3% (Table 1). These results demonstrated that this biosensing method is reliable for detecting CRE in human urine and has potential application value for other bacteria via other capture probes. Benefitting from magnetic enrichment and pH response, this method exhibits the merits of culture-free analysis, simple manipulation and quantitative analysis, which are suitable in common clinical laboratories for rapid CRE detection. Thus, this method had potential prospects in clinical applications compared with the existing methodologies (culture- or PCR-based methods).3,4Conclusion
In summary, we reported a rapid detection method for CRE by pH response based on Fe3O4@Au@VanNP enrichment and the carbapenemase hydrolysis reaction. The Fe3O4@Au@VanNPs were used as identification and capturing elements and efficiently enriched CRE from urine samples. Combining with pH response to carbapenemase hydrolysis reaction, the proposed method successfully measured the CRE concentration in human urine in less than 3.5 h through simple manipulation. More importantly, our strategy can significantly shorten the turn-around time compared with conventional culture-based tests, which is crucial in hospital settings to implement infection control and prevention measures. In short, this bioassay method is an effective approach for quantitative detection of CRE, which has potential prospects in medical diagnostics and infection control.Conflicts of interest
The authors declare that they have no conflicts of interest.Acknowledgements
This work was supported by the National Natural Science Foundation of China (Grant No. 81873980), the National Science and Technology Major Project of the Ministry of Science and Technology of China (Grant No. 2018ZX10732202), the Science and Technology Planning Project of Chongqing Science and Technology Commission and Health Commission (Grant No. 2018MSXM138), and the Science and Technology Research Program of Chongqing Municipal Education Commission (Grant No. KJQN201800411).References
- WHO, Antimicrobial resistance: global report on surveillance, 2014, http://www.who.int/drugresistance/documents/surveillancereport/en/(accessed October 2019) Search PubMed.
- WHO, Guidelines for the prevention and control of carbapenem-resistant Enterobacteriaceae, Acinetobacter baumannii and Pseudomonas aeruginosa in health care facilities, https://www.who.int/infection-prevention/publications/guidelines-cre/en/(accessed October 2019) Search PubMed.
- P. Nordmann and L. Poirel, J. Antimicrob. Chemother., 2013, 68, 487–489 CrossRef CAS.
- A. Birgy, P. Bidet, N. Genel, C. Doit, D. Decré, G. Arlet and E. Bingen, J. Clin. Microbiol., 2012, 50, 1295–1302 CrossRef CAS.
- J. Yu, J. Liu, Y. Li, J. Yu, W. Zhu, Y. Liu and L. Shen, Ann. Clin. Microbiol. Antimicrob., 2018, 17, 22 CrossRef PubMed.
- R. Yang, H. Zhang, X. Li, L. Ye, M. Gong, J. Yang, J. Yu and J. Bai, Biosci. Rep., 2018, 38, BSR20180425 CrossRef.
- C. P. Stefan, A. T. Hall and T. D. Minogue, Sci. Rep., 2018, 8, 2028 CrossRef.
- J. Li, C. Wang, H. Kang, L. Shao, L. Hu, R. Xiao, S. Wang and B. Gu, RSC Adv., 2018, 8, 4761–4765 RSC.
- R. Viau, K. M. Frank, M. R. Jacobs, B. Wilson, K. Kaye, C. J. Donskey, F. Perez, A. Endimiani and R. A. Bonomo, Clin. Microbiol. Rev., 2016, 29, 1–27 CrossRef CAS.
- P. Bogaerts, S. Yunus, M. Massart, T. D. Huang and Y. Glupczynski, J. Clin. Microbiol., 2016, 54, 349–358 CrossRef CAS.
- W. Mao, L. Xia and H. Xie, Angew. Chem., Int. Ed. Engl., 2017, 56, 4468–4472 CrossRef CAS.
- Y. Zhang, J. E. Lei, Y. He, J. Yang, W. Wang, A. Wasey, J. Xu, Y. Lin, H. Fan, G. Jing, C. Zhang and Y. Jin, Angew. Chem., Int. Ed. Engl., 2018, 57, 17120–17124 CrossRef CAS.
- Z. Zhang, C. Wang, L. Zhang, Q. Meng, Y. Zhang, F. Sun and Y. Xu, Anal. Methods, 2017, 9, 5378–5387 RSC.
- Z. Qiao, C. Lei, Y. Fu and Y. Li, Anal. Methods, 2017, 9, 5204–5210 RSC.
- X. Zhang and S. N. Ding, Sens. Actuators, B, 2017, 240, 1123–1133 CrossRef CAS.
- X. Mo, Z. Wu, J. Huang, G. Zhao and W. Dou, Anal. Methods, 2019, 11, 1475–1482 RSC.
- Z. Qiu, J. Shu, J. Liu and D. Tang, Anal. Chem., 2019, 91, 1260–1268 CrossRef CAS.
- R. Zeng, Z. Luo, L. Su, L. Zhang, D. Tang, R. Niessner and D. Knopp, Anal. Chem., 2019, 91, 2447–2454 CrossRef CAS.
- M. Freitas, M. S. Couto, M. F. Barroso, C. Pereira, N. de-losSantos-Álvarez, A. J. Miranda-Ordieres, M. J. Lobo-Castanon and C. Delerue-Matos, ACS Sens., 2016, 1, 1044–1053 CrossRef CAS.
- F. Shang, Y. Liu, S. Wang, Y. Hu and Z. Guo, Electroanal, 2017, 29, 2098–2105 CrossRef CAS.
- B. Zhang, B. Liu, D. Tang, R. Niessner, G. Chen and D. Knopp, Anal. Chem., 2012, 84, 5392–5399 CrossRef CAS.
- Y. Lin, Q. Zhou, D. Tang, R. Niessner and D. Knopp, Anal. Chem., 2017, 89, 5637–5645 CrossRef CAS.
- Y. Zhu, M. Jović, A. Lesch, L. Tissières Lovey, M. Prudent, H. Pick and H. H. Girault, Angew. Chem., Int. Ed. Engl., 2018, 57, 14942–14946 CrossRef CAS.
- D. Cheng, M. Yu, F. Fu, W. Han, G. Li, J. Xie, Y. Song, M. T. Swihart and E. Song, Anal. Chem., 2016, 88, 820–825 CrossRef CAS.
- X. Wei, W. Zhou, S. T. Sanjay, J. Zhang, Q. Jin, F. Xu, D. C. Dominguez and X. Li, Anal. Chem., 2018, 90, 9888–9896 CrossRef CAS.
- A. J. Kell, G. Stewart, S. Ryan, R. Peytavi, M. Boissinot, A. Huletsky, M. G. Bergeron and B. Simard, ACS Nano, 2008, 2, 1777–1788 CrossRef CAS.
- J. Gao, L. Li, P. Ho, G. C. Mak, H. Gu and B. Xu, Adv. Mater., 2006, 18, 3145–3148 CrossRef CAS.
- W. C. Huang, P. J. Tsai and Y. C. Chen, Small, 2009, 5, 51–56 CrossRef CAS.
- R. Ye, C. Zhu, Y. Song, Q. Lu, X. Ge, X. Yang, M. Zhu, D. Du, H. Li and Y. Lin, Small, 2016, 12, 3094–3100 CrossRef CAS.
- P. Nordmann, L. Poirel and L. Dortet, Emerging Infect. Dis., 2012, 18, 1503–1507 CrossRef.
- CLSI, Performance Standards for Antimicrobial Susceptibility Testing, Twenty-Fifth Informational Supplement, CLSI document M100-S25, Clinical and Laboratory Standards Institute, Wayne, PA, 2015 Search PubMed.
- B. K. Hubbard and C. T. Walsh, Angew. Chem., Int. Ed. Engl., 2003, 42, 730–765 CrossRef CAS.
- P. Pirani, U. S. Patil, T. D. Apsunde, M. L. Trudell, Y. Cai and M. A. Tarr, J. Nanopart. Res., 2015, 17, 355–365 CrossRef.
- Y. Deng, Y. Cai, Z. Sun, J. Liu, C. Liu, J. Wei, W. Li, C. Liu, Y. Wang and D. Zhao, J. Am. Chem. Soc., 2010, 132, 8466–8473 CrossRef CAS PubMed.
- Y. Yuan, L. Li, M. Zhao, J. Zhou, Z. Chen and L. Bai, Analyst, 2019, 144, 1253–1259 RSC.
- J. J. Storhoff, A. A. Lazarides, R. C. Mucic, C. A. Mirkin, R. L. Letsinger and G. C. Schatz, J. Am. Chem. Soc., 2000, 122, 4640–4650 CrossRef CAS.
- A. J. Kell and B. Simard, Chem. Commun., 2007, 1227–1229 RSC.
- People's Republic of China Health Industry Standards, Laboratory diagnosis of urinary tract infections, WS/T 489-2016, National Health Commission of t he People’s Republic of China, Beijing, 2016 Search PubMed.
Footnotes |
| † Electronic supplementary information (ESI) available. See DOI: 10.1039/c9ay02196e |
| ‡ These authors contributed equally to this work. |
| This journal is © The Royal Society of Chemistry 2020 |

