DOI:
10.1039/C8AY01871E
(Paper)
Anal. Methods, 2019,
11, 44-48
Synthesis of novel fluorescent copper nanomaterials and their application in detection of iodide ions and catalysis†
Received
23rd August 2018
, Accepted 10th November 2018
First published on 13th November 2018
Abstract
In this work, polydimethyldiallylammonium chloride (PDDA) was used as a template and protective agent to synthesize high-fluorescence copper nanoparticles (CuNPs) at high temperature and high pressure. The high-fluorescence CuNPs were characterized by fluorescence spectroscopy (FL), ultraviolet-visible absorption spectroscopy (UV-vis), transmission electron microscopy (TEM), energy spectrum analysis (EDS), Fourier infrared spectroscopy (FTIR), and X-ray photoelectron spectroscopy (XPS). The fluorescence of CuNPs can be effectively quenched based on iodide, so high-fluorescence CuNPs were used as a fluorescent probe to detect iodine ions. The degree of fluorescence quenching of CuNPs showed a linear relationship (R = 0.9820) when the iodine concentration was 1–100 μmol L−1, and the minimum detection limit was 0.45 μmol L−1 (S/N = 3). The iodine ion was selected by high-fluorescence CuNPs, and the iodine ions in the actual water samples were detected. Based on this, the ultra-sensitive and unmarked detection of iodide was completed. In addition, we found that the copper nanomaterials also have catalytic ability to accelerate the reduction of methylene blue dye by phenylhydrazine.
1 Introduction
Inorganic anions exist widely in the environment and do great harm to the environment and human health when in excessive concentrations. The detection of inorganic anions is, therefore, an important parameter in water quality monitoring, and the detection of harmful inorganic anions in food and beverages are of great significance for the protection of human health. At present, the detection methods for inorganic anions are mainly dependent on ion chromatography, but the expensive instruments greatly restrict its application in the ordinary laboratory and increase the cost of detection and tedious detection steps. Therefore, the development of simple, fast and accurate detection methods has important practical significance for the detection of inorganic anions.
High-fluorescence nanomaterials have been widely used as fluorescence probes in the detection of metal cations in the environment. At present, the detection of inorganic anions is significantly lower. The main anions on which the fluorescence properties of metal nanomaterials are based include S2−, CN−, NO2−, and so on. Zhou et al.1 synthesized fluorescent AgNCs using glutathione (GSH) as a protective agent, and S2− quenched the fluorescence of silver nanomaterials, which was used for its detection. Ding et al.2 synthesized fluorescent Au@AgNCs with core–shell structure. AgS precipitation occurred by the interaction between Ag–S and Ag–S, and the fluorescence quenching was used to detect S2−. Chang et al.3 developed a highly sensitive and selective detection of S2− fluorescent nanoprobe-DNA protected Au@AgNCs. S2−, by interacting with Au and Ag (Au–S/Ag–S), causes the ligand DNA conformation to change from a tight hairpin to a disordered, curly structure, and eventually quenches the DNA–Au@AgNCs fluorescence. Lu et al.4 used lysozyme to protect gold nanomaterials. When in the presence of O2, CN− will etch the null gold nucleus of Lys–AuNCs to give the [Au(CN)2]− complex. The CN− is detected by the Lys–AuNCs fluorescence quenching. The detection of CN− by the CN− etching of the zero valent metal core has a slow detection speed and high detection limit. In 2014, Zong et al.5 first prepared a porous membrane with strong fluorescent AuNCs. The porous structure increased the contact sites between AuNCs and CN−, which increased the sensitivity of the detection for determining the CN− in red wine, fruit juice, and coffee. Liu et al.6 detected NO2− in water samples by quenching the fluorescence of BSA–AuNCs by NO2−. The mechanism of action involves NO2− exhibiting strong oxidizing properties under a weakly acidic pH, oxidizing zero-valent AuNCs and quenching the fluorescence. S. Watanabe7 synthesized other gold nanoparticles with mercapto glucose as a reductant and a protectant, which showed the selective identification of F− in the aqueous phase. Ye B. C.8 used other cysteamine-modified gold nanoparticles as colorimetric probes for the detection of SO42− in water.
In this work, copper nanoparticles (CuNPs) were synthesized by a simple one-step process. We know that the PDDA monomer is a halogen coordination compound, which is used as a protector and template for CuNPs. The CuNPs have high fluorescence and can detect iodide ions in halogen elements. When iodide ions are added to the system, the fluorescence of CuNPs can be quenched (as shown in Fig. 1), which is due to the synthesis of CuNPs with a positive charge, and electrostatic interactions lead to the adsorption of the negatively charged iodine ions.8 In order to improve the fluorescence properties of CuNPs, the temperature, reaction time, stability of CuNPs and concentration of CuSO4 were carefully optimized.
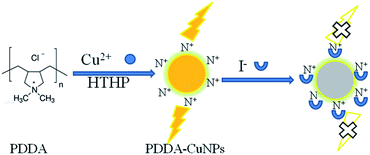 |
| | Fig. 1 Schematic illustration of the formation mechanism of CuNPs for I− sensing. | |
2 Experimental
2.1 Instrumentation and chemicals
The instruments used include the following: F-4600 fluorescence spectrophotometer (Hitachi High Tech. Company); JEM-2100F high resolution transmission electron microscope (Japan Electronics); type 6700 FT-IR spectrometer (Nicolet); U-2900 ultraviolet-visible spectrometer (Hitachi High Tech. Company); ESCALAB-250-XI X-ray photoelectron spectroscopy analyzer (XPS) (Thermo Scientific). The chemicals used in this study are as follows: polymethylenyl ammonium chloride (PDDA) (Tokyo Chemical Industrial Corporation); CuSO4, Pb(NO3)2, ZnSO4·7H2O (Tianjin Wind Ship Chemical Reagent Technology Co. Ltd.); Bi(NO3)3·3H2O, NaF (Beijing Public and Private Chemical Plant); NaCl, Na2S2O3·5H2O, KCl (Tianjin North Union Fine Chemicals Development Co. Ltd.); AgNO3 (Beijing Fuzhou Chemical Reagents Co. Ltd.); FeCl2·4H2O (Beijing ShangLe Chemical Plant); MnSO4·H2O (Beijing Chaoyang District Chemical Plant); Ni(NO3)2·6H2O (Beijing 5671 Chemical Plant); Na2CO3 (Tianjin City Shengao Chemical Reagents Co. Ltd.); Al(NO3)3·9H2O (Tianjin Bo Di Chemical Co. Ltd.); NaNO2 (Tianjin City Public and Private Chemical Reagents First Plant); NaBr; Cd(NO3)2 (Beijing Chemical Plant); KI (Hebei Baoding Chemical Reagent Factory); KCNS (Beijing Chemical Plant); NH4Cl (Tianjin People Chemical Plant); Na2SiO3·9H2O (Beijing Yizhuang Middle School Chemical Plant); CoCl2·6H2O (Shanghai Public and Private Joint Venture Factory). All chemicals used were of analytical grade, and the experimental solutions were made with ultra-pure water (resistance of about 18.25 MΩ).
2.2 Synthesis of CuNPs
PDDA (100 μL, 0.27 M, according to repeat unit calculation) and CuSO4 (10 mL, 0.0005 mol L−1) were mixed under magnetic stirring for 30 min, and then the mixture was transferred to a high-pressure Teflon-lined reactor (30 mL). The reaction was conducted for 12 h at 180 °C, and the reactor was cooled slowly to room temperature. Finally, the product was obtained by centrifugation for 30 min at 4 °C.
2.3 Detection of I−
Firstly, PBS (phosphate) buffer solution was added to the prepared CuNPs solution; the pH value of the buffer system was equal to 5.2. Then, iodide solution was added to different volumes (450 μL and 50 μL) of CuNPs solution in centrifuge tubes (1.5 mL) and reacted for 30 min. Finally, the fluorescence intensity was measured at the excitation wavelength of 337 nm.
2.4 Catalytic reduction of methylene blue dye
The catalytic properties of Cu clusters were determined as outlined in the literature.9 The mixture of methylene blue dye (200 μL, 100 μmol L−1) and hydrazine hydrate (50 μL) was added to CuNPs with different volumes (10–130 μL). The blue color of the mixture quickly disappeared, indicating that CuNPs could catalyze the reduction of methylene blue dye.
3 Results and discussion
3.1 Characterization of CuNPs
As shown in Fig. 2(A), the maximum peaks of the excitation and emission spectra of the synthesized high-fluorescence CuNPs were observed at 337 nm and 413 nm respectively. The inset in Fig. 2(A) shows photographs of CuNPs in sunlight (light yellow) and 365 nm ultraviolet light (blue).10Fig. 2(B) shows the transmission electron microscopy (TEM) image of CuNPs. The synthesized CuNPs particle size is small, with the average particle size being about 5 nm and the distribution is uniform, which shows that the CuNPs were successfully synthesized. The lattice spacing (d = 0.2913 Å) can be clearly observed at high resolution, corresponding to the (111) lattice plane of the copper vertical structure. Fig. S1† shows TEM images of CuNPs of different proportions. Fig. 2(C) shows the UV absorption spectra of CuSO4, CuNPs and PDDA; neither PDDA nor CuSO4 have obvious absorption peaks, but the CuNPs have a small UV absorption spectrum near 340 nm, which also corresponds to the fluorescence excitation data of CuNPs. Fourier transform infrared spectroscopy (FTIR) analysis of CuNPs was carried out to investigate the groups on the CuNPs surface. As shown in Fig. 2(D), the characteristic peaks of PDDA are 2920 cm−1 (C–H), 1650 cm−1 (C![[double bond, length as m-dash]](https://www.rsc.org/images/entities/char_e001.gif) C), 1465 cm−1 (C–C) and 1107 cm−1 (N–H).11,12 The N–H stretching vibration peak disappeared on the surface of CuNPs, indicating that PDDA is connected to CuNPs through the Cu–N bond. The surface of CuNPs also showed the C–H (990 cm−1) bending vibration peaks, indicating that the surface ligand of CuNPs contains the C–H group.
C), 1465 cm−1 (C–C) and 1107 cm−1 (N–H).11,12 The N–H stretching vibration peak disappeared on the surface of CuNPs, indicating that PDDA is connected to CuNPs through the Cu–N bond. The surface of CuNPs also showed the C–H (990 cm−1) bending vibration peaks, indicating that the surface ligand of CuNPs contains the C–H group.
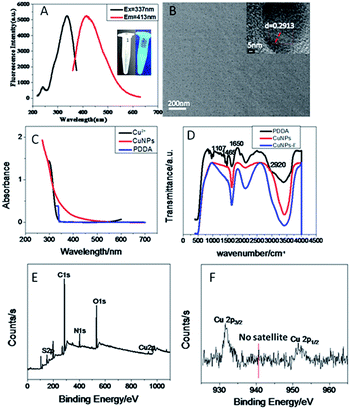 |
| | Fig. 2 (A) Fluorescence excitation and emission spectra of CuNPs; the inset shows photographs of the CuNPs solution ((1) in sunlight, (2) in UV-light of 365 nm). (B) TEM image of CuNPs. (C) UV-vis spectra of CuSO4, CuNPs and PDDA. (D) FT-IR spectra of CuNPs, CuNPs–I− and PDDA. (E) XPS of CuNPs; (F) amplified XPS of Cu 2p electrons. | |
We performed X-ray photoelectron spectroscopy to determine the valence state of copper in the samples. The full spectrum shows that the sample is composed of C, O, N, S and Cu Fig. 2(E). As shown in Fig. 2(F), two strong peaks of 951.9 and 932.3 eV belong to 2p1/2 and 2p3/2 of zero valent Cu, consistent with previous reports.13,14 However, it is worth noting that the binding energy of Cu(0) 2p3/2 is very close to that of Cu(I). Because of the charge transfer of the Cu–N bond, the valence state of CuNPs may be between 0 and +1.
3.2 Optimization of synthesis conditions
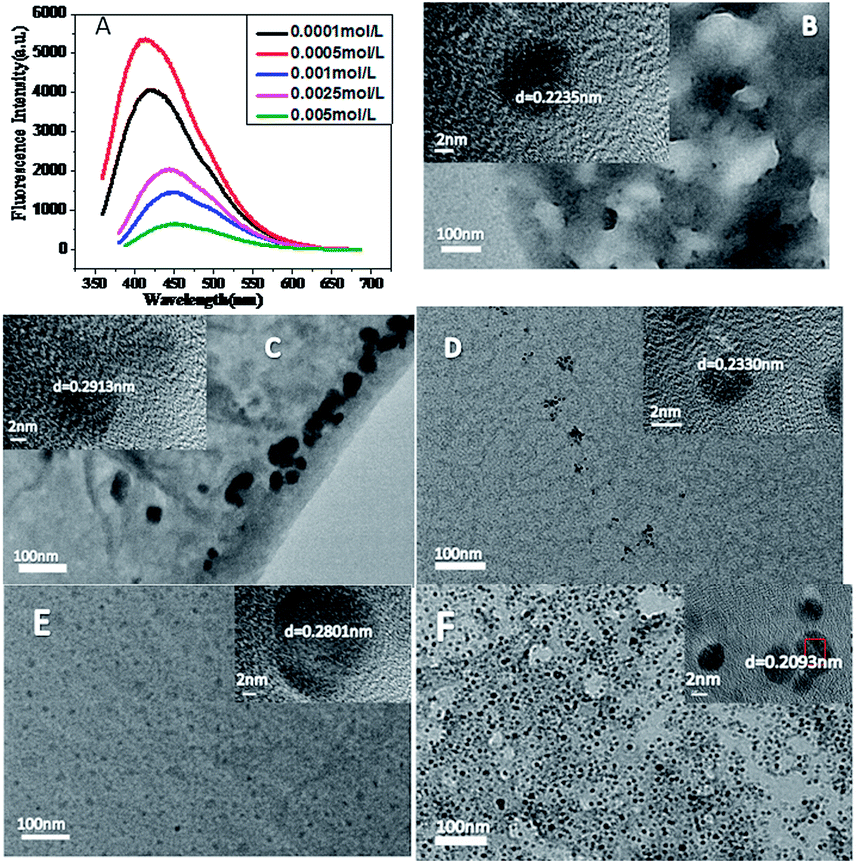
In order to improve the excellent performance of CuNPs, we optimized the synthesis time, temperature and CuSO4 concentration of CuNPs. As shown in Fig. 3(A), the intensity of CuNPs synthesized by different concentrations of CuSO4 at the emission wavelength was the highest when the concentration of CuSO4 was 0.0005 mol L−1. Fig. 3(B–F) are TEM diagrams of CuNPs synthesized from CuSO4 at different concentrations. It can be seen that at low concentration of CuSO4, the higher the intensity of the synthesized CuNPs, the better the particle size and dispersion of the corresponding CuNPs. Therefore, the best concentration of CuSO4 was 0.0005 mol L−1.
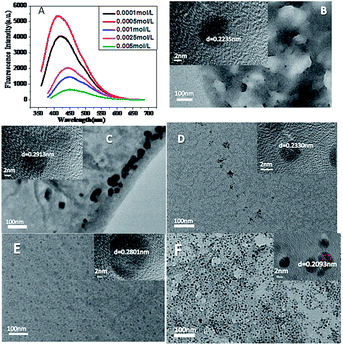 |
| | Fig. 3 (A) Fluorescence spectra of CuNPs at different concentrations of Cu2+; (B, C, D, E, F) are TEM images of CuNPs at Cu2+ of 0.005 mol L−1; 0.0025 mol L−1; 0.001 mol L−1; 0.0005 mol L−1; 0.0001 mol L−1, respectively. | |
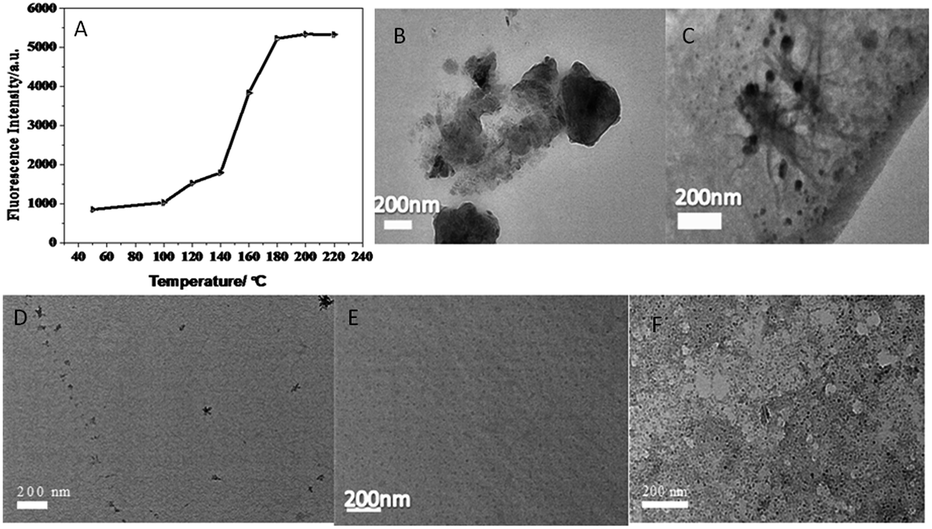
Fig. 4 shows the fluorescence intensity diagram and TEM diagram of CuNPs synthesized at different temperatures. It can be seen from the diagram that the fluorescence intensity of CuNPs is better at 180 °C, and the higher the temperature, the smaller the particle size and the better the dispersion of CuNPs. Therefore, the optimum temperature for the synthesis of CuNPs is 180 °C. Fig. S2† is the CuNPs synthesis time and fluorescence intensity map. As can be seen from the graph, when the synthetic time is 12 h, the intensity of the strong light is the highest, so the synthetic time is 12 h.
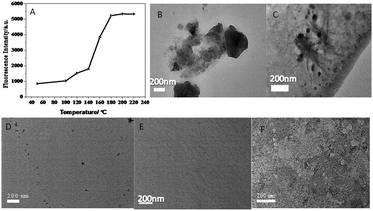 |
| | Fig. 4 (A) Temperature and fluorescence intensity diagram; (B, C, D, E, F) are TEM images of CuNPs at temperatures of 100 °C, 120 °C, 160 °C, 180 °C, 220 °C, respectively. | |
3.3 Stability of CuNPs
In the experiments, we found that the synthesized CuNPs have strong stability. As shown in Fig. S3,† the fluorescence intensity of CuNPs does not change at all with time. The synthesized CuNPs can be kept for about 2 months at 4 °C. The pH of synthetic CuNPs is about 4, and we examined the relationship between CuNPs and fluorescence intensity at different pH. As shown in Fig. S4,† pH hardly affects the fluorescence intensity of CuNPs. The good storage stability and good photostability of the CuNPs are demonstrated in Fig. S6,† where the CuNPs are exposed to irradiation from a Xe lamp for various time periods. According to a previous report,16 using 2-aminopyridine (0.1 M H2SO4) as a standard sample, the fluorescence quantum yield of copper nanomaterials is 7.12%.
3.4 Selectivity
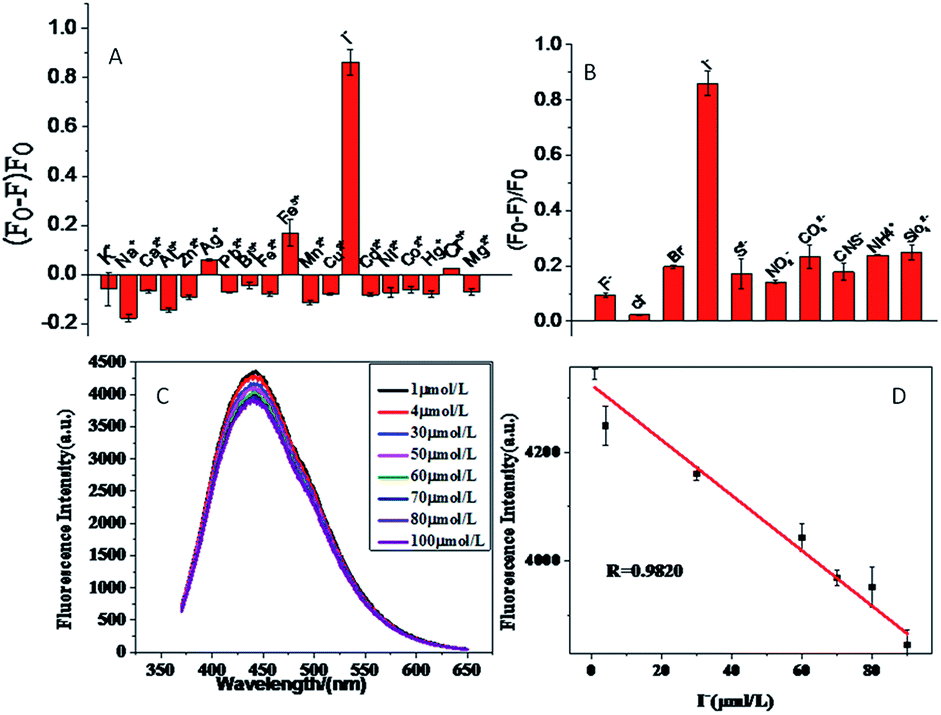
In the course of the experiment, we inspected the selectivity for 18 metal ions (K+, Ca2+, Na+, Hg2+, Al3+, Ag+, Zn2+, Pb2+, Cr3+, Fe3+, Mg2+, Cu2+, Bi3+, Fe2+, Mn2+, Cd2+, Ni2+, Co2+) and 9 non-metal ions. As shown in Fig. 5(A and B), the apparent fluorescence quenching occurs when I− is added, while the effects of other metal ions or anions are almost negligible under the same conditions. These results indicate that the fluorescence probe has high selectivity for the determination of I−.
 |
| | Fig. 5 The selectivity of Cu NPs for I− sensing as compared to the other common metal ions (A) and anions (B). (C) The concentrations of all metal ions are 100 μmol L−1. The fluorescence spectra of Cu NPs taken with different concentrations of I− (from top to bottom: 1, 4, 30, 50, 60, 70, 80, and 100 μmol L−1, respectively). (D) The relationship between the fluorescence and the concentration of I−. | |
3.5 Assaying I−
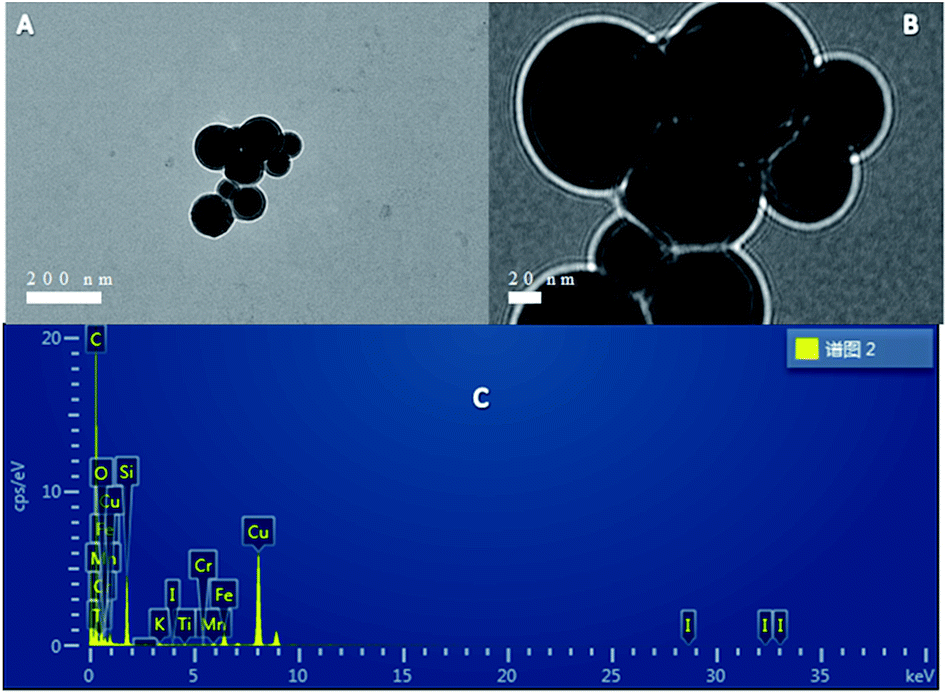
The phenomenon of quenching CuNPs fluorescence by iodine ions was investigated. As shown in Fig. 5(C), when different concentrations of iodide ions were added to the CuNPs system, the fluorescence of CuNPs appeared to be quenched to varying degrees. As shown in Fig. 5(D), the degree of fluorescence quenching of CuNPs has a good linear relationship when the concentration of iodide ion is 1–100 μmol L−1. The linear equation is Y = −0.50381CI− + 4331, and the correlation coefficient R = 0.9820. The detection limit is 0.45 μmol L−1 and the signal to noise ratio (S/N) is 3. Fig. 6(A and B) is a TEM diagram of CuNPs–I− of different sizes. It can be seen that the particle size of the CuNPs–I− is larger and aggregated. This may be due to the positive charge of the synthesized CuNPs band, and the electrostatic action adsorbs the negatively charged iodine ion15 of the band, resulting in the aggregation of CuNPs and the quenching of CuNPs fluorescence. During the experiment, we found that when iodine ions were added to the CuNPs system, precipitation would occur and CuNPs would also aggregate, resulting in a decrease in fluorescence. As shown in Fig. 6(C), it is not difficult to detect the presence of iodine in the EDS diagram. This proves that the addition of iodine ions to the CuNPs leads to the aggregation of CuNPs and the quenching of fluorescence.
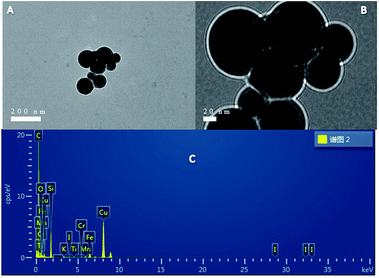 |
| | Fig. 6 (A, B) TEM images showing different sizes; (C) EDS of Cu NPs showing the presence of I− (100 μmol L−1). | |
3.6 Detection of I− in water samples
In order to test the practicability of this method, the standard addition method was used to add iodide ion to the sample to be tested. The recovery rate of I− in tap water was about 97.3–103%, and the recovery rate of I− in the Yellow River water was about 93.7–110%, indicating that this method can be used to detect iodide in actual water samples (Table 1).
Table 1 Recovery of added I− in tap water and Yellow River water samples (n = 3)
| Sample |
I− supplemented (μmol L−1) |
I− measured (μmol L−1) |
Recovery (%) |
RSD (n = 3) |
| 1 |
30 |
30.9 |
103% |
4.6 |
| 60 |
58.4 |
97.3% |
7.8 |
| 80 |
82.1 |
102.6% |
11.2 |
| 2 |
30 |
28.1 |
93.7% |
8.2 |
| 60 |
63.4 |
105.7% |
11.9 |
| 80 |
88.1 |
110% |
6.8 |
3.7 Catalytic application
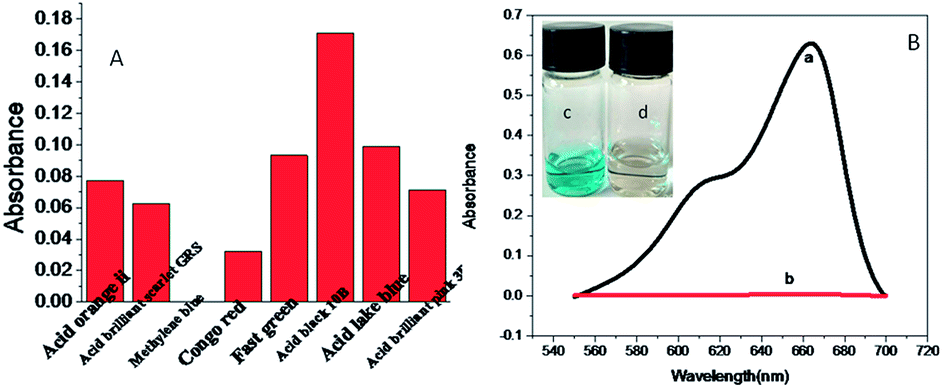
During the experiment, we found an interesting phenomenon. CuNPs can serve as a catalyst to accelerate the reaction. As shown in Fig. 7(A), the catalytic activity of CuNPs toward different dyes (acid orange II, acid red GRS, methylene blue, Congo red, solid green, acid black 10B, acid lake blue, acidic peach red 3B) was investigated. It was found that CuNPs can only accelerate the catalytic activity of methylene blue. Due to their ultra-small size, copper nanomaterials exhibit strong catalytic activity.9 The catalytic ability of copper clusters was investigated by using hydrazine hydrate as a reducing dye and methylene blue as a model reaction. As shown in Fig. 7(B), the UV absorption peak of the methylene blue dye and hydrazine mixture is 654 nm, and the absorption strength was not changed for a period of time. CuNPs were added to the reaction mixture and the bright blue color completely disappeared within one minute. The high catalytic activity of copper nanomaterials is due to the LUMO level of copper nanomaterials above the redox potential of methylene blue, and under the redox potential of hydrazine hydrate. Fig. S5† shows the relationship between the volume of CuNPs added and the catalytic time. When the volume of CuNPs was 110 μL, the catalytic time was the shortest.
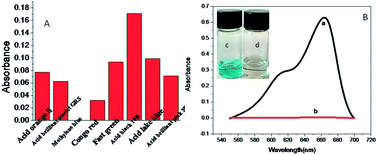 |
| | Fig. 7 (A) The selectivity of Cu NPs for methylene blue dye as compared to other dyes. (B) The ultraviolet absorption spectrum of the initial mixture of methylene blue dye and hydrazine hydrate is marked as (a); (b) is the ultraviolet absorption spectrum after 3 seconds of adding 100 μM copper clusters to the mixture; (c) and (d) are the optical photographs showing the solution before and after the addition of CuNPs, respectively. | |
4 Conclusions
In this study, a simple one-pot method was used to synthesize CuNPs. Based on the selective fluorescence quenching of CuNPs by iodide ions, a simple and sensitive new method for the detection of iodide ions has been developed. As an effective catalyst and sensitive sensor, CuNPs show excellent performance. In view of the simple synthesis method and excellent fluorescence properties, CuNPs have good application prospects in the imaging, sensing and catalysis fields.
Conflicts of interest
There are no conflicts to declare.
Acknowledgements
This work was supported by the National Natural Science Foundation of China (Grant No. 21864020 and No. 51503106), the Natural Science Foundation of Inner Mongolia (Grant no. 2018MS02012), Collaborative Innovation Center for Water Environmental Security of Inner Mongolia Autonomous Region, China, (Grant no. XTCX003), the Inner Mongolia Innovation Guide Project and Research Project of Higher School, Department of Education of Inner Mongolia Autonomous Region (Grant no. NJZC16047).
Notes and references
- T. Zhou, M. Rong and Z. Cai,
et al., Sonochemical synthesis of highly fluorescent glutathione-stabilized Ag nanoclusters and S2− sensing, Nanoscale, 2012, 4(14), 4103–4106 RSC.
- Z. X. Wang, C. L. Zheng and S. N. Ding, Label-free detection of sulfide ions based on fluorescence quenching of unmodified core–shell Au@Ag nanoclusters, RSC Adv., 2014, 4(19), 9825–9829 RSC.
- W. Y. Chen, G. Y. Lan and H. T. Chang, Use of Fluorescent DNA-Templated Gold/Silver Nanoclusters for the Detection of Sulfide Ions, Anal. Chem., 2011, 83(24), 9450–9455 CrossRef CAS PubMed.
- D. Lu, L. Liu and F. Li,
et al., Lysozyme-stabilized gold nanoclusters as a novel fluorescence probe for cyanide recognition, Spectrochim. Acta, Part A, 2014, 121(5), 77–80 CrossRef CAS PubMed.
- C. Zong, L. R. Zheng and W. He,
et al., In Situ Formation of Phosphorescent Molecular Gold(I) Cluster in a Macroporous Polymer Film to Achieve Colorimetric Cyanide Sensing, Anal. Chem., 2014, 86(3), 1687–1692 CrossRef CAS PubMed.
- H. Liu, G. Yang and E. S. Abdel-Halim,
et al., Highly selective and ultrasensitive detection of nitrite based on fluorescent gold nanoclusters, Talanta, 2013, 104(2), 135–139 CrossRef CAS PubMed.
- S. Watanabe, H. Seguchi and K. Yoshida,
et al., Colorimetric detection of fluoride ion in an aqueous solution using a thioglucose-capped gold nanoparticle, Tetrahedron Lett., 2005, 46(51), 8827–8829 CrossRef CAS.
- M. Zhang, Y. Q. Liu and B. C. Ye, Colorimetric assay for sulfate using positively-charged gold nanoparticles and its application for real-time monitoring of redox process, Analyst, 2011, 136(21), 4558–4562 RSC.
- N. Vilarvidal, J. Rivas and M. A. Lópezquintela, Size Dependent Catalytic Activity of Reusable Subnanometer Copper(0) Clusters, ACS Catal., 2012, 2(8), 1693–1697 CrossRef CAS.
- X. Yang, Y. Feng and S. Zhu,
et al., One-step synthesis and applications of fluorescent Cu nanoclusters stabilized by L-cysteine in aqueous solution, Anal. Chim. Acta, 2014, 847, 49–54 CrossRef CAS PubMed.
- D. Q. Yang, J. F. Rochette and E. Sacher, Spectroscopic evidence for pi–pi interaction between poly(diallyl dimethylammonium) chloride and multiwalled carbon nanotubes, J. Phys. Chem. B, 2005, 109(10), 4481–4484 CrossRef CAS.
- K. Liu, J. Zhang and G. Yang,
et al., Direct electrochemistry and electrocatalysis of hemoglobin based on poly(diallyldimethylammonium chloride) functionalized graphene sheets/room temperature ionic liquid composite film, Electrochem. Commun., 2010, 12(3), 402–405 CrossRef CAS.
- K. J. Koski, J. J. Cha and B. W. Reed,
et al., High-density chemical intercalation of zero-valent copper into Bi2Se nanoribbons, ChemInform, 2012, 43(34), 7584–7587 CrossRef.
- W. Wang, F. Leng and L. Zhan,
et al., One-step prepared fluorescent copper nanoclusters for reversible pH-sensing, Analyst, 2014, 139(12), 2990–2993 RSC.
- L. Yuan and Y. He, Effect of surface charge of PDDA-protected gold nanoparticles on the specificity and efficiency of DNA polymerase chain reaction, Analyst, 2013, 138(2), 539–545 RSC.
- R. Rusakowi and A. C. Testa, J. Phys. Chem., 1968, 72, 2680–2681 CrossRef.
Footnote |
| † Electronic supplementary information (ESI) available. See DOI: 10.1039/c8ay01871e |
|
| This journal is © The Royal Society of Chemistry 2019 |
Click here to see how this site uses Cookies. View our privacy policy here. 
 *a
*a