Reduced graphene oxide-gold nanoparticles-catalase-based dual signal amplification strategy in a spatial-resolved ratiometric electrochemiluminescence immunoassay†
Jun-Tao
Cao
 *a,
Xiao-Long
Fu
a,
Fu-Rao
Liu
a,
Shu-Wei
Ren
b and
Yan-Ming
Liu
 *a
*a
aCollege of Chemistry and Chemical Engineering, Institute for Conservation and Utilization of Agro-bioresources in Dabie Mountains, Xinyang Normal University, Xinyang 464000, China. E-mail: liuym9518@sina.com; jtcao11@163.com
bXinyang Central Hospital, Xinyang 464000, China
First published on 9th November 2019
Abstract
A novel spatial-resolved electrochemiluminescent (ECL) ratiometry for cardiac troponin I (cTnI) analysis was developed using resonance energy transfer (RET) and a coreactant consumption strategy for signal amplification. Specifically, the spatial-resolved dual-disk glassy carbon electrodes were modified with CdS nanowires (CdS NWs) and luminol-gold nanoparticles (L-Au NPs) as potential-resolved ECL emitters, respectively. After stepwise immobilization of anti-cTnI and bovine serum albumin on the dual-disk electrodes, the CdS NWs-based electrode, with varied concentrations of cTnI, was used to provide a working signal, whereas the L-Au NPs-based electrode, with a fixed amount of cTnI, was employed to provide the reference signal. To efficiently amplify the working signal on the CdS NWs-based electrode, an anti-cTnI-reduced graphene oxide-gold nanoparticles-catalase probe (anti-cTnI-rGO-Au NPs-CAT) was loaded onto the electrode to form a sandwich immunocomplex. The RET from CdS NWs to Au NPs and the coreactant (i.e. H2O2) consumption by the CAT generate a significant ECL decrease on the CdS NWs-based electrode in the presence of cTnI. This novel and sensitive ratiometric detection mode for cTnI was achieved using the ratio values of the working signal of the CdS NWs-based electrode and the reference signal of the L-Au NPs-based electrode. The integration of RET and coreactant consumption strategy in the designed spatial-resolved ratiometric platform endows the immunosensor with a wide linear range of 5.0 × 10⁻¹³ – 1.0 × 10⁻⁷ g mL−1 and a low detection limit of 0.10 pg mL−1 for cTnI. Furthermore, the method exhibits high accuracy and sensitivity for cTnI determination in human serum samples.
Introduction
Recently, acute myocardial infarction (AMI) has drawn increasing attention as it is regarded as one of the leading causes of death worldwide.1 The early exclusion or diagnosis of AMI is very important for the successful treatment of patients. Cardiac troponin I (cTnI) is accepted as the “gold standard” for evaluating patients with AMI, and is used clinically to guide the diagnosis, prognosis and risk stratification of patients with AMI.2–4 The level of cTnI can be elevated after AMI and last for more than a week.5 Therefore, the sensitive and accurate quantification of cTnI has great significance in AMI diagnosis and clinical research.Electrochemiluminescence (ECL), with advantages such as high sensitivity, low costs, simple operation and a wide linear range,6–10 would be an ideal choice for cTnI detection. In most ECL analysis, the qualitative and quantitative determination of targets is achieved based on the changes in output of one single signal. These methods could fulfill the sensitive detection of a target to some extent, while the single signal output-mode is subject to positive or negative errors owing to incidental changes such as tiny changes in the detection solution, and the fluctuation of the instrumentation,11–13 especially for the proteins found in low abundance in complex biological samples. To avoid the above-mentioned issues in the single signal output-mode, ECL ratiometric biosensors were developed by virtue of the ratio of two ECL signal changes from two corresponding potential-resolved ECL emitters.14–16 For instance, on the basis of the resonance energy transfer (RET) from g-C3N4 to Ag-PAMAM-luminol nanocomposites, Wang et al.15 constructed a ratiometric ECL sensor to detect HL-60 cells. The constructed mode avoided detection errors owing to environmental changes, but there may be cross-reactions between the two ECL materials on a single sensing interface. Recently, Wang et al.16 fabricated a label-free spatial-resolved ratiometric ECL sensor to detect the prostate specific antigen (PSA), which was quantified using the ECL intensity ratio of CdS and Ru(bpy)32+@RuSi NPs. This work combined the ratiometric and spatial-resolved techniques to solve the problem of the cross-reaction between luminescent materials on one single ECL sensing interface. However, ECL ratiometric analysis is still in its infancy and an efficient signal amplification strategy that is well matched to the ECL ratiometric platform is still sought after to further enhance the detection sensitivity.
To date, some signal amplification strategies such as RET,17–19 enzymatic catalyzed biocatalytic precipitation,20 enzymatic catalytic generation21 or consumption22 of co-reactants have been developed for ECL bioassays. For example, ECL-RET between Ru(bpy)32+ and gold nanorods (Au NRs) has been reported for H2O2 detection.23 Taking advantage of the glucose oxidase-glucose bioevent-based co-reactant generation mode and the catalytic effect of Au NRs to H2O2 in the luminol-H2O2 ECL system, Cao et al.21 prepared graphene oxide@Au NRs-glucose oxidase-streptavidin as a signal amplification probe to sensitively detect PSA. Therefore, is it feasible to combine RET and an enzymatic signal amplification strategy to further improve the performance of the ECL ratiometric assay?
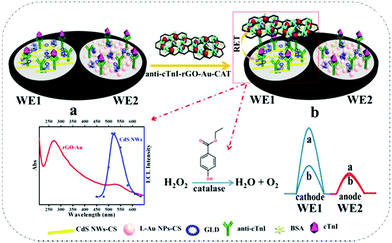
To verify the feasibility, we designed a spatial-resolved ratiometric ECL immunosensor consisting of CdS nanowires (NWs) as a cathodic ECL emitter, luminol-gold nanoparticles (L-Au NPs) as the anodic ECL emitter, and reduced graphene oxide-gold nanoparticles-catalase (rGO-Au NPs-CAT) as the dual signal-amplifying probes for cathodic ECL signal amplification. As illustrated in Scheme 1, CdS NWs and L-Au NPs were assembled onto the two disks (WE1 and WE2) of a dual-disk glassy carbon electrode, respectively. After immobilization of anti-cTnI and bovine serum albumin (BSA) on WE1 and WE2 sequentially, various concentrations of cTnI were immobilized on the WE1 and a fixed amount of cTnI was loaded onto the WE2. Finally, the anti-cTnI-rGO-Au NPs-CAT was attached onto the WE1 through the immunoreaction. In this state, owing to the RET between CdS NWs and Au NPs and the coreactant (i.e. H2O2 in this work) consumption from the CAT, an advanced ECL quench on the WE1 was observed, whereas the signal on WE2 showed no obvious change. The ECL ratiometry was accomplished using the ratio of the ECL intensity between the WE1 (the working signal) and WE2 (the reference signal).
Experimental
Materials and reagents
The cTnI (L4C00102) and anti-cTnI polyclonal antibodies (anti-cTnI, L3C00403) were purchased from Shanghai Linc-Bio Science Co., Ltd (Shanghai, China). Human immunoglobulin G (hIgG), human serum albumin (HSA), and BSA were bought from Shanghai Solarbio Bioscience and Technology Co., Ltd. Thiourea, chloroauric acid (HAuCl4), ascorbic acid (AA), chitosan (CS), glutaraldehyde (50%, GLD), and sodium borohydride (NaBH4) were obtained from the Sinopharm Chemical Reagent Co., Ltd (Shanghai, China). Cd(NO3)2, ethylenediamine, Tween 20, and polyvinyl pyrrolidone (PVP) were purchased from Seebio Biotech Co., Ltd (Shanghai, China). The 0.1 M phosphate buffer saline (PBS, pH 7.4) consisted of Na2HPO4, KH2PO4, NaCl, and KCl. All chemical reagents were of analytical grade. The human serum samples, obtained from two healthy people and four patients, were provided by Xinyang Central Hospital (Xinyang, China). All serum experiments were performed in accordance with the Guidelines of the Xinyang Central Hospital, and approved by the ethics committee at Xinyang Central Hospital. Informed consent was obtained from all human participants in this study.Apparatus
The ECL measurements were carried out on an MPI-B ECL analyzer (Xi'An Remax Electronic Science & Technology Co., Ltd, Xi'An, China). Electrochemical impedance spectroscopy (EIS) was conducted on a RST5200 electrochemical workstation (Zhengzhou, China). The ultraviolet-visible (UV-vis) absorption spectrum was taken on a UVmini-1240 UV-vis spectrophotometer (Shimadzu, Kyoto, Japan). Scanning electron microscopy (SEM) images and transmission electron microscopy (TEM) images were obtained using an S-4800 (Hitachi, Tokyo, Japan) and Tecnai G2 F20 TEM (FEI Co., Ltd, USA), respectively.Preparation of L-Au NPs, CdS NWs and rGO-Au NPs
The synthesis of L-Au NPs was performed in accordance with the previously published method.15 CdS NWs were prepared using our reported method.24 First, 2.37 g thiourea and 3.205 g Cd(NO3)2 were transferred to a round flask. After adding ethylenediamine dropwise and stirring evenly, the mixture was moved into a Teflon flask and reacted at 180 °C for 72 h. The CdS NWs were obtained by centrifuging and washing the reaction product successively several times.The rGO-Au NPs were synthesized as follows.25 First, 2 mL of GO solution (0.5 mg mL−1) was added into 4 mL of water containing 35 mg of PVP and 60 mg of AA. After heating for 10 min at 90 °C, 1 mL of HAuCl4 (3 mM) was added under stirring and the reaction was continued for 3 h. The obtained product was centrifuged and rinsed with ethanol and pure water.
Synthesis of anti-cTnI-rGO-Au NPs-CAT
To generate the rGO-Au NPs-based immunological labels, 400 μL of rGO-Au NPs was mixed with 5 μL 10% Tween 20 and shaken for 1 h. After centrifugation, the mixture was dispersed in 400 μL 0.1 M PBS. 400 μL of 50 μg mL−1 anti-cTnI and 400 μL of 50 μg mL−1 CAT were added to the rGO-Au NPs and the mixture was shaken at 37 °C for 4 h. Then the mixture was centrifuged and washed with TPBS (0.1 M PBS containing 0.05% Tween 20). The acquired anti-cTnI-rGO-Au NPs-CAT were dissolved in 400 μL TPBS containing 0.1% BSA and stored at 4 °C.Fabrication of the ECL immunosensor
As shown in Scheme 1, first the CdS NWs and L-Au NPs were separately dispersed with CS solution (0.05 mg mL−1). Then, 6 μL of CdS NWs and 6 μL of L-Au NPs were modified onto the cleaned WE1 and WE2, respectively. After drying at 60 °C, 6 μL of GLD (5%) was dropped onto WE1 and WE2 for 30 min at room temperature. Next, 6 μL of anti-cTnI (30 μg mL−1) and 6 μL of BSA were successively incubated on the dual-electrodes for 1 h at 37 °C. The redundant BSA was removed by washing with PBS. Then, 6 μL of cTnI at various concentrations was dropped onto WE1 and the same volume of cTnI at a fixed concentration of 1.0 × 10⁻⁹ g mL−1 was cast onto WE2 for 1 h at 37 °C. Finally, 6 μL of anti-cTnI-rGO-Au NPs-CAT were immobilized on WE1 for 1 h at 37 °C.Results and discussion
Characterization of CdS NWs, GO, rGO-Au NPs and L-Au NPs
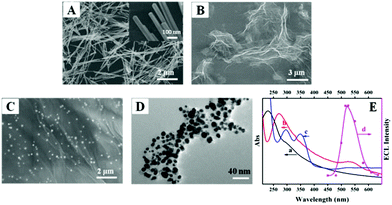
SEM and TEM were used to obtain the morphological information of the nanomaterials. Fig. 1A and B shows that the CdS possesses a nanowire morphology with an average diameter of 50 nm and a length of 1–3 μm, and the GO has a flake-like shape with many wrinkles. The SEM image shown in Fig. 1C reveals that the Au NPs were homogeneously located on the rGO surface. The TEM image of the L-Au NPs shows that the Au NPs were spherical with a diameter of about 11 nm (Fig. 1D).The UV-vis absorption and ECL emission spectra are shown in Fig. 1E. As shown in curve a, the UV-vis spectrum of GO exhibits a maximum absorption peak at 230 nm and a shoulder peak at about 298 nm. After reducing the GO and HAuCl4 with AA to form rGO-Au NPs, the absorption peak at 230 nm undergoes a red shift to 272 nm, whereas the shoulder absorption peak at 298 nm disappears and a new broad absorption peak at about 525 nm appears (curve b). The peaks at 272 and 525 nm represent the characteristic absorption peaks of rGO and Au NPs, indicating the successful synthesis of the rGO-Au NPs. Curve c indicates three characteristic peaks of L-Au NPs at 298, 345 and 520 nm. The peaks at 298 and 345 nm are attributed to luminol, whereas the peak of 520 nm corresponds to the plasmon band of the Au NPs. The ECL emission spectrum for the CdS NWs shows that the maximum emission wavelength of the nanomaterial is located at 520 nm (curve d). The overlap of the ECL emission spectrum of CdS NWs with the UV-vis absorption of Au NPs on rGO demonstrates the feasibility of the ECL-RET process.
Characterization of the immunosensor
EIS is a powerful technique used to investigate the interface changes of electrodes, and was employed here to monitor the stepwise assembly processes of the WE1 and WE2 of the immunosensor. As shown in Fig. 2A and B, both the bare WE1 and WE2 give a small electron transfer resistance (Ret, curve a). After modification of CdS NWs-CS and L-Au NPs-CS on WE1 and WE2 (curves b in Fig. 2A and B), respectively, the Ret of the two electrodes increased owing to the poor conductivity of the semiconductor and the CS molecules. After the successive assembly of GLD, anti-cTnI, BSA, and cTnI on two electrodes, the Ret produced a further increase owing to the hindrance effect of the linking molecules and the insulating effect of the proteins (curves c–e in Fig. 2A and B). When incubating the anti-cTnI-rGO-Au NPs-CAT on WE1 (curves f in Fig. 2A), the Ret increased obviously, indicating successful immunoreactions between the cTnI on WE1 and anti-cTnI on the anti-cTnI-rGO-Au NPs-CAT.The ECL behaviors of the stepwise modified immunosensor were also recorded. As exhibited in Fig. 2C, the bare WE1 and WE2 emitted almost no ECL signals (curve a). After immobilizing with CdS NWs-CS and L-Au NPs-CS (curve b), two strong ECL emissions were observed, respectively. When 5% GLD, anti-cTnI, BSA, and cTnI were incubated successively, the ECL signal on the WE1 and WE2 presented a gradual decline (curve c, d and e) because of the hindrance of the electron transfer. Noticeably, the immobilization of anti-cTnI-rGO-Au NPs-CAT on WE1 brought about a sharp ECL decrease (curve f). This decrease could be ascribed to the following two reasons: (i) the effective RET between CdS NWs and rGO-Au NPs could result in an ECL decrease on WE1; (ii) the CAT can catalyze the decomposition of the co-reactant H2O2 into oxygen and water, thereby effectively consuming the H2O2 around the electrode interface and further quenching the ECL intensity of the cathodic ECL. The dual signal quenching sourced from the ECL-RET and the coreactant consumption on the WE1 provides dual amplification for the subsequent ECL ratiometry.
Condition optimization
Experimental factors including the H2O2 concentration and pH value of the PBS were optimized. Fig. S1A† depicts the effect of H2O2 concentration on the ECL signal in the range of 5–30 mM. When the concentration of H2O2 increased, the ECL intensity on both electrodes increased and then reached a platform at 20 mM. Therefore, 20 mM H2O2 was used in further experiments.The pH value of the PBS was screened. As shown in Fig. S1B,† upon increasing the pH value, the ECL signal of the two disks increased up to pH 7.4. When the pH exceeded 7.4, the ECL intensity on WE1 gradually decreased, while the response on WE2 gradually increased. The increase of ECL on WE2 could originate from the high ECL efficiency of the L-Au NPs in an alkaline environment. Considering the application of the designed sensor in a biological system, pH 7.4 was selected.
Analytical performance
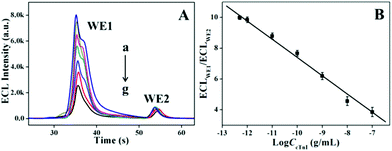
The ECL performances of the sensor towards a series of concentrations of the target cTnI were tested. As illustrated in Fig. 3A, the ECL signal on WE1 with varied concentrations of cTnI shows a decreasing variation trend accompanied by the increment of the concentration, whereas WE2 with a fixed concentration of cTnI reveals an almost constant value. Using the change in ECL intensity from WE1 as the working signal (ECLWE1) and the change in ECL intensity of WE2 as the reference value (ECLWE2), the change in ratio of ECLWE1/ECLWE2 decreased proportionally with the logarithm of the cTnI concentration increasing in the range of 5.0 × 10⁻¹³ to 1.0 × 10⁻⁷ g mL−1. The linear equation is I (representing the ratio of ECLWE1 to ECLWE2) = −1.18 log![[thin space (1/6-em)]](https://www.rsc.org/images/entities/char_2009.gif) CcTnI − 4.44 (R = 0.995) (Fig. 3B), and the limit of detection was experimentally measured to be 0.10 pg mL−1. Moreover, compared with some reports (Table 1), the proposed method exhibits a wide linear range and high sensitivity for cTnI detection.26–29 These advanced performances could be attributed to the ingenious integration of a dual signal amplification strategy with the spatial-resolved ratiometry.
CcTnI − 4.44 (R = 0.995) (Fig. 3B), and the limit of detection was experimentally measured to be 0.10 pg mL−1. Moreover, compared with some reports (Table 1), the proposed method exhibits a wide linear range and high sensitivity for cTnI detection.26–29 These advanced performances could be attributed to the ingenious integration of a dual signal amplification strategy with the spatial-resolved ratiometry.
Specificity and stability of the sensor
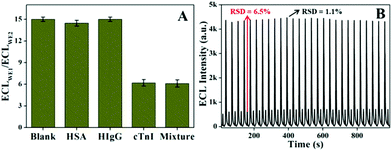
To investigate the selectivity of the immunosensor, cTnI (1.0 ng mL−1), HSA (40 mg mL−1), hIgG (1.0 mg mL−1), and the above mentioned mixture were tested. The results in Fig. 4A demonstrated that the ECL intensity for HSA or hIgG is similar to that of the blank solution. Furthermore, there is no significant difference in the ECL responses for the mixture of cTnI and the two interfering proteins and cTnI only. The data indicate that the platform has a good selectivity for cTnI. The stability of the immunosensor was examined using continuous cyclic potential scanning for 27 cycles (Fig. 4B). The relative standard deviations (RSD) for 1.0 ng mL−1 cTnI on WE1 and WE2 are 1.1% and 6.5%, respectively.Analytical applications
The applicability of the sensor was examined by measuring the content of cTnI in human serum samples from two healthy people (1, 2) and four patients (3–6) with suspected myocardial infarction. These samples were measured directly without special treatment. The results from the proposed method were consistent with the reference values provided by Xinyang Central Hospital with relative errors of no more than 10.0% (Table S1†). In addition, the recovery of the method was measured using the standard addition method in two human serum samples. As listed in Table S2,† the recoveries of cTnI range from 90.0% to 110.0%, and the RSD values are less than 6.7%, indicative of the feasibility of this system for practical applications.Conclusions
In conclusion, a novel spatial-resolved ratiometric ECL immunosensor for cTnI detection is presented using CdS NWs and L-Au NPs as potential-resolved ECL emitters and rGO-Au NPs-CAT for dual signal amplification. The introduction of rGO-Au NPs-CAT triggered the occurrence of RET and coreactant consumption on the CdS NWs-based electrode and thus resulted in a dramatic ECL decrement. By combining these ECL quenching effects with the spatial-resolved ratiometry, the developed ECL immunoanalysis exhibits accurate and sensitive detection of cTnI. Furthermore, this method demonstrated a good potential for using in practical applications. We envisage that the ingenious integration of the versatile signal amplification strategy with the ECL ratiometry could furnish new insights for ECL biochemical analysis in the field of accurate and sensitive detection of biomarkers.Conflicts of interest
There are no conflicts to declare.Acknowledgements
This work was supported by the National Natural Science Foundation of China (Grant 21675136, 21874115), the Zhongyuan Thousand Talents Program of Henan Province, Science & Technology Innovation Talents in Universities of Henan Province (18HASTIT003), the Funding Scheme for the Young Backbone Teachers of Higher Education Institutions in Henan Province (2016GGJS-097), and the Nanhu Young Scholar Supporting Program of XYNU.References
- J. C. Kwong, K. L. Schwartz, M. A. Campitelli, H. Chung, N. S. Crowcroft, T. Karnauchow, K. Katz, D. T. Ko, A. J. McGeer, D. McNally, D. C. Richardson, L. C. Rosella, A. Simor, M. Smieja, G. Zahariadis and J. B. Gubbay, N. Engl. J. Med., 2018, 378, 345–353 CrossRef PubMed.
- E. Bonnefoy, P. Godon, G. Kirkorian, M. Fatemi, P. Chevalier and P. Touboul, Eur. Heart J., 2000, 21, 832–836 CrossRef CAS PubMed.
- C. W. Hamm, B. U. Goldmann, C. Heeschen, G. Kreymann, J. Berger and T. Meinertz, N. Engl. J. Med., 1997, 337, 1648–1653 CrossRef CAS PubMed.
- A. S. V. Shah, A. Anand, Y. Sandoval, K. K. Lee, S. W. Smith, P. D. Adamson, A. R. Chapman, T. Langdon, D. Sandeman, A. Vaswani, F. E. Strachan, A. Ferry, A. G. Stirzaker, A. Reid, A. J. Gray, P. O. Collinson, D. A. McAllister, F. S. Apple, D. E. Newby and N. L. Mills, Lancet, 2015, 386, 2481–2488 CrossRef CAS.
- F. S. Apple, L. A. Pearce, S. W. Smith, J. M. Kaczmarek and M. M. Murakami, Clin. Chem., 2009, 55, 930–937 CrossRef CAS.
- S. S. Liu, H. X. Yuan, H. T. Bai, P. B. Zhang, F. T. Lv, L. B. Liu, Z. H. Dai, J. C. Bao and S. Wang, J. Am. Chem. Soc., 2018, 140, 2284–2291 CrossRef CAS.
- L. L. Li, Z. Y. Zhang, Y. Chen, Q. Xu, J. R. Zhang, Z. X. Chen, Y. Chen and J. J. Zhu, Adv. Funct. Mater., 2019, 29, 1902533 CrossRef.
- M. H. Shamsi, K. Choi, A. H. C. Ng, D. Chamberlain and A. R. Wheeler, Biosens. Bioelectron., 2016, 77, 845–852 CrossRef CAS.
- S. Carrara, A. Aliprandi, C. F. Hogan and L. D. Cola, J. Am. Chem. Soc., 2017, 139, 14605–14610 CrossRef CAS.
- W. Zhang, H. W. Xiong, M. M. Chen, X. H. Zhang and S. F. Wang, Biosens. Bioelectron., 2017, 96, 55–61 CrossRef CAS.
- X. Y. Xie, H. J. Wang, L. Zhang, Y. T. Liu, Y. Q. Chai, Y. L. Yuan and R. Yuan, Sens. Actuators, B, 2018, 258, 1146–1151 CrossRef CAS.
- D. M. Qin, X. H. Jiang, G. H. Mo, J. S. Feng, C. H. Yu and B. Y. Deng, ACS Sens., 2019, 4, 504–512 CrossRef CAS PubMed.
- L. Zhang, Y. He, H. J. Wang, Y. L. Yuan, R. Yuan and Y. Q. Chai, Biosens. Bioelectron., 2015, 74, 924–930 CrossRef CAS.
- H. M. Chen, H. Zhang, R. Yuan and S. H. Chen, Anal. Chem., 2017, 89, 2823–2829 CrossRef CAS.
- Y. Z. Wang, N. Hao, Q. M. Feng, H. W. Shi, J. J. Xu and H. Y. Chen, Biosens. Bioelectron., 2016, 77, 76–82 CrossRef CAS.
- Y. L. Wang, F. R. Liu, J. T. Cao, S. W. Ren and Y. M. Liu, Biosens. Bioelectron., 2018, 102, 525–530 CrossRef CAS.
- P. Zhang, Z. Y. Li, H. J. Wang, Y. Zhuo, R. Yuan and Y. Q. Chai, Nanoscale, 2017, 9, 2310–2316 RSC.
- H. Ke, H. F. Sha, Y. F. Wang, W. W. Guo, X. Zhang, Z. M. Wang, C. S. Huang and N. Q. Jia, Biosens. Bioelectron., 2018, 100, 266–273 CrossRef CAS.
- F. Sun, Z. Y. Wang, Y. Q. Feng, Y. X. Cheng, H. X. Ju and Y. W. Quan, Biosens. Bioelectron., 2018, 100, 28–34 CrossRef CAS PubMed.
- Y. M. Liu, J. J. Yang, J. T. Cao, J. J. Zhang, Y. H. Chen and S. W. Ren, Sens. Actuators, B, 2016, 232, 538–544 CrossRef CAS.
- J. T. Cao, J. J. Yang, L. Z. Zhao, Y. L. Wang, H. Wang, Y. M. Liu and S. H. Ma, Biosens. Bioelectron., 2018, 99, 92–98 CrossRef CAS.
- F. R. Liu, J. T. Cao, Y. L. Wang, X. L. Fu, S. W. Ren and Y. M. Liu, Sens. Actuators, B, 2018, 276, 173–179 CrossRef CAS.
- M. S. Wu, Z. Q. Chen, H. Y. Xu and A. P. Zhang, Sci. China: Chem., 2017, 60, 410–414 CrossRef CAS.
- J. T. Cao, F. R. Liu, X. L. Fu, J. X. Ma, S. W. Ren and Y. M. Liu, Chem. Commun., 2019, 55, 28–29 Search PubMed.
- J. L. Wang, F. J. Trindade, C. B. de Aquino, J. C. Pieretti, S. H. Domingues, R. A. Ando and P. H. C. Camargo, Chem. – Eur. J., 2015, 21, 9889–9894 CrossRef CAS PubMed.
- T. Zhang, N. Ma, A. Ali, Q. Wei, D. Wu and X. Ren, Biosens. Bioelectron., 2018, 119, 176–181 CrossRef CAS.
- Y. Tan, Y. Y. Wang, M. S. Li, X. X. Ye, T. Wu and C. Y. Li, Biosens. Bioelectron., 2017, 91, 741–746 CrossRef CAS PubMed.
- X. F. Tan, L. H. Zhang, Q. R. Tang, G. X. Zheng and H. Li, Microchim. Acta, 2019, 186, 280 CrossRef PubMed.
- M. Tang, Z. X. Zhou, L. Shangguan, F. Zhao and S. Q. Liu, Talanta, 2018, 180, 47–53 CrossRef CAS PubMed.
Footnote |
| † Electronic supplementary information (ESI) available. See DOI: 10.1039/c9an02056j |
| This journal is © The Royal Society of Chemistry 2020 |


